USDJPY | Perspective for the new weekThe price moved 40pips in our direction since my last publication (see link below for reference purposes) before finding Lower Lows to project a certain level of weakness in the GReenback. With the latest development in price action, I am keeping my expectations for further strength in the Japanese yen high in the coming week(s).
Tendency: Downtrend ( Bearish )
Structure: Double Top (Reversal Pattern) | Supply & Demand
Observation: i. DT (Reversal pattern): The appearance of a Bearish pattern that forms after the price reaches a culmination @ Y104.200/104.400 area two consecutive times with a moderate decline between the two highs points at the risk of further decline in price.
ii. The recent Lower Lows explains the inability of buyers to push the price beyond Y104.400 last week hereby negating my previous broadcast (see link below).
iii. Y103.900 level appears to be our New Supply level in the coming week(s) as price keep finding Lower Lows.
iv. To be more cautious could welcome the idea of waiting for a significant Breakdown of Neckline @ Y104.500 before joining the decline.
Trading plan: SELL confirmation with a minimum potential profit of 150 pips.
Risk/Reward : 1:5
Potential Duration: 4 to 10 days
NB: This speculation can be considered to make decisions on lower timeframes.
Watch this space for updates as price action is been monitored.
Risk Disclaimer:
Margin trading in the foreign exchange market (including foreign exchange trading, CFDs, etc.) has a high risk and is not suitable for all investors. The content of this speculation (including all data) is organized and published by me for the sole purpose of education and assistance in making independent investment decisions. All information herein is for your reference only and I take no responsibility.
You are hereby advised to carefully consider your investment experience, financial situation, investment objective, risk tolerance level, and consult your independent financial adviser as to the suitability of your situation prior to making any investment.
I do not guarantee its accuracy and is not liable for any loss or damage which may result directly or indirectly from such content or the receipt of any instruction or notification therewith.
Past performance is not necessarily indicative of future results.
Usdjpysignals

USDJPY | Perspective for the new weekMy last publication on this pair fetched us over 200 pips (see link below for reference purposes) and it appears another trading opportunity is coming in!
The Greenback has been on a spiral downtrend until last week when price turned around to show signs of strength as it breaks out of Bearish trendline to set up a possible rally in the coming week(s). The Greenback appears to flex muscle as the idea of stimulus coming out of the United States lingers.
Tendency: Uptrend ( Bullish )
Structure: Breakout | Supply & Demand | Trendline
Observation: i. Breakout of Bearish Trendline and Support/Resistance (key level @ Y103.700) last week gives the impression that we might at least experience a change in trend.
ii. With this Breakout, we might have to be patient to see the extent at which the corrective phase will go before hopping on the rally.
Trading plan: BUY confirmation with a minimum potential profit of 120 pips.
Risk/Reward : 1:3
Potential Duration: 2 to 5 days
NB: This speculation can be considered to make decisions on lower timeframes.
Watch this space for updates as price action is been monitored.
Risk Disclaimer:
Margin trading in the foreign exchange market (including foreign exchange trading, CFDs, etc.) has a high risk and is not suitable for all investors. The content of this speculation (including all data) is organized and published by me for the sole purpose of education and assistance in making independent investment decisions. All information herein is for your reference only and I take no responsibility.
You are hereby advised to carefully consider your investment experience, financial situation, investment objective, risk tolerance level, and consult your independent financial adviser as to the suitability of your situation prior to making any investment.
I do not guarantee its accuracy and is not liable for any loss or damage which may result directly or indirectly from such content or the receipt of any instruction or notification therewith.
Past performance is not necessarily indicative of future results.

SHORT USDJPYConfluences:
+ MACD divergence
+ Fibonacci Retracement 0.5 + 0.6
+ Flip Zone
- Take Profit:
+ next Support / Resistance
+ Or Price Action ( My Favorite way )

USD/JPY- Bearish Elliott Wave and Ascending Triangle Pattern USD/JPY has made the bearish Elliott wave pattern. At the end of the corrective waves, there is an ascending triangle pattern. After that, if the consecutive candles break 104.050, then the trend will rise and hit the following level 104.100 - 104.150 .
But, according to EMA trend will continue to move downwards and knock the following target 103.945 - 103.920- 103.860 . But there is the possibility of reversal, too. Then it will continue as an ascending triangle.

USD/JPY is making a Formation of the Double Top PatternIt's an hourly chart of USD/JPY. The USD/JPY is trying to make a structure of the double top pattern. But rightnow, we can't call it a double top pattern. If it crosses the neckline then, it will become a double top pattern. To touch the neckline, it has to cross 104.26 . I have applied the indicator (RSI), which indicates a fall.
But what if it continues to grow?
If it does not stop to grow, then it will touch 105.06 .

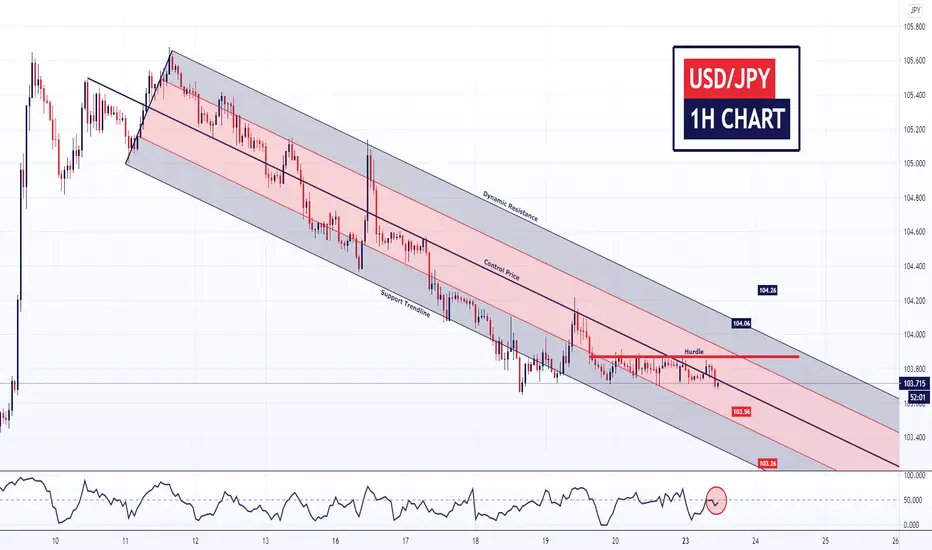
Time to Expose the Next Step of USD/JPY with PitchforkHere, I am presenting USD/JPY with a pitchfork to assume the next step. At 103.90 there is a hurdle . At present, the trend is moving sideways. But if it crosses the hurdle(103.90) , then it will touch the following targets 104.06 - 104.26 . And if there is a beginning of fall, then the targets for the intraday traders will be 103.56 - 103.26 .


USDJPY Is is still SOER?Pattern: Channel Down on 1D.
Signal: Sell as the rejection pattern on the 1D MA50 (blue trend-line) has been very consistent since July. Also the RSI is hitting the 4 month Resistance.
Target: 102.300 (1.382 Fibonacci extension).
Most recent USDJPY trade:
** Please support this idea with your likes and comments, it is the best way to keep it relevant and support me. **
--------------------------------------------------------------------------------------------------------
!! Donations via TradingView coins also help me a great deal at posting more free trading content and signals here !!
🎉 👍 Shout-out to TradingShot's 💰 top TradingView Coin donor 💰 this week ==> TradingSafely
--------------------------------------------------------------------------------------------------------

USDJPY Trading PlanPattern: Channel Down on 1D.
Signal: (A) Buy as long as the Support holds, (B) Sell if it breaks.
Target: (A) 105.000 (potential contact point with the 1D MA50), (B) 103.230 (1.382 Fibonacci extension).
Most recent USDJPY signal still running:
** Please support this idea with your likes and comments, it is the best way to keep it relevant and support me. **
--------------------------------------------------------------------------------------------------------
!! Donations via TradingView coins also help me a great deal at posting more free trading content and signals here !!
🎉 👍 Shout-out to TradingShot's 💰 top TradingView Coin donor 💰 this week ==> TradingView
--------------------------------------------------------------------------------------------------------


USDJPY | PERSPECTIVE FOR THE NEW WEEKIt is over 60pips in the opposite direction of my last speculation (see link below for reference purposes) as the price rejects my previous Demand level hereby increasing the further risk of a decline. The US Dollar came under pressure in the late Asian session on Friday and dropped below Y105.000; even though there was a mild rejection of this level, it is not strong enough to ignore the Bearish tendency as a diagnosis of President Trump and First Lady Melania with COVID-19 shift sentiments.
Tendency: Downtrend ( Bearish )
Structure: Trendline | Supply & Demand | Harmonic (AB = CD)
Observation: i. Price continues to respect Bearish Trendline on Daily chart paving way for a risk of further decline in the coming week(s).
ii. Further Breakdown of Key Level @ Y105.200 might be a confirmation of my bias as I look forward to AB = CD pattern formation with details below;
iii. ABCD parameters;
a. Impulse A-to-B will be in harmony with the potential C-to-D leg.
b. The B- to-C leg is at 61.8% Fibonacci retracement of the A-to-B leg.
c. The C-to-D leg is expected to fall within 127.2 - 1.414% Fib. ext. of the A-to-B move.
Trading plan: SELL confirmation with a minimum potential profit of 200 pips.
Risk/Reward: 1:5
Potential Duration: 5 to 12 days
NB: This speculation can be considered to make decisions on lower timeframes.
Watch this space for updates as price action is been monitored.
Risk Disclaimer:
Margin trading in the foreign exchange market (including foreign exchange trading, CFDs, etc.) has a high risk and is not suitable for all investors. The content of this speculation (including all data) is organized and published by me for the sole purpose of education and assistance in making independent investment decisions. All information herein is for your reference only and I take no responsibility.
You are hereby advised to carefully consider your investment experience, financial situation, investment objective, risk tolerance level, and consult your independent financial adviser as to the suitability of your situation prior to making any investment.
I do not guarantee its accuracy and is not liable for any loss or damage which may result directly or indirectly from such content or the receipt of any instruction or notification therewith.
Past performance is not necessarily indicative of future results.

USD/JPY's futhere movesIn the previous week USD/JPY gained +1.261 points.
From the last candle there will be an uptrend to the parallel channel and then price will start to fall again.
Here, the hurdle is 106.06 level. If candles consecutively crosses the dynamic resistance(DR) there will be an uptrend and price will increase to the 106.76 or above but if candles continuously move downwards under the DR or parallel channel, In this situation trend will be continue to move in the same direction and it will decrease to the control price or more. If trend crosses the hurdle there will be the first target of 105.86 level and second target will be 105.60 level.
If you pay attention to the whole trend of this chart you will get to know that there is the extreme fall in trend from the point which shown by the blue arrow which indicates the overbought and volume spike. and you can see, every time when the tail crosses dynamic resistance, trend decreases. and every time when the candle touches a support trendline, trend moves upside.
By crossing the support trendline, It makes a major failure and it continuously decreases, and makes an excess, after that it again started to move upwards.

USDJPY | PERSPECTIVE FOR THE WEEKWith 50pips against us since my last publication (see link below for reference purposes); It now appears that the Breakdown of 105.700 was nothing but a false one! As the pair recovers from the dual blow of Shinzo Abe's resignation and Federal Reserve's dovish policy shift; The US dollar rallied during the course of last week to slam into my Key level @ ¥106.50 level - a sensitive level to look out for in the following week as price action around this level will be dependent on PM Abe's replacement and US inflation figures.
Tendency: Uptrend ( Bullish )
Structure: Trendline | Breakout| Support & Resistance | Supply & Demand
Observation: i. 106.500 has been a significant level for me since Breakdown in July 2020 as we continue to see the rejection of this zone despite Breakouts on two occasions in August 2020.
ii. We are at this level again after the close of market last week with a possible Breakout looming at the corner.
iii. Previous Breakout/Rejection of my Key level is a signal that Buyers are insisting on breaking this level as participants make Higher Lows off of Bullish Trendline.
iv. Breakout/Retest of Key is a signal to watch out for in the coming week(s).
iv. It is pertinent that I state here how important the Demand zone is at this juncture as we might have a correction into this level before the incitation of rally. However, a significant Breakdown of Demand zone might render this setup invalid.
Trading plan: BUY confirmation with a minimum potential profit of 200 pips.
Risk/Reward: 1:4
Potential Duration: 2 to 5 days
NB: This speculation can be considered to make decisions on lower timeframes.
Watch this space for updates as price action is been monitored.
NirvanaForex
Risk Disclaimer:
Margin trading in the foreign exchange market (including foreign exchange trading, CFDs, etc.) has a high risk and is not suitable for all investors. The content of this speculation (including all data) is organized and published by me for the sole purpose of education and assistance in making independent investment decisions. All information herein is for your reference only and I take no responsibility.
You are hereby advised to carefully consider your investment experience, financial situation, investment objective, risk tolerance level, and consult your independent financial adviser as to the suitability of your situation prior to making any investment.
I do not guarantee its accuracy and is not liable for any loss or damage which may result directly or indirectly from such content or the receipt of any instruction or notification therewith.
Past performance is not necessarily indicative of future results.

USDJPY | MY PERSPECTIVE FOR THE WEEKWith over 100pips in our direction since my last publication (see link below for reference purposes); we continue to experience an appreciation in favor of the Yen as the Greenback resumes her decline late into the Asian session of Friday as traders absorb the implications of the Fed's policy shift; herby extending its slide to touch its lowest level since mid-August 2020.
Tendency: Downtrend ( Bearish )
Structure: Trendline | Supply & Demand
Observation: i. Price action continues to respect Day chart Bearish Trendline since February 2020 as market closed on Friday with a significant Bearish engulfing candle.
ii. Breakdown of Support @ 105.500 coincidings with Breakdown of Bullish Trendline reveals the strength of Sellers in the market at this juncture as I anticipate a further Breakdown of structure @ 105.000.
iii. It is advisable to look out for correction in anticipation of a decline in the coming week(s).
Trading plan: SELL confirmation with a minimum potential profit of 200 pips.
Risk/Reward: 1:3
Potential Duration: 3 to 10 days
NB: This speculation can be considered to make decisions on lower timeframes.
Watch this space for updates as price action is been monitored.
NirvanaForex
Risk Disclaimer:
Margin trading in the foreign exchange market (including foreign exchange trading, CFDs, etc.) has a high risk and is not suitable for all investors. The content of this speculation (including all data) is organized and published by me for the sole purpose of education and assistance in making independent investment decisions. All information herein is for your reference only and I take no responsibility.
You are hereby advised to carefully consider your investment experience, financial situation, investment objective, risk tolerance level and consult your independent financial adviser as to the suitability of your situation prior to making any investment.
I do not guarantee its accuracy and is not liable for any loss or damage which may result directly or indirectly from such content or the receipt of any instruction or notification therewith.
Past performance is not necessarily indicative of future results.

USDJPY | MY PERSPECTIVE FOR THE WEEKWith over 120pips in our direction since my last publication (see link below for reference purposes); The Greenback made efforts to pull back against the Japanese yen for a majority of the week but got capped at 106.200 level as the Yen fights for value by pushing price back into my Key zone. The key zone has been supporting price since the beginning of the month with signs that the Bears are finding it difficult to break through this level which suggests a more flexible trading approach in the coming week.
Tendency: Downtrend ( Bearish )
Structure: Trendline | Reversal Structure (H & S) | Supply & Demand
Observation: i. With line drawn over pivot highs since begining of July 2020, the emphasis on Bearish tendencies keep increasing.
ii. H & S: A pattern formation at the peak of a Correction move at the beginning of the month (Aug. 2020) appears as a baseline with three peaks (outside two close in height and the middle is highest).
iii. A further Breakdown of my Key zone in the following week(s) might be my signal for decline continuation.
iv. It is worth noting that my Key level as served as a major demand zone since the beginning of the month which signals that it still has the Buyers' strength.
iv. In as much as I am joining the Bears this week, fluidity is very key as a Bullish engulfing candle from my Key zone my render this set-up invalid with a possible rally in the air!
Trading plan: SELL confirmation with a minimum potential profit of 250 pips.
Risk/Reward: 1:4
Potential Duration: 2 to 7 days
NB: This speculation can be considered to make decisions on lower timeframes.
Watch this space for updates as price action is been monitored.
NirvanaForex
Risk Disclaimer:
Margin trading in the foreign exchange market (including foreign exchange trading, CFDs, etc.) has a high risk and is not suitable for all investors. The content of this speculation (including all data) is organized and published by me for the sole purpose of education and assistance in making independent investment decisions. All information herein is for your reference only and I take no responsibility.
You are hereby advised to carefully consider your investment experience, financial situation, investment objective, risk tolerance level and consult your independent financial adviser as to the suitability of your situation prior to making any investment.
I do not guarantee its accuracy and is not liable for any loss or damage which may result directly or indirectly from such content or the receipt of any instruction or notification therewith.
Past performance is not necessarily indicative of future results.

USDJPY | MY PERSPECTIVE FOR THE WEEKWith 30pips against our direction since my last publication (see link below for reference purposes) on this pair, the price has found its way to complete a 127.2 extension to incite a reversal structure. It is worthy to note that the Japanese and US statistics headed in opposite directions this week to make the USD/JPY the only major pair to witness the Greenback appreciate last week.
Tendency: Downtrend ( Bearish )
Structure: Harmonic (AB = CD) | Supply & Demand
Observation: i. The Bullish run since the beginning of the month appears to be stalling at my Supply zone as those who took advantage of the run are doing quick sells.
ii. Confirmation of a Harmonic move (AB = CD) might be a result of a rejection of my Key Level @ 106.500 for a decline.
iii. ABCD expectations;
a. Impulse A-to-B expected to be in harmony with the potential C-to-D leg.
b. The B- to-C leg is at 50.0% Fibonacci retracement of the A-to-B leg.
c. The C-to-D leg is expected to fall within 127.2 - 1.414% Fib. ext. of the A-to-B move.
Trading plan: SELL confirmation with a minimum potential profit of 300 pips.
Risk/Reward: 1:4
Potential Duration: 2 to 7 days
NB: This speculation can be considered to make decisions on lower timeframes.
Watch this space for updates as price action is been monitored.
NirvanaForex
Risk Disclaimer:
Margin trading in the foreign exchange market (including foreign exchange trading, CFDs, etc.) has a high risk and is not suitable for all investors. The content of this speculation (including all data) is organized and published by me for the sole purpose of education and assistance in making independent investment decisions. All information herein is for your reference only and I take no responsibility.
You are hereby advised to carefully consider your investment experience, financial situation, investment objective, risk tolerance level and consult your independent financial adviser as to the suitability of your situation prior to making any investment.
I do not guarantee its accuracy and is not liable for any loss or damage which may result directly or indirectly from such content or the receipt of any instruction or notification therewith.
Past performance is not necessarily indicative of future results.

USDJPY | PERSPECTIVE FOR THE WEEKAfter waiting all week, the US payrolls delivered numbers good enough to rally the Greenback back to its recent high but not strong enough to cushion the negative COVID inspired dent on the US economy. After moving over 200pips in our direction since my last publication on this pair (see link below for reference purposes), price did a correction to form what looks like a Double Top at my Supply zone in anticipation of what looks like a decline in the following week(s).
Tendency: Downtrend (Bearish)
Structure: Supply & Demand | Retracements
Observation: i. Retracement of Impulse Leg culminates at Supply zone with a structure similar to a Double Top after a Bullish run on Friday.
ii. The expectation of a Harmonic move (AB = CD pattern) will be high after completion of retracement is confirmed.
Trading plan: SELL confirmation with a minimum potential profit of 250 pips.
Risk/Reward: 1:5
Potential Duration: 4 to 10 days
NB: This speculation can be considered to make decisions on lower timeframes.
Watch this space for updates as price action is been monitored.
NirvanaForex
Risk Disclaimer:
Margin trading in the foreign exchange market (including foreign exchange trading, CFDs, etc.) has a high risk and is not suitable for all investors. The content of this speculation (including all data) is organized and published by me for the sole purpose of education and assistance in making independent investment decisions. All information herein is for your reference only and I take no responsibility.
You are hereby advised to carefully consider your investment experience, financial situation, investment objective, risk tolerance level and consult your independent financial adviser as to the suitability of your situation prior to making any investment.
I do not guarantee its accuracy and is not liable for any loss or damage which may result directly or indirectly from such content or the receipt of any instruction or notification therewith.
Past performance is not necessarily indicative of future results.

USD/JPY Intraday: Hurdle at 105.20Long positions above control price with targets at 106.60-107.20-107.75 in extension.
Hurdle: 105.20
Don't buy below the hurdle line.

USDJPY Sell SignalPattern: Channel Down since 2017.
Signal: Sell as the price broke below the Channel's pivot (dashed line).
Target: 102.000 (just above the Support line and the inner (blue) Lower Low trend-line).
** Please support this idea with your likes and comments, it is the best way to keep it relevant and support me. **

USDJPY | WEEKLY PERSPECTIVEThe Greenback began a downward spiral at the beginning of last week as it came under strong Bearish pressure with the souring market sentiment to Breakdown my Key level @ 106.500 later in the week. With over 125pips in our direction since my last publication on this pair (see link below for reference purposes); the scope of the USDJPY pair to extend the decline becomes more pronounced.
Tendency: Downtrend ( Bearish )
Structure: Breakdown | Support & Resistance | Supply & Demand
Observation: i. Price action fell into an indecision pattern since early June 2020 to finally Breakdown of the Channel late last week.
ii. Breakdown off of 106.500 signals an extension in the decline of the USD as I anticipate a correction into this level for rally continuation.
iii. A Breakdown coinciding with Bearish Trendline @ 106.000 further confirms my bias.
Trading plan: SELL confirmation with a minimum potential profit of 160 pips.
Risk/Reward: 1:3
Potential Duration: 4 to 10 days
NB: This speculation can be considered to make decisions on lower timeframes.
Watch this space for updates as price action is been monitored.
NirvanaForex
Risk Disclaimer:
Margin trading in the foreign exchange market (including foreign exchange trading, CFDs, etc.) has a high risk and is not suitable for all investors. The content of this speculation (including all data) is organized and published by me for the sole purpose of education and assistance in making independent investment decisions. All information herein is for your reference only and I take no responsibility.
You are hereby advised to carefully consider your investment experience, financial situation, investment objective, risk tolerance level and consult your independent financial adviser as to the suitability of your situation prior to making any investment.
I do not guarantee its accuracy and is not liable for any loss or damage which may result directly or indirectly from such content or the receipt of any instruction or notification therewith.
Past performance is not necessarily indicative of future results.

USDJPY | WEEKLY PERSPECTIVEIt was all Bears for the US Dollar especially during the latter part of last week as it continues to lose value against multiple currencies and the Yen was not left out in the gains! Breakdown of my Key level @ 107.300 last week evolved into a structure similar to AB = CD pattern with an expectation of correcting into 107.300 in anticipation of a down rally in the following week(s) seems feasible.
Tendency: Downtrend ( Bearish )
Structure: Breakout | Harmonic (AB = CD)| Support & Resistance
Observation: i. The fall of the USD since the beginning of last month (June 2020) appears to continue as it Breaks down my Key level once again.
ii. ABCD pattern
a. Impulse A-to-B in harmony with the potential B-to-C leg.
b. The B- to-C leg is at 61.8% Fibonacci retracement of the A-to-B leg.
c. The C-to-D leg falls at 1.414% Fib. ext. of the A-to-B move.
iii. Expecting a possible correction into my Key level zone before downtrend continuation in the following week(s).
Trading plan: SELL confirmation with a minimum potential profit of 250 pips.
Risk/Reward: 1:3
Potential Duration: 2 to 8 days
NB: This speculation can be considered to make decisions on lower timeframes.
Watch this space for updates as price action is been monitored.
NirvanaForex
Risk Disclaimer:
Margin trading in the foreign exchange market (including foreign exchange trading, CFDs, etc.) has a high risk and is not suitable for all investors. The content of this speculation (including all data) is organized and published by me for the sole purpose of education and assistance in making independent investment decisions. All information herein is for your reference only and I take no responsibility.
You are hereby advised to carefully consider your investment experience, financial situation, investment objective, risk tolerance level and consult your independent financial adviser as to the suitability of your situation prior to making any investment.
I do not guarantee its accuracy and is not liable for any loss or damage which may result directly or indirectly from such content or the receipt of any instruction or notification therewith.
Past performance is not necessarily indicative of future results.
