USDMXN

USDMXN: Happy Easter! Hey everyone first i want to wish everyone and their family a great easter weekend!
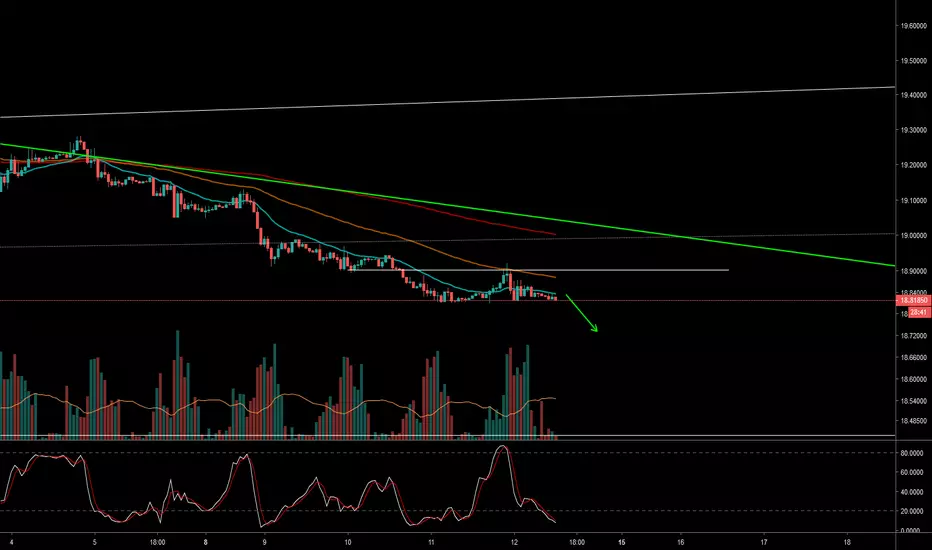
We are looking at the USDMXN pair a second time after we were anticipating a great short from the last idea. I will link it below.
We clearly see that the bearish trend line is broken and retested on the 1h timeframe. The red horizontal line is a key support level, where price did change before.
Divergence is also in play around this area.
We are looking for long in this area only and aiming for the last highs at least.
I will keep you guys updated and have a great trading week!

Equal lows on USDMXN asking to be taken out waiting for comfWe just tested the daily breaker and liq void got filled where USDMXN is now rejecting from.
You could short it here but i prefer some more confirmation so i would like the 4h orderblock to be broken wich will then become a breaker and i will short the retest off that breaker into the equal lows.
Those lows are just to juicy not to be taken as many people their stops our right under there. This is as nice as setups like this get imo.

USD/MXN Buying the RangeHi All ,
Opening a buy on this pair only for few pips 20-30 . Tp1 under the trendline .
Many Thanks.

COTD - 23/04 USDMXNToday we are revisiting the USDMXN Daily chart, in a previous COTD back in February we looked at the Daily price action and what was a potential shorter-term set up (take a look here.
The Shorter-term set-up didn't pan out on the back of a weaker dollar and more exotic shift on the back of this. But as the Dollar films a little bit we are going to revisit as the longer-term set up still stands.
Taking a look at the chart we can see the price is still very much contained between the two trendlines, the one we are more focused on currently is supporting bullish trendline.
As we can see currently, the price is sitting on top of this particular trend line and it looks like we finding some support here, especially as the Dollar Index ticks higher.
Something else of note is the Analyst forecasts for the USDMXN rate throughout 2019. With on average, Analysts forecasting the USDMXN to end the second quarter of 2019 at $19.24 and then on to $19.47 at the end of the third quarter.
FX:USDMXN

USDMXN Back at the powerfull supportWe are back at the support, as a trader I trade in low risk to high reward so for me this is a buy situation.
If it fails to break the support and go up -> WIN
If it breaks support and goes down -> SMALL LOSS
My green zone is a bit higher because of the spread, if you wanna enter a trade wait for it to be ~300.
Cheers everyone have a nice easter!


MXN weakness coming (USDMNX and EURMXN buy)In this speicfic chart, EURMXN has a perfect buy reversal setup with a contraction and 3 Lower Lows within the contraction. This is 1 of the 3 patterns we trade in the PipsMatter community

USDMXN BUYnew Strat being used, but break of downtrend restest and it should go up lets see how it plays


USD/MXN (Bullishness shall come in Soon)Updated View On USD/MXN (16 Apr 2019)
Back Ground: Hola. We are seeing a potential further Bullishness on this pair USD/MXN as MXN shall soon start to weaken. It is lil too early to tell so.
I see the level such as 18.4 is a potential swing entry.
Target(s): UP 19.1 (TP1), 19.3 (TP2)
SHTF: 18 will be a good support region.
DYODD, Our trade analysis may not suitable to intraday (or) short time frame trading.
Whatever method you use if you do not follow the proper rule of risk management, it will have detrimental effects on your account.
Feel Free to "Follow", press "LIKE" "Comment".
Legal Risk Disclosure:
Trading foreign exchange or CFD on margin carries a high level of risk, and may not be suitable for all investors.
The high degree of leverage can work against you as well as for you. Before deciding to trade foreign exchange you should carefully consider your investment objectives, level of experience and risk appetite.
The possibility exists that you could sustain a loss of some or all of your initial investment and therefore you should not invest money that you cannot afford to lose.
You should be aware of all the risks associated with foreign exchange trading, and seek advice from an independent financial advisor.
DISCLAIMER:
Any opinions, news, research, analyses, prices or other information discussed in this presentation or linked to from this presentation are provided as general market commentary and do not constitute investment advice.
Sonicr Mastery Team does not accept liability for any loss or damage, including without limitation to, any loss of profit, which may arise directly or indirectly from use of or reliance on such information.

USDMXN possible buy opportunityIt seems to me like a common HSH formation with retesting. Possible buy zone is support line.

USD/MXN Looking to go longUSDMXN looks to have a few good opportunities to break small trends and stretch up-ward. If it fails to do so then I believe it will hit a lower low and changing short-term trends
This is not financial advice, or lettuce.

USD/MXN BUY Hi All,
Opening a buy on this pair . Target 30-60pips. Buying the range .
SL to entry as always .
Many Thanks.

MEXICAN PESO BR0KE SUPPORT AT 18.80BROKE SUPPORT AT 18.80, WAITING FOR RETEST AT SUCH SUPPORT THEN SHOULD BE LAUNCHING DOWN TO THE NEXT RESISTANCE AROUND 18.55

USD-MXNObservaciones:
patron de cambio de estructura en tendencia bajista
presentando divergencia en los 2 ultimos (LL)
apoyado de punto de pivote daily

USDMXN (PESO) 04.14.19 Wait for the market to come to you. Don't play yourself, play the game. Let the banks show you the real direction.

USDMXN INTRADAY - Bearish ContinuationPrice action calls for bearish continuation towards support.
Bearish intraday bias.
USDMXN leads USD devaluationI like to plot USDXXX and XXXUSD against DXY or Equally Weighted USD Indices like the EWI I prefer because then you can tell if the USD is devaluing faster than the other currency of the named pair, in this case MXN.
First thing I notice is the strong correlation. Even though quoted in USD a pair does not have to correlate that strong if the other currency is volatile as well.
I have added a correlation coefficient (cc) indicator below the chart. Above zero means positive correlation. You can also tell from the cc indicator that USDMXN and DXY correlate positive most of the time, also called strong positive correlation.
There is even some divergence between the two charts, as indicated by the disjointed angle drawing.
Concluding that it is expected USDMXN to drop more than DXY, which I have indicated with the darker red arrow.
General disclaimer applies....

USDMXN Reversal Trading a contraction leading to a double bottom.
DXY showing a reversal of the USD, which means that it will gain. Easy pips!

USD/MXN LONG SWING TRADE 600+ PIPS POTENTIALIf USDMXN to bounces off of either of the trendline we could be looking at 600-2000 pips on this trade. However, we must wait for confirmations to be met before going in. I need the 2hr Downtrend to be broken + a 4hr/Daily reversal to form before going long.

USD MXN BUY (US DOLLAR - MEXICAN PESO)Hi there. Price is forming a continuation pattern to the upside. Watch strong price action at the current price for buy.

USDMXN: Is There Someone Who Knows The Value ?Hey everyone!
I hope it was a great sunny weekend for everyone of you guys. Here in Germany it was beautiful, like this setup we are looking at. Found it during my weekend trading routine. USDMXN looks super clean from now as there was bullish momentum during the last week. Forming a peak high formation now with a divergence on the RSI could indicate another bearish momentum as before. The 0.786 fibonacci level, which is not that strong by the way, was also not broken strong. This will be the first trade of next week i think. Sad It is so exotic, because i do not even know how to count the pip value of this pair haha. If you know please let me know in the comment section. See you guys next time hopefully with another video analysis from my side!
