USDMXN


USDMXN Analysis Potential Short & Long PositionGood Evening Traders, #ForexFargo checking in!
Today our analysis is on USDMXN.
Please bare with me as I have never looked at this pair and this is my first analysis.
The overall trend is Bullish indicating strong momentum.
Price has rallied from Monthly Support Level @ 19.0000 to our Market Structure Level @ 19.35000. 350 Pips!
Weekly Resistance Level is set @ 19.50000.
Weekly Support Level is set @ 19.10000.
Please refer to chart for detailed descriptions on Short & Long Positions.
Happy Trading as always!


Yearly lows set in place for USDMXNHere we can look from a bird's eye view and see that this is likely still a large triangle taking place.
We are testing the minimum targets of a 5 wave sequence from November highs. It is very possible that this can start forming a base at current levels since the target has been reached however extensions below come in at 18.53.
The likelihood of a base forming will increase if we trade above resistance at 19.20, this will give confidence and unlock 19.47 and 20.4 for initial targets in the triangle.
A very interesting cross to track over the coming Months and Quarters. Best of luck all trading it live.

USDMXN shortWill previous resistance become support ? or are we gonna see 61 lvl becoming a resistance ? Or will it go even further up ?
Posting this only to follow my ideas, I'm currently not trading.
GL

USDMXN 1:3 Risk Reward ShortUSD Short bias
- quant score = -3 (-10 shift)
MXN Long Bias
- quant score = +39 (+22 shift)
TA
- Short momentum, low breaks


USD/MXN Buy Hi All ,
I'm Adding to my buy position on this pair .
After the H&S move , we can see prices have formed a bullish momentum & friday close was a bullish candle , I expect more move this week . SL to Entry as always.
Many Thanks.

Fundies Show Weakness, Technicals Show OversoldTo be brief, Mexican growth is slowing with prospects for the G20 economy to slow further. Technicals oscillators shown below indicate a buy as well. This buy is a bit crowded however, so I wouldn't be surprised if the contrarian sell comes in strong. But I lean long.
If you like my analysis, please feel free to check out my other work at www.anthonylaurence.wordpress.com


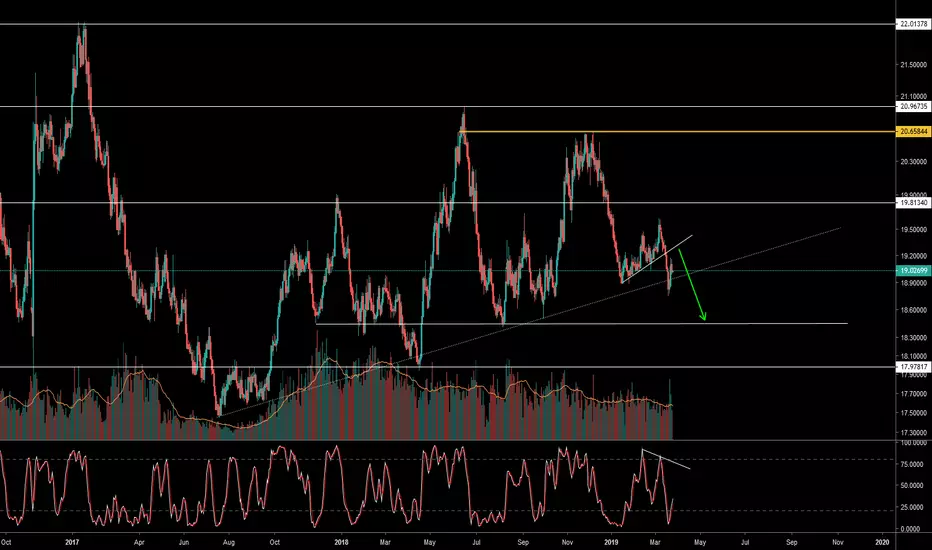
USDMXN Bullish pressure to continueAfter a pullback the potential continuation of a bullish cycle developing with the hidden divergence confirmed the next levels are 19.60 and 19.80

USDMXN: Long term Buy opportunity.The dominant long term pattern on USDMXN is a Triangle on 1M (total neutrality with RSI = 52.546, ADX = 27.968, Highs/Lows = 0.0000). 1D is on a Higher Lows sequence, which this 1M Triangle has show that it leads to a bullish break out. We are long with TP = 20.25000.
** If you like our free content follow our profile (www.tradingview.com) to get more daily ideas. **
Comments and likes are greatly appreciated.
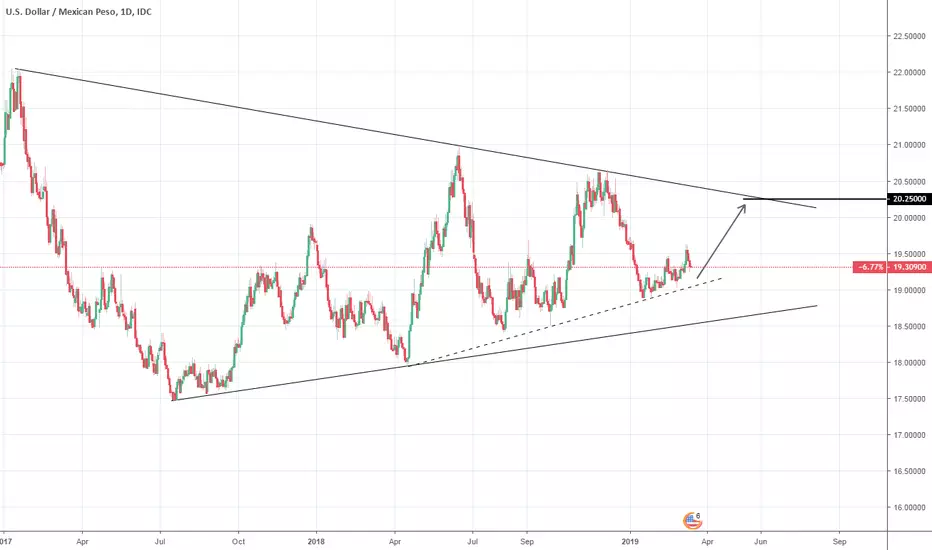

USDMXN Buy signalPattern: 1W Triangle.
Signal: Bullish based on a similar fractal sequence of the Higher Low line.
Target: 20.3500 (Triangle's Lower High at -1.42%).

USD MXN SELL (US DOLLAR - MEXICAN PESO)Hi there. Price is forming a continuation pattern to the downside. Watch strong price action at the current price for sell.


USD/MXN LongPrice broke our trendline made a little retest if we look at lower timeframes so im seeing price reaching our next level around 19.45

USD MXN longMMHVW from looking at the Macd this pair looking bullish at this level. Normal check the 4hr, 1d and 1week Macd for correlation between tf’s before entering the trade.

USDMXN ShortBearish Pennant Pattern spotted on USDMXN. Signaling the continuation of decent for the Pair

USDMXN breaks SHS neckline, 2000+ pips targetThe support around 19.20 failed to stop the downward pressure in USDMXN, with the pair breaking below the neckline of an SHS pattern.
The pattern suggests a target at around 18.94, but I would prefer to follow a more conservative approach and aim at 19.00 instead, which also aligns with a rising trendline support.
