XAU/USD (Gold) - Triangle Breakout (1.08.2025)The XAU/USD Pair on the M30 timeframe presents a Potential Selling Opportunity due to a recent Formation of a Triangle Breakout Pattern. This suggests a shift in momentum towards the downside in the coming hours.
Possible Short Trade:
Entry: Consider Entering A Short Position around Trendline Of The Pattern.
Target Levels:
1st Support – 3249
2nd Support – 3225
🎁 Please hit the like button and
🎁 Leave a comment to support for My Post !
Your likes and comments are incredibly motivating and will encourage me to share more analysis with you.
Best Regards, KABHI_TA_TRADING
Thank you.
Disclosure: I am part of Trade Nation's Influencer program and receive a monthly fee for using their TradingView charts in my analysis.
DJ FXCM Index

NFP Volatility Ahead – Is the Dollar Ready to Break Higher?🟢 DXY Outlook – A Key Day for the Dollar Index
Yesterday’s monthly candle closed with strong bullish momentum, marking a powerful start to August. Today, on the first trading day of the month, we’re expecting three major U.S. economic releases:
NFP, Average Hourly Earnings (m/m), and the Unemployment Rate.
As discussed in last week’s outlook, DXY has successfully broken above the key 100 level and confirmed a monthly close above it — a significant technical development. With no major order blocks or visible resistance in the way, the path toward the 102 target appears technically clear.
That said, I anticipate mixed data from today’s releases — which means we could see both sides of liquidity being taken during the initial reaction. Price might dip toward lower zones temporarily to collect liquidity before resuming its bullish move toward 102.
📌 In summary:
From a swing perspective, I believe the direction remains bullish for the Dollar Index as long as we hold above the 100 level.
When I say the data might be “mixed,” I mean the market could show an initial drop toward lower zones at the time of release — not because of a reversal, but to grab liquidity before continuing higher toward the 102 target.
Unless we see something unexpectedly extreme in the numbers, I expect the DXY to remain on track to reach the 102 level in the coming days or next week.
🔁 This analysis will be updated whenever necessary.
Disclaimer: This is not financial advice. Just my personal opinion.
Dollar Index (DXY): Will It Rise More?!
Dollar Index is on its way to 100.4 resistance.
A breakout of a major supply cluster on a daily after FED meeting
yesterday indicates a strong bullish pressure.
I think that growth will continue soon.
❤️Please, support my work with like, thank you!❤️

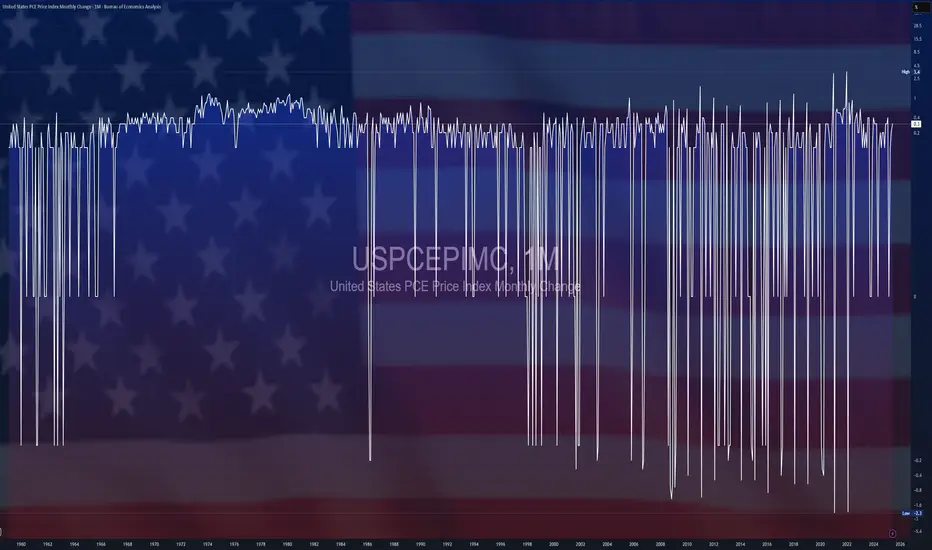
$USPCEPIMC -U.S PCE Prices Rise (June/2025)ECONOMICS:USPCEPIMC
June/2025
source: U.S. Bureau of Economic Analysis
- The US PCE price index rose by 0.3% mom in June, the largest increase in four months, and in line with expectations, led by prices for goods.
The core PCE index also went up 0.3%, aligning with forecasts.
However, both the headline and core annual inflation rates topped forecasts, reaching 2.6% and 2.8%, respectively.
Meanwhile, both personal income and spending edged up 0.3%.
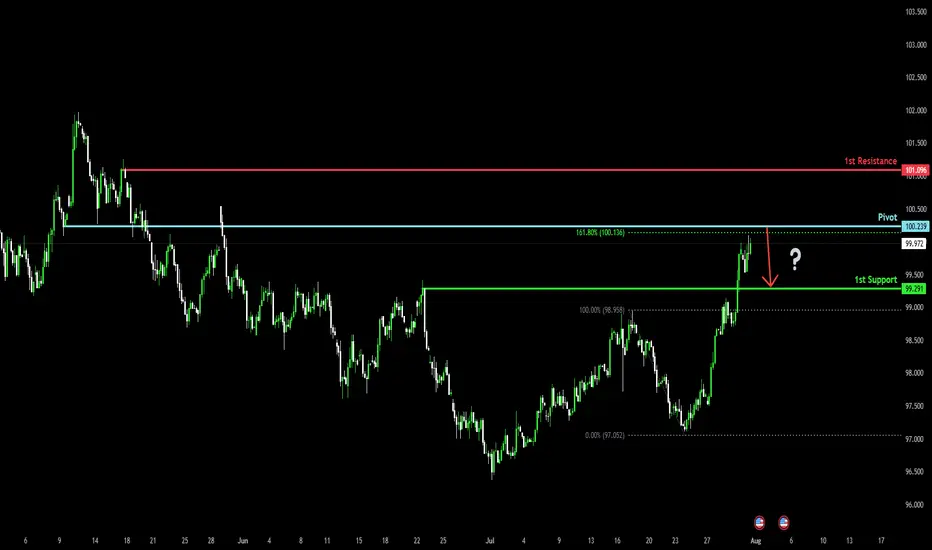
Bearish reversal off overlap resistance?The US Dollar Index (DXY) is rising towards the pivot and could reverse to the 1st support.
Pivot: 100.23
1st Support: 99.29
1st Resistance: 101.09
Risk Warning:
Trading Forex and CFDs carries a high level of risk to your capital and you should only trade with money you can afford to lose. Trading Forex and CFDs may not be suitable for all investors, so please ensure that you fully understand the risks involved and seek independent advice if necessary.
Disclaimer:
The above opinions given constitute general market commentary, and do not constitute the opinion or advice of IC Markets or any form of personal or investment advice.
Any opinions, news, research, analyses, prices, other information, or links to third-party sites contained on this website are provided on an "as-is" basis, are intended only to be informative, is not an advice nor a recommendation, nor research, or a record of our trading prices, or an offer of, or solicitation for a transaction in any financial instrument and thus should not be treated as such. The information provided does not involve any specific investment objectives, financial situation and needs of any specific person who may receive it. Please be aware, that past performance is not a reliable indicator of future performance and/or results. Past Performance or Forward-looking scenarios based upon the reasonable beliefs of the third-party provider are not a guarantee of future performance. Actual results may differ materially from those anticipated in forward-looking or past performance statements. IC Markets makes no representation or warranty and assumes no liability as to the accuracy or completeness of the information provided, nor any loss arising from any investment based on a recommendation, forecast or any information supplied by any third-party.
USDJPY: The Fed & BOJ Likely To Keep Rates In Place. Buy It!Welcome back to the Weekly Forex Forecast for the week of July 28 - Aug 1st.
In this video, we will analyze the following FX market:
USDJPY
The FED and BOJ are expected to keep their perspective interest rates, come Wednesday. The USD is stabilizing, a US-Japanese tariff deal inked, and investors are slowing moving money from the Yen safe haven to riskier assets.
Look for USDJPY to slowly move higher.
Enjoy!
May profits be upon you.
Leave any questions or comments in the comment section.
I appreciate any feedback from my viewers!
Like and/or subscribe if you want more accurate analysis.
Thank you so much!
Disclaimer:
I do not provide personal investment advice and I am not a qualified licensed investment advisor.
All information found here, including any ideas, opinions, views, predictions, forecasts, commentaries, suggestions, expressed or implied herein, are for informational, entertainment or educational purposes only and should not be construed as personal investment advice. While the information provided is believed to be accurate, it may include errors or inaccuracies.
I will not and cannot be held liable for any actions you take as a result of anything you read here.
Conduct your own due diligence, or consult a licensed financial advisor or broker before making any and all investment decisions. Any investments, trades, speculations, or decisions made on the basis of any information found on this channel, expressed or implied herein, are committed at your own risk, financial or otherwise.

DXY Just Broke Resistance – Is This the Start of a Dollar Rally?As per our analysis, DXY has successfully broken above the primary and secondary resistance line.
If the price manages to close above the marked resistance zone, we could see further upside momentum ahead.

DXY USDOLLAR CRASH Incoming!Long-term fundamentals are bearish
Long-term sentiment = bearish
Long-term technicals = bearish
Trump wants a weaker dollar + FED injecting endless amounts of cash into the markets
driving stocks/ gold up, and the dollar down, losing purchasing power.
My plan is to look for shorts on the 1hr-4hr timeframe with lower timeframe confirmation.
Once price starts turning over, day-traders can join in.
Agree or disagree?

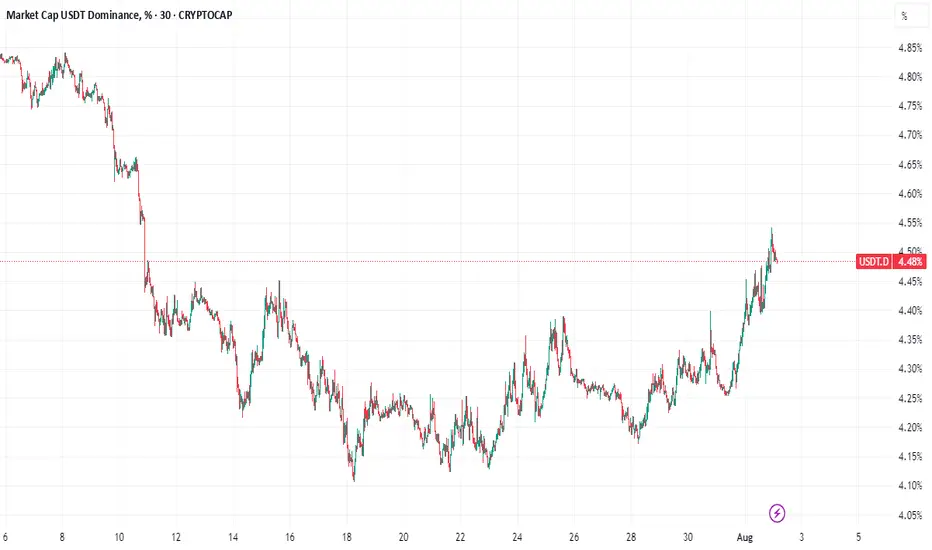
Tether Rakes in $4.9B Q2 Profit, Cementing Its Reign as Crypto’sTether Q2 Net Profit Hits $4.9 Billion, Pushing Total Earnings to $5.7 Billion: What It Means for the Crypto Industry
Tether Holdings Ltd., the issuer of the world’s largest stablecoin USDT, has once again made headlines with its Q2 2025 earnings report, revealing a staggering net profit of $4.96 billion. This brings the company’s total profits for the first half of the year to $5.7 billion—a record-breaking milestone for both the company and the broader stablecoin ecosystem.
This article explores the implications of Tether’s Q2 performance, the sources of its revenue, its impact on the crypto markets, and the growing significance of stablecoins in the evolving financial landscape.
________________________________________
A Record-Setting Quarter for Tether
Tether’s Q2 2025 results have astonished even seasoned analysts. The company’s reported $4.96 billion in net profit in a single quarter represents one of the most profitable periods in the history of any fintech or crypto-native company. What’s even more remarkable is that this profit was not driven by speculative trading or token sales, but by conservative, yield-generating strategies rooted in traditional finance.
The company’s Q1 earnings were already impressive at $0.76 billion, but Q2’s results eclipse those numbers entirely. Tether’s cumulative profit year-to-date now stands at $5.72 billion, putting it on track to potentially exceed $10 billion in earnings for the full year if current trends continue.
________________________________________
What’s Driving Tether’s Massive Profit?
Tether’s incredible profitability is primarily fueled by one key factor: the interest earned on its reserves. As the issuer of USDT, Tether is responsible for maintaining a 1:1 backing of every token in circulation. These reserves are primarily held in short-term U.S. Treasury Bills (T-Bills), reverse repos, and cash equivalents.
Here’s a breakdown of the main profit drivers:
1. High Interest Rates on U.S. Treasuries
With the U.S. Federal Reserve maintaining elevated interest rates to combat inflation, short-term T-Bills have become highly lucrative. Tether holds tens of billions of dollars in these instruments, generating billions in annual interest income.
For example, the yield on a 3-month Treasury bill in Q2 2025 averaged around 5.2%, and Tether’s reserve base has hovered near $90 billion to $100 billion. Even a conservative allocation can earn several billion dollars in annual yield.
2. Reverse Repurchase Agreements (Reverse Repos)
Tether has also expanded its use of reverse repos, which allow it to lend cash to counterparties in exchange for securities, earning a premium on the transaction. This has contributed significantly to its earnings, especially in a high-yield environment.
3. Gold Holdings and Bitcoin Exposure
Tether has acknowledged that a small portion of its reserves includes gold and Bitcoin holdings. These assets appreciated in Q2, contributing to the overall profit. While not the primary revenue source, their performance added notable value during the quarter.
4. Equity Investments
The company has begun investing in infrastructure and technology firms related to blockchain and AI. While these investments are not liquid, mark-to-market gains may have also contributed to the net profit figure.
________________________________________
A Closer Look at Tether’s Reserve Report
Tether’s Q2 attestation report, published alongside its earnings update, provides transparency into how its assets are allocated. Here are some highlights:
• Over 85% of reserves are held in U.S. Treasury instruments
• $5.4 billion in excess reserves—a buffer above the value of circulating USDT
• $3.3 billion in gold and Bitcoin holdings
• Minimal exposure to unsecured commercial paper or riskier debt instruments
Tether has continuously emphasized its commitment to transparency and risk management. Unlike in its early years, when it faced criticism over opaque reserve practices, the company now releases quarterly attestations audited by third-party firms such as BDO Italia.
________________________________________
USDT’s Growing Dominance
Tether’s profits are closely tied to the growth of its flagship product: USDT, the world’s largest stablecoin by market cap. As of August 2025, USDT has a circulating supply exceeding $110 billion, giving it a dominant share of the stablecoin market.
This growth can be attributed to several factors:
1. Increased Adoption in Emerging Markets
USDT is widely used in countries with unstable fiat currencies, such as Argentina, Nigeria, and Turkey. For many users, USDT represents a dollar-denominated safe haven in environments plagued by inflation and capital controls.
2. DeFi and Cross-border Payments
USDT continues to be a core asset in decentralized finance (DeFi) protocols, serving as a stable medium of exchange and collateral. It's also a preferred tool for cross-border remittances, given its speed and low transaction costs compared to traditional banking systems.
3. Institutional Integration
Major crypto exchanges, custodians, and payment processors have incorporated USDT into their platforms, driving further liquidity and utility. In many cases, USDT is preferred over fiat due to its 24/7 availability and blockchain-native nature.
________________________________________
What Does This Mean for the Crypto Industry?
Tether’s Q2 performance is more than just a corporate milestone—it’s a bellwether moment for the crypto industry. It signifies the maturation and institutionalization of digital assets and stablecoins. Here’s what it means for the broader ecosystem:
1. Stablecoins as Profitable Financial Products
Tether’s profitability proves that stablecoins are no longer just “crypto plumbing.” They are now financial products generating billions in yield, much like money market funds. This is reshaping how investors and regulators think about stablecoins—not as speculative tools, but as interest-bearing assets backed by real-world securities.
2. Regulatory Scrutiny Will Intensify
With Tether generating profits that rival traditional banks, expect regulators to increase oversight. Stablecoins have long been in the crosshairs of the U.S. Treasury, SEC, and global central banks, and Tether’s dominant market share will likely place it under further examination.
However, Tether’s transparency efforts, including quarterly attestations and reserve disclosures, may help it navigate these regulatory waters more effectively than in the past.
3. Competition Will Escalate
Tether’s extraordinary profits will likely attract new entrants and existing competitors to the stablecoin arena. Circle’s USDC, PayPal’s PYUSD, and even central bank digital currencies (CBDCs) are all vying for market share.
Tether’s early-mover advantage, global reach, and deep liquidity make it hard to displace, but increased competition could pressure margins in the long term.
4. Decentralized Alternatives Will Seek Market Share
Decentralized stablecoins like DAI, FRAX, and USDD aim to offer alternatives to centralized issuers like Tether. While they remain relatively small, the ethos of decentralization might gain appeal, especially in regulatory-heavy environments.
Still, decentralized stablecoins have struggled to maintain pegs during market stress, giving Tether an edge in terms of trust and resilience.
________________________________________
The Road Ahead for Tether
As Tether moves into the second half of 2025, several strategic themes will define its trajectory:
Continued Profitability
If interest rates remain elevated and USDT circulation continues to grow, Tether’s annual profit could reach or exceed $10 billion—putting it in league with the most profitable fintech firms globally. This surplus could be reinvested in:
• Infrastructure expansion
• Strategic acquisitions
• Reserve diversification
• R&D for stablecoin innovation
Expansion into Emerging Markets
Tether has hinted at expanding its presence in Latin America, Africa, and Southeast Asia, where demand for dollar-denominated assets is high and banking infrastructure is limited. Expect to see more localized partnerships and on-ramp/off-ramp solutions.
Embracing Blockchain Innovation
Tether is already deployed on multiple blockchains—Ethereum, Tron, Solana, and more. The company is likely to support new Layer 1s and Layer 2s to enhance speed, reduce costs, and maintain competitiveness in the DeFi space.
There are also rumors that Tether may be exploring tokenized asset offerings and programmable money features, allowing USDT to integrate more deeply with smart contracts and enterprise use cases.
________________________________________
Criticisms and Controversies: Still Lingering?
Despite its success, Tether continues to face criticism from parts of the crypto community and regulatory world. Concerns include:
• Lack of full audits (attestations are not the same as full financial audits)
• Opaque ownership structure
• Past legal issues, including settlements with the New York Attorney General and the U.S. CFTC
However, it’s worth noting that Tether has addressed many of these concerns over the past two years. Its transparency has improved, and its operations have become more conservative and professional.
Still, its scale and impact on the crypto market mean that any misstep could have systemic consequences. Investors and regulators alike will continue to scrutinize its activities.
________________________________________
Final Thoughts: Tether’s Moment of Ascendance
Tether’s Q2 2025 net profit of $4.96 billion doesn’t just reflect a successful quarter—it marks a paradigm shift in crypto finance. What began as a controversial stablecoin project has evolved into a global financial powerhouse, rivaling traditional banks and asset managers in profitability.
More than just a win for Tether, this moment signals the growing legitimacy of stablecoins in the global financial system. It shows that crypto-native firms can not only survive but thrive in traditional financial environments, leveraging yield, transparency, and blockchain infrastructure to create sustainable business models.
As the world watches, Tether’s next chapters will likely be shaped by innovation, regulation, and global expansion. But for now, with $5.7 billion in profits in just six months, one thing is clear:
Tether is no longer just a stablecoin issuer—it’s one of the most powerful financial entities
in the digital age.
________________________________________
Disclaimer: This article is for informational purposes only. It does not constitute financial advice. Always conduct your own research before making investment decisions.
The Fed aftermath. US dollar bulls enjoy the moment.The US dollar bulls went in hard after during and after the Fed's press conference. Can the momentum stay? Let's dig in.
MARKETSCOM:DOLLARINDEX
TVC:DXY
Let us know what you think in the comments below.
Thank you.
75.2% of retail investor accounts lose money when trading CFDs with this provider. You should consider whether you understand how CFDs work and whether you can afford to take the high risk of losing your money. Past performance is not necessarily indicative of future results. The value of investments may fall as well as rise and the investor may not get back the amount initially invested. This content is not intended for nor applicable to residents of the UK. Cryptocurrency CFDs and spread bets are restricted in the UK for all retail clients.

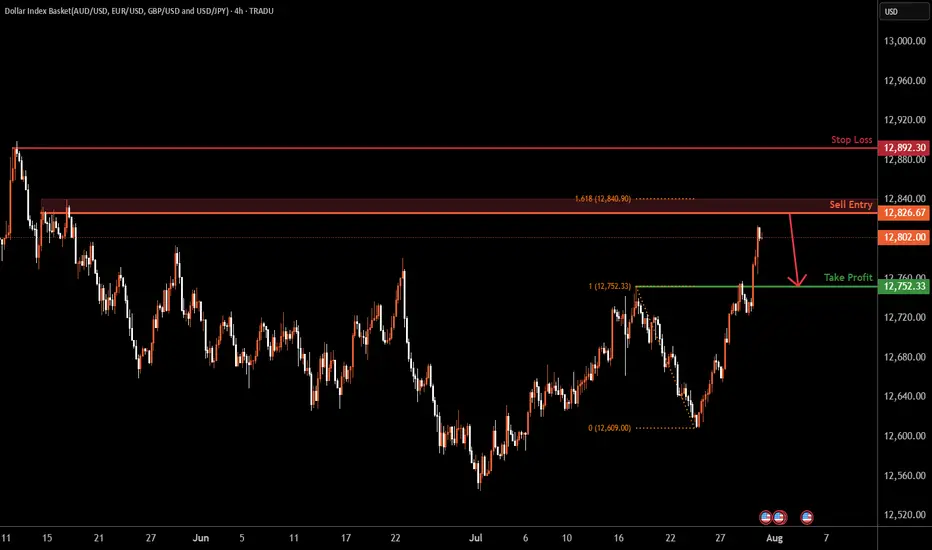
USDOLLAR H4 | Bearish reversalBased on H4 chart analysis, we can see the price rising towards the sell entry at 12,826.67, which is a swing high resistance.
Stop loss is at 12,892.30, which is a swing high resistance.
Our take profit will be at 12,752.33, which is a pullback support.
High Risk Investment Warning
Trading Forex/CFDs on margin carries a high level of risk and may not be suitable for all investors. Leverage can work against you.
Stratos Markets Limited (tradu.com ):
CFDs are complex instruments and come with a high risk of losing money rapidly due to leverage. 65% of retail investor accounts lose money when trading CFDs with this provider. You should consider whether you understand how CFDs work and whether you can afford to take the high risk of losing your money.
Stratos Europe Ltd (tradu.com ):
CFDs are complex instruments and come with a high risk of losing money rapidly due to leverage. 66% of retail investor accounts lose money when trading CFDs with this provider. You should consider whether you understand how CFDs work and whether you can afford to take the high risk of losing your money.
Stratos Global LLC (tradu.com ):
Losses can exceed deposits.
Please be advised that the information presented on TradingView is provided to Tradu (‘Company’, ‘we’) by a third-party provider (‘TFA Global Pte Ltd’). Please be reminded that you are solely responsible for the trading decisions on your account. There is a very high degree of risk involved in trading. Any information and/or content is intended entirely for research, educational and informational purposes only and does not constitute investment or consultation advice or investment strategy. The information is not tailored to the investment needs of any specific person and therefore does not involve a consideration of any of the investment objectives, financial situation or needs of any viewer that may receive it. Kindly also note that past performance is not a reliable indicator of future results. Actual results may differ materially from those anticipated in forward-looking or past performance statements. We assume no liability as to the accuracy or completeness of any of the information and/or content provided herein and the Company cannot be held responsible for any omission, mistake nor for any loss or damage including without limitation to any loss of profit which may arise from reliance on any information supplied by TFA Global Pte Ltd.
The speaker(s) is neither an employee, agent nor representative of Tradu and is therefore acting independently. The opinions given are their own, constitute general market commentary, and do not constitute the opinion or advice of Tradu or any form of personal or investment advice. Tradu neither endorses nor guarantees offerings of third-party speakers, nor is Tradu responsible for the content, veracity or opinions of third-party speakers, presenters or participants.
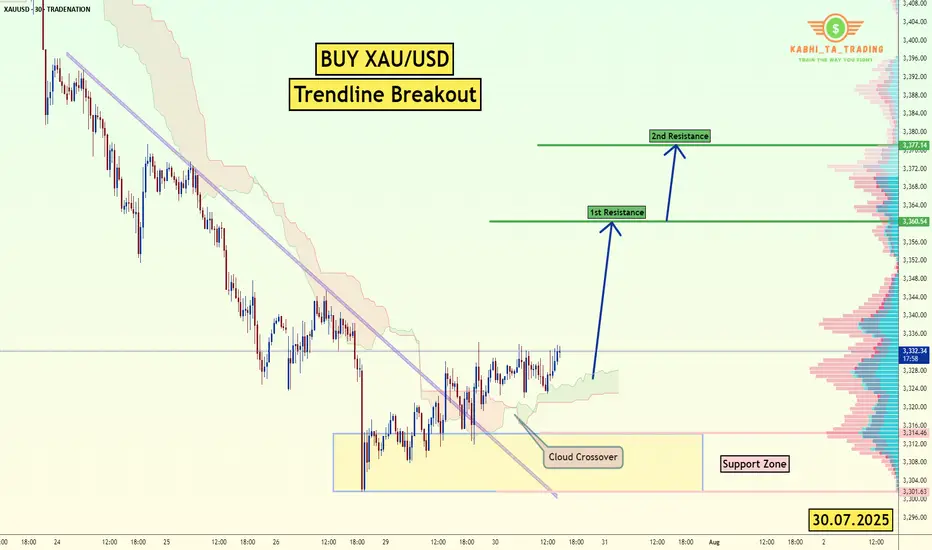
XAU/USD Trendline Breakout (30.07.2025)The XAU/USD pair on the M30 timeframe presents a Potential Buying Opportunity due to a recent Formation of a Trendline Breakout Pattern. This suggests a shift in momentum towards the upside and a higher likelihood of further advances in the coming hours.
Possible Long Trade:
Entry: Consider Entering A Long Position around Trendline Of The Pattern.
Target Levels:
1st Resistance – 3360
2nd Resistance – 3377
🎁 Please hit the like button and
🎁 Leave a comment to support for My Post !
Your likes and comments are incredibly motivating and will encourage me to share more analysis with you.
Best Regards, KABHI_TA_TRADING
Thank you.
Disclosure: I am part of Trade Nation's Influencer program and receive a monthly fee for using their TradingView charts in my analysis.
USD Dollar Index (DXY): Pushing Higher As Forecast!Welcome back to the Weekly Forex Forecast for the week of July 30 - Aug1
In this video, we will analyze the following FX market:
USD Index
In my last USD video, the forecast was for higher prices. Check the related links below to see that video forecast. It played out exactly as analyzed. The +FVG was used to push for higher prices. The FOMC decision to keep the rate unchanged only pushed it further along.
Enjoy!
May profits be upon you.
Leave any questions or comments in the comment section.
I appreciate any feedback from my viewers!
Like and/or subscribe if you want more accurate analysis.
Thank you so much!
Disclaimer:
I do not provide personal investment advice and I am not a qualified licensed investment advisor.
All information found here, including any ideas, opinions, views, predictions, forecasts, commentaries, suggestions, expressed or implied herein, are for informational, entertainment or educational purposes only and should not be construed as personal investment advice. While the information provided is believed to be accurate, it may include errors or inaccuracies.
I will not and cannot be held liable for any actions you take as a result of anything you read here.
Conduct your own due diligence, or consult a licensed financial advisor or broker before making any and all investment decisions. Any investments, trades, speculations, or decisions made on the basis of any information found on this channel, expressed or implied herein, are committed at your own risk, financial or otherwise.

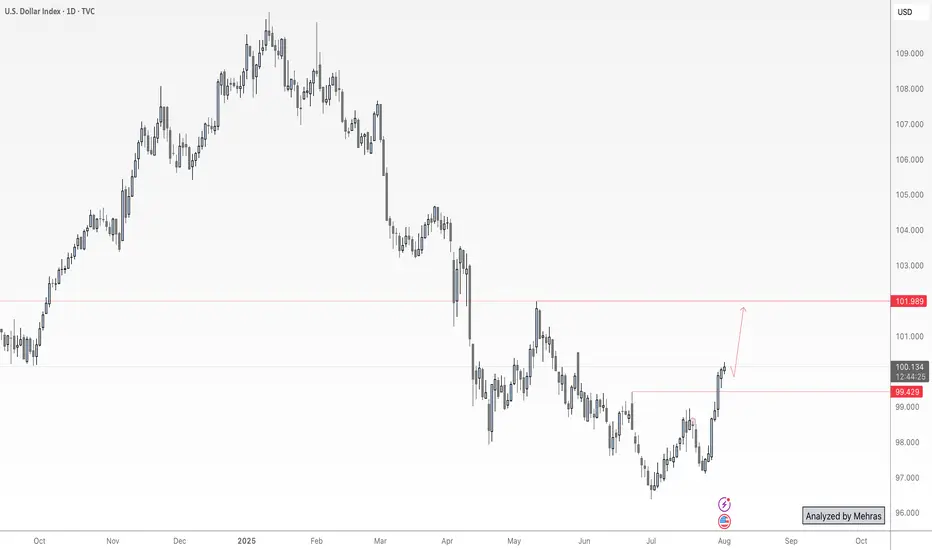
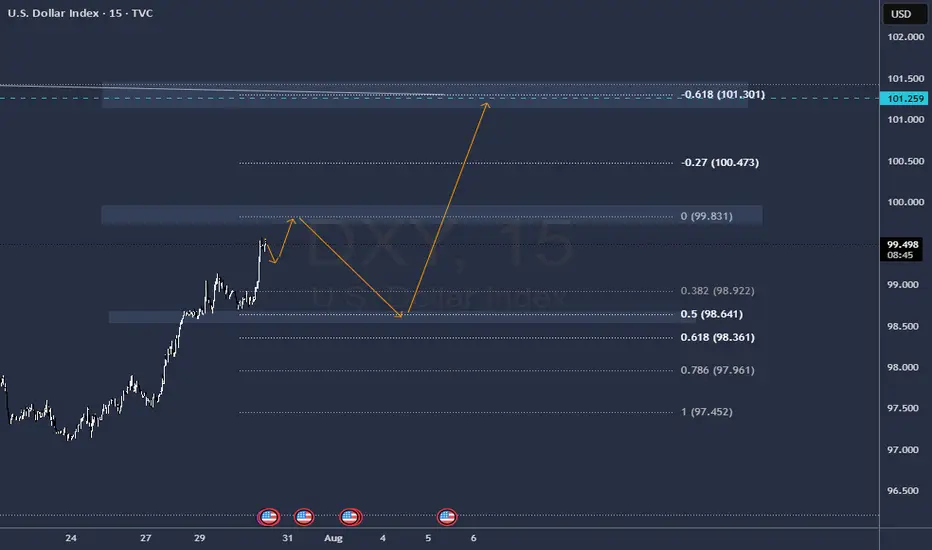
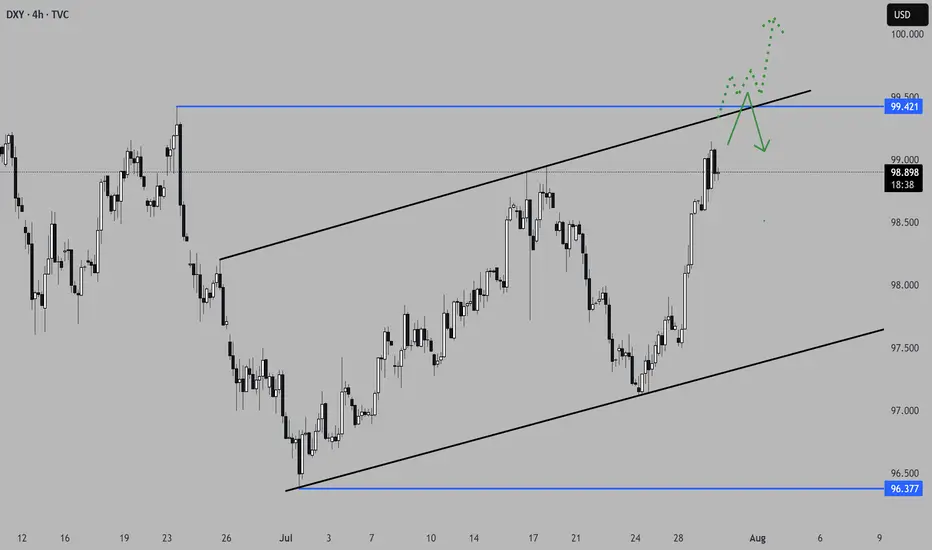
DXY Bulls Ready — Can Powell Spark the Rally?📊 DXY Pre-FOMC Outlook
In my previous analysis released on Monday, I expected the Dollar Index to fill the gap around the 98.60 zone and range below the key red line at 99.429.
Now, with less than 8 hours left until the highly anticipated FOMC rate decision, it’s time to take a closer look at tonight’s event and what it could mean for the markets.
From a purely technical perspective — setting the news aside — the Dollar Index looks ready to break through the crucial 100 level and kick off a strong bullish rally.
However, recent political pressure from Trump urging rate cuts, along with visible tension between him and Fed Chair Jerome Powell, has created uncertainty. If it weren’t for these conflicting signals, I would’ve confidently expected a clean breakout above 100.
As much as I enjoy trading news-driven events, I’ll likely stay out of the market tonight and observe from the sidelines. The setup is tempting, but the dual narratives make it risky.
That said — if you ask for my final take — I believe the stage is fully set for a bullish dollar and a corresponding drop in gold, EUR, GBP, and other major assets.
Let’s see how it plays out. 👀💥

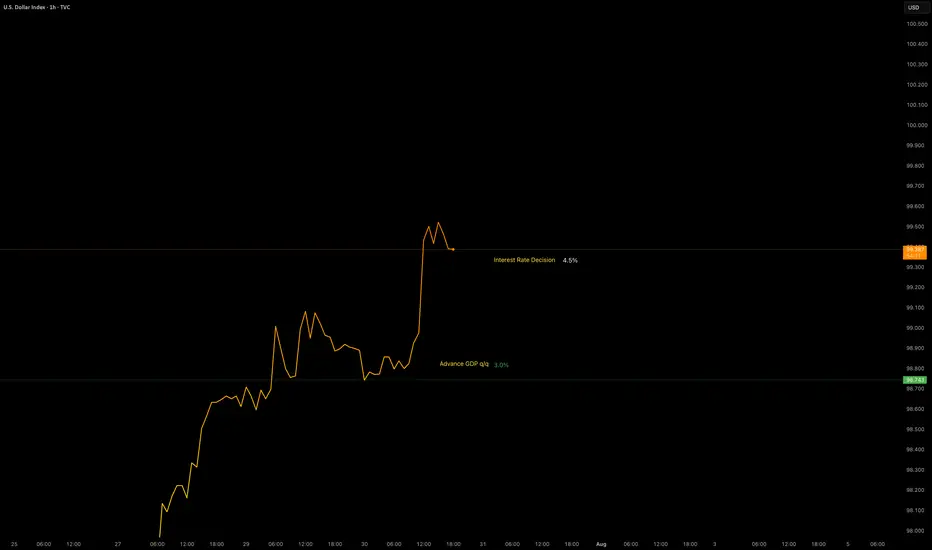
Data Release - Interest Rate DecisionJul 30 2025: Interest Rate Decision (4.5%)
Rates remain unchanged as expected.
OANDA:XAUUSD remains bearish with the help of GDP data.
TVC:DXY remains bullish with the help of GDP data. No major changes in either pairs.
Volatility is increased.
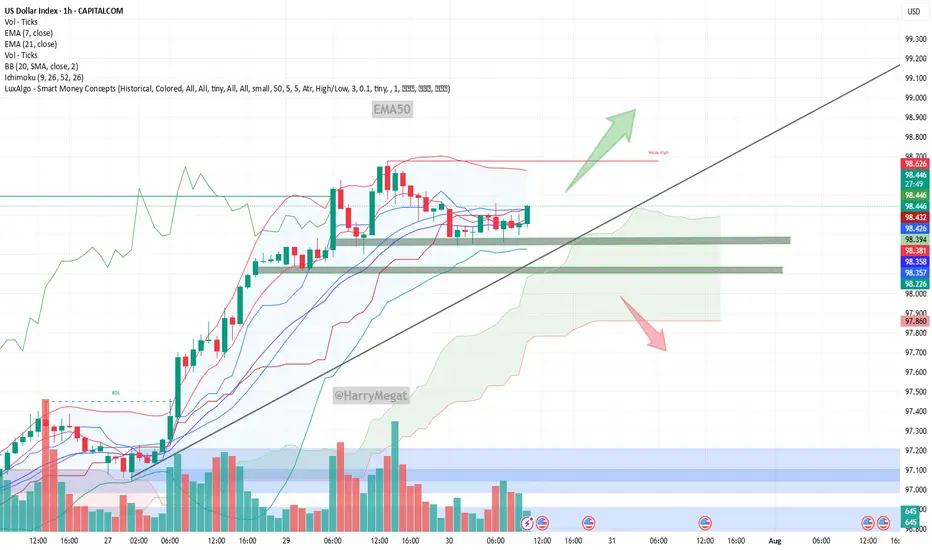
US Dollar Index (DXY) Chart Analysis – 1H TimeframeUS Dollar Index (DXY) Chart Analysis – 1H Timeframe
This chart shows the **US Dollar Index (DXY)** with key price zones, trendlines, and EMA indicators. Here's a detailed analysis:
**Key Observations:**
* **Price:** Currently trading near **98.41**
* **EMAs:**
* **EMA 7** = 98.373 (short-term trend)
* **EMA 21** = 98.356 (medium-term trend)
* **Trendline:** Uptrend line still intact, acting as dynamic support
* **Volume:** Steady, no strong breakout yet
* **Support Zones:** 98.20 – 98.35
* **Price Structure:** Consolidating above support and EMAs after a pullback from highs
**Bullish Scenario**
* If price **holds above EMAs and the green support zone (98.20–98.35)**
* **Breakout above 98.50** would confirm strength
* Targets:
→ **98.70**
→ **99.00+** if trendline support continues to hold
* EMAs are aligned bullishly (7 above 21) – good sign for continued upward trend
**Bearish Scenario**
* If price **breaks below 98.20 and closes under the trendline**
* Watch for rejection near 98.50 followed by strong red candle
* Downside targets:
→ **97.80**
→ **97.60**
* A breakdown below the ascending trendline = trend shift confirmation
**Conclusion**
* **Bias:** Bullish as long as DXY stays above 98.20 and trendline
* **Invalidation:** A break and close below 98.20 + trendline = bearish shift
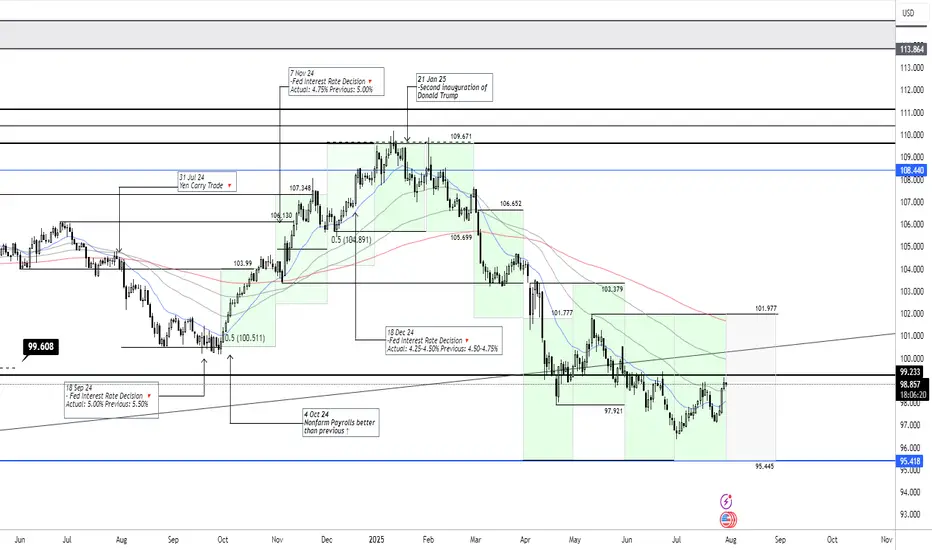
DXY July 30 2025The US dollar remains within the projected trading band, and we expect it to continue fluctuating within this range over the coming month.
Monthly Target: 95.445-101.977
Bearish reversal?The US Dollar Index (DXY) is rising towards the pivot and could reverse to the 1st support.
Pivot: 99.24
1st Support: 98.27
1st Resistance: 99.97
Risk Warning:
Trading Forex and CFDs carries a high level of risk to your capital and you should only trade with money you can afford to lose. Trading Forex and CFDs may not be suitable for all investors, so please ensure that you fully understand the risks involved and seek independent advice if necessary.
Disclaimer:
The above opinions given constitute general market commentary, and do not constitute the opinion or advice of IC Markets or any form of personal or investment advice.
Any opinions, news, research, analyses, prices, other information, or links to third-party sites contained on this website are provided on an "as-is" basis, are intended only to be informative, is not an advice nor a recommendation, nor research, or a record of our trading prices, or an offer of, or solicitation for a transaction in any financial instrument and thus should not be treated as such. The information provided does not involve any specific investment objectives, financial situation and needs of any specific person who may receive it. Please be aware, that past performance is not a reliable indicator of future performance and/or results. Past Performance or Forward-looking scenarios based upon the reasonable beliefs of the third-party provider are not a guarantee of future performance. Actual results may differ materially from those anticipated in forward-looking or past performance statements. IC Markets makes no representation or warranty and assumes no liability as to the accuracy or completeness of the information provided, nor any loss arising from any investment based on a recommendation, forecast or any information supplied by any third-party.

Interesting few days ahead... USD pairs approaching key levelsDXY is finishing a HTF consolidation and is approaching medium-term key areas. Other USD pairs are also in areas where they could aggressively turn around. EURUSD just finished a H4 3-touch continuation flag and is starting to stall on the 3rd touch, suggesting indecision in the markets.
Considering the news events in the next 3 days, starting today with USD advanced GDP data, we could see volatility kicking in on these key levels. We do need a catalyst to push price into a larger directional move, and we are prime positioned for the next leg. Technically, a breakout in both directions would make sense in these areas. Time to set alarms and be vigilant but not jump into trades too early, considering NFP on Friday as well.
*** **** ****
📈 Simplified Trading Rules:
> Follow a Valid Sequence
> Wait for Continuation
> Confirm Entry (valid candlestick pattern)
> Know When to Exit (SL placement)
Remember, technical analysis is subjective; develop your own approach. I use this format primarily to hold myself accountable and to share my personal market views.
The pairs I publish here are usually discussed in detail in my Weekly Forex Forecast (WFF) and are now showing further developments worth mentioning.
⚠ Ensure you have your own risk management in place and always stick to your trading plan.
*** **** ****
US Dollar Index: Down YTD, But at a 5-Week HighThe U.S. dollar plays a leading role in the performance of U.S. stocks versus international stocks. The greenback endured its worst first-half performance since 1973, helping ex-U.S. equities post massive absolute and relative gains through June. But could the narrative be shifting? And what might it mean for investors?
The U.S. Dollar Index (DXY) sits at a five-week high ahead of the July Federal Reserve interest rate decision and the key July jobs report to be released on August 1. Up four sessions in a row, the dollar appears poised to post its best month since last December (in fact, the DXY's first positive month of 2025). If it’s the start of a protracted recovery, then the “U.S. exceptionalism” trade could be back in vogue over the second half, resulting in the same old story of U.S. over international in the stock market.
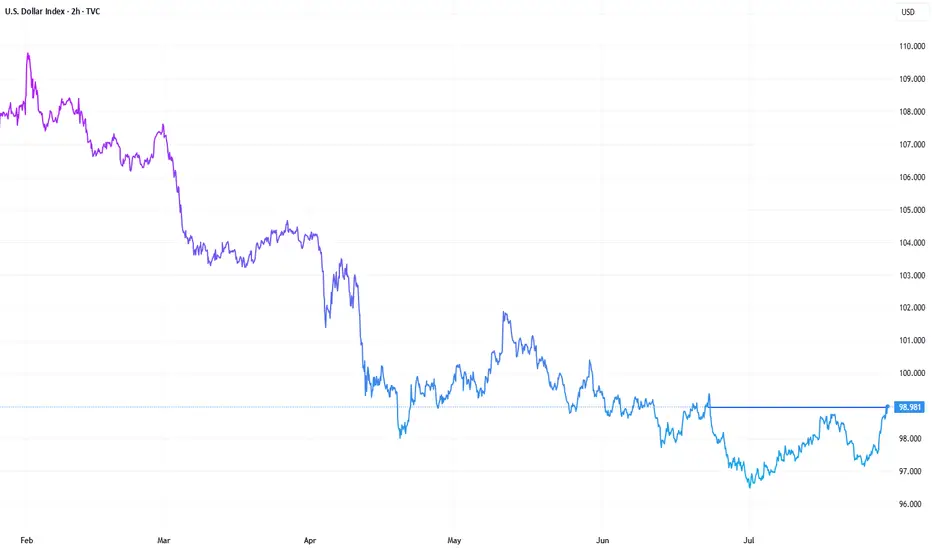
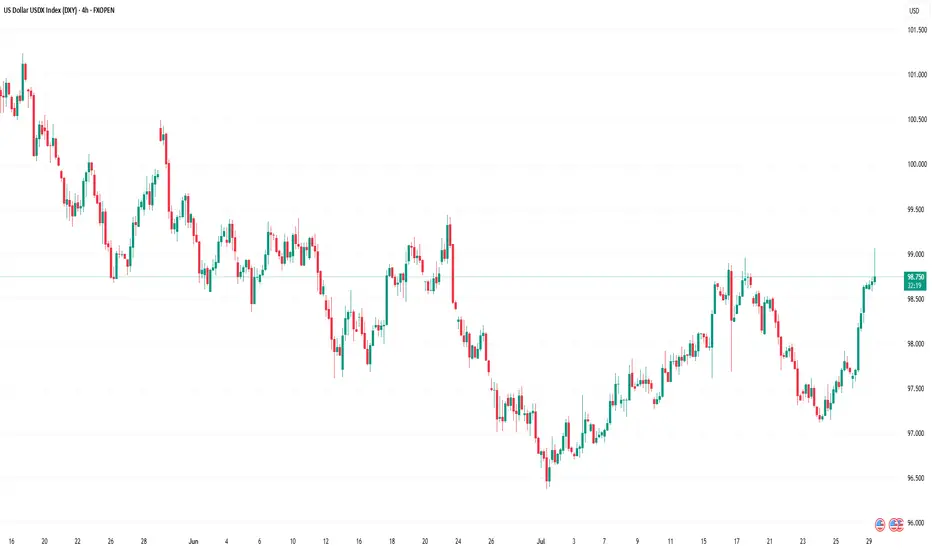
US Dollar Index (DXY) Reaches One-Month HighUS Dollar Index (DXY) Reaches One-Month High
The US Dollar Index (DXY) has risen to its highest level since early July. According to media reports, the bullish sentiment in the market is driven by the following factors:
→ Optimism around US trade agreements. A new trade deal with the EU — which includes a 15% tariff on European goods — is being perceived by the market as favourable for the United States.
→ Confidence in the resilience of the US economy. Strong Q2 corporate earnings have acted as an additional bullish catalyst. Investors may have started covering short positions against the dollar, viewing concerns over a US slowdown as overstated.
→ Expectations that the Federal Reserve will keep interest rates on hold.
From a technical standpoint, today’s DXY chart reflects strengthening bullish momentum.
Technical Analysis of the DXY Chart
Two U-shaped formations (A and B) that developed over the summer have created a bullish сup and рandle pattern — a formation that suggests waning bearish pressure, as evidenced by the shallower second dip.
This setup points to the potential for a bullish breakout above the trendline (marked in red) that has defined the downward movement in the DXY throughout the first half of 2025.
As previously analysed, there are signs that the dollar index may have found a base following a period of decline. This could indicate a shift in market sentiment and the possible end of the recent bearish phase.
This article represents the opinion of the Companies operating under the FXOpen brand only. It is not to be construed as an offer, solicitation, or recommendation with respect to products and services provided by the Companies operating under the FXOpen brand, nor is it to be considered financial advice.
EURUSD Will the 1D MA50 hold?The EURUSD pair has been trading within a Channel Up pattern since the April 21 2025 High. The price is right now on a strong pull-back and is about to test the 1D MA50 (blue trend-line) for the first time since May 12.
As long as the 1D candle closes above the 1D MA50, it will be a buy signal, targeting 1.19250 (a standard +3.20% rise).
If the candle closes below the 1D MA50, the buy will be invalidated and we will switch to a sell, targeting the 1D MA100 (green trend-line) at 1.14100.
-------------------------------------------------------------------------------
** Please LIKE 👍, FOLLOW ✅, SHARE 🙌 and COMMENT ✍ if you enjoy this idea! Also share your ideas and charts in the comments section below! This is best way to keep it relevant, support us, keep the content here free and allow the idea to reach as many people as possible. **
-------------------------------------------------------------------------------
Disclosure: I am part of Trade Nation's Influencer program and receive a monthly fee for using their TradingView charts in my analysis.
💸💸💸💸💸💸
👇 👇 👇 👇 👇 👇
