GOLD ON BULLISH#XAUUSD price is on good range to continue bullish but firstly we await 3139 to hit before entry.
Buy stop at 3139, take profit at 3158, stop loss at 3123. Above 3158 holds a bearish reversal which will drop the price.
Below 3119 is new pattern which have sell also.
DJ FXCM Index

No Rate Hike, No Mercy – AUD/USD Selling in Style!Riding the wave of bearish structure, AUD/USD continues to follow the macro trend with laser precision. After the RBA held rates steady, we’re seeing the typical post-news dump play out—fueled by the market’s disappointment and reduced sentiment.
Technically, price respected the 4H Fair Value Gap (FVG) and showed strong displacement to the downside, confirming continuation.
Key Targets:
🔻 0.62311 – Minor liquidity
🔻 0.62185 – 1H Sell-side liquidity
🔻 0.61703 – Ultimate short-term sell-side target
Expecting the market to bleed lower unless major fundamentals flip the bias. Until then... the trend is your bestie.
DYOR 🧠📉

BTC - 1H Clean Liquidity Hunt & Bearish Continuation BINANCE:BTCUSDT - 1H Update
Bitcoin remains in a bearish trend on the 4H and daily timeframes. After hunting the liquidity above the resistance zone, price began to drop exactly from our shared short entry at 83,700—and it's now on the move toward deeper targets.
🔹 Key Insights:
BTC grabbed liquidity just above resistance before reversing.
Price is now likely heading toward the liquidation zone below the support, aligning with the broader downtrend.
This setup offered a perfect short opportunity from $83,700, with clearly defined targets and risk.
🎯 Last Target: 80,200
💡 Congrats to all who followed our signal! The move is unfolding as expected.
📊 Stay locked in for the next big setups—follow for precise, real-time trade ideas! 🔔

EURUSD 4H Bearish Cross starting the peak formation.The EURUSD pair posted a strong rebound last week, which is along the lines of our long-term bearish structure estimate, similar to the September 2024 Top.
The 4H MA50/100 Bearish Cross that was formed on Thursday, simply confirms that the pattern goes according to plan as on September 06 2024, the price got rejected after its completion and then rebounded to test Resistance 1 before the ultimate market peak.
We still expect a similar development, with our ultimate long-term Target being 1.03650, just above Support 1.
-------------------------------------------------------------------------------
** Please LIKE 👍, FOLLOW ✅, SHARE 🙌 and COMMENT ✍ if you enjoy this idea! Also share your ideas and charts in the comments section below! This is best way to keep it relevant, support us, keep the content here free and allow the idea to reach as many people as possible. **
-------------------------------------------------------------------------------
Disclosure: I am part of Trade Nation's Influencer program and receive a monthly fee for using their TradingView charts in my analysis.
💸💸💸💸💸💸
👇 👇 👇 👇 👇 👇

EURUSD - what’s next?Here is our in-depth view and update on EURUSD . Potential opportunities and what to look out for. This is a long-term overview on the pair sharing possible entries and important Key Levels .
Alright first, let’s take a step back and take a look at EURUSD from a bigger perspective.
After making such a huge upside move, we are expecting EURUSD to have some sort of a correction or a pullback to the downside. After that we got a sell off on EURUSD and just today we hit the 50% correction level at around 1.08442 . After failing to break to the upside we can expect more sells to be in play. Any breaks to the downside from the current price will confirm this. Although TVC:DXY is not as strong at the moment, it still is a global reserve currency . We seen that in play last week when we saw massive upside on OANDA:XAUUSD and on TVC:DXY . We must understand that investors are also pouring their money into DXY as it is a global reserve currency. I still personally believe TVC:DXY holds more strength against TVC:EXY hence why I am still looking to short the pair.
Scenario 1: SELLS from current price
With the instant sell, we are risking a possible pullback and continuations to the upside however, DXY is looking like it will reverse. Failing to break to the upside can also be taken as a confirmation for potential sells.
Scenario 2: BUYS at the break of the Key Level (around 1.085)
With the break to the upside, we can expect more buys to come in play possibly targeting previous highs on EURUSD at around 1.09444.
KEY NOTES
- DXY possible reversal to the upside.
- Breaks above the KL and to the upside would confirm higher highs.
- EURUSD has completed the 50% correction to the upside.
- DXY is the global reserve currency.
Happy trading!
FxPocket

EURUSD Weekly FOREX Forecast: BUY IT!In this video, we will analyze EURUSD and EUR Futures for the week of March 31 - April 4th. We'll determine the bias for the upcoming week, and look for the best potential setups.
The bias is bullish for now, but the April 2nd tariffs can flip the markets upside down. Be careful. Let the market tell you which direction it's going, and trade accordingly. Allow the markets to settle on a bias before you jump in.
NFP on Friday, btw.
Enjoy!
May profits be upon you.
Leave any questions or comments in the comment section.
I appreciate any feedback from my viewers!
Like and/or subscribe if you want more accurate analysis.
Thank you so much!
Disclaimer:
I do not provide personal investment advice and I am not a qualified licensed investment advisor.
All information found here, including any ideas, opinions, views, predictions, forecasts, commentaries, suggestions, expressed or implied herein, are for informational, entertainment or educational purposes only and should not be construed as personal investment advice. While the information provided is believed to be accurate, it may include errors or inaccuracies.
I will not and cannot be held liable for any actions you take as a result of anything you read here.
Conduct your own due diligence, or consult a licensed financial advisor or broker before making any and all investment decisions. Any investments, trades, speculations, or decisions made on the basis of any information found on this channel, expressed or implied herein, are committed at your own risk, financial or otherwise.

EURUSD: Detailed Support & Resistance Analysis For Next Week
Here is my latest support and resistance analysis
for EURUSD for next week.
Consider these structures for pullback/breakout trading.
❤️Please, support my work with like, thank you!❤️
I am part of Trade Nation's Influencer program and receive a monthly fee for using their TradingView charts in my analysis.

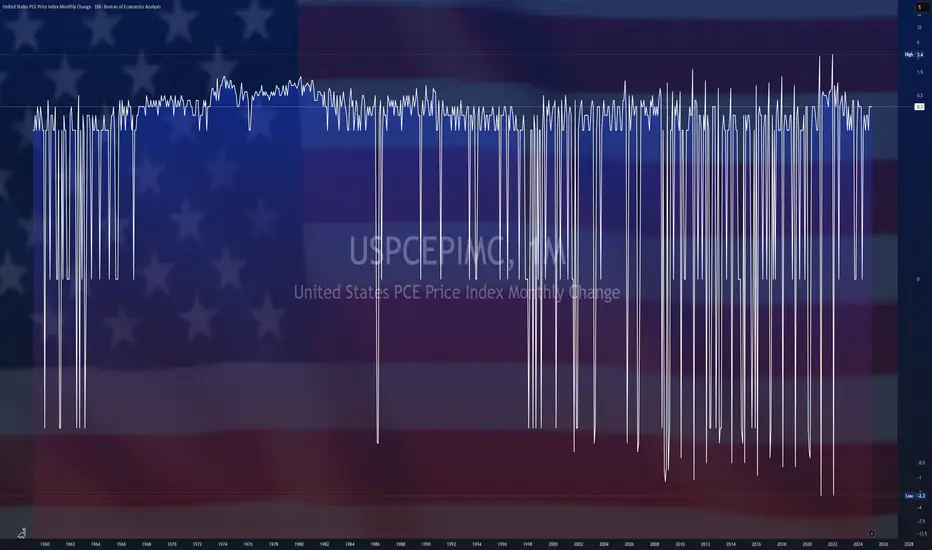
$USPCEPIMC -U.S Core PCE Inflation Rises More than ExpectedECONOMICS:USPCEPIMC
(February/2025)
source: U.S. Bureau of Economic Analysis
- The US PCE price index rose by 0.3% month-over-month in February, maintaining the same pace as the previous two months.
The core PCE index increased by 0.4%, the most since January 2024, surpassing the forecast of 0.3% and up from 0.3% in January.
On a year-over-year basis, headline PCE inflation remained steady at 2.5%, while core PCE inflation edged up to 2.8%, above the expected 2.7%.
USDCAD: Bullish Outlook For Next Week Explained 🇺🇸🇨🇦
There is a high chance that USDCAD will keep rising next week.
A test of the underlined blue support triggered a strong bullish reaction
and a breakout of a resistance line of a falling wedge pattern.
I think that the pair may rise and reach at least 1.4357 level.
❤️Please, support my work with like, thank you!❤️
I am part of Trade Nation's Influencer program and receive a monthly fee for using their TradingView charts in my analysis.

US500US500 Price Action Analysis and Trade Setups (March 28, 2025)
Price Action Summary:
Weekly Chart: Long-term uptrend intact, but recent rejection near 6,200 signals a medium-term correction.
Daily Chart: Price is consolidating near 5,600 after a sharp drop from highs. Bearish momentum persists.
4H Chart: Lower highs and lower lows confirm short-term bearish bias. Resistance at 5,750 is holding.
1H Chart: Intraday range between 5,550 and 5,750. Price struggling to break higher.
Trade of the Day (Day Trading Setup)
Short Setup:
Entry: 5,700 after rejection at resistance
Stop Loss: 5,770
Take Profit:
TP1: 5,620
TP2: 5,550
Reason: Short-term bearish structure with resistance holding at 5,750.
Swing Trading Setup
Short Setup:
Entry: Below 5,550 after daily close confirmation
Stop Loss: 5,650
Take Profit:
TP1: 5,300
TP2: 5,100

DOW JONES As the US economy is adopting to the changes Trump is coming with, the dollar is taking a hit.
US30 is looking bad, as many companies under it are badly affected.
Entry-level 42,320.85
Stop loss: 42,839.87
Take Profit: 40,740.27
Comment your view, let's help each other 🙏

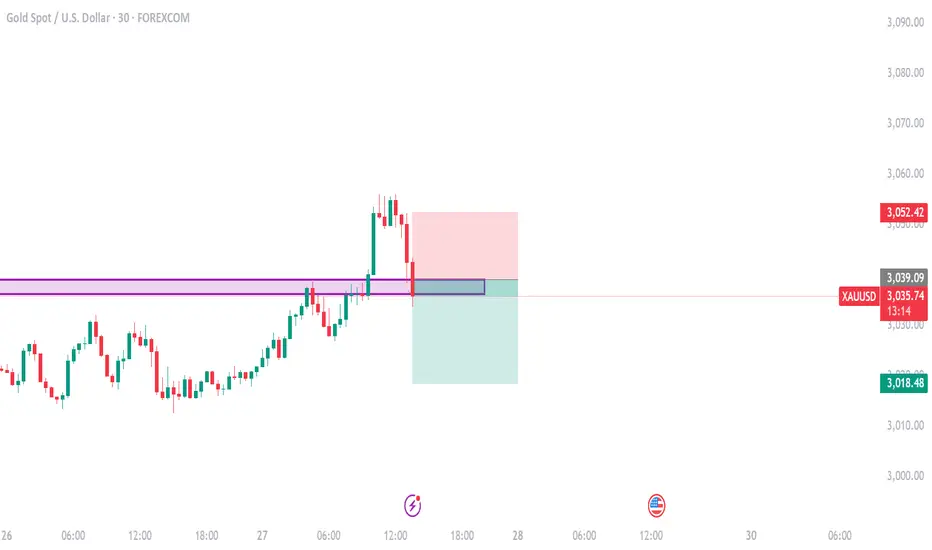
gold on bearish#XAUUSD on reverse pattern, we await for H1 candle to close below 3039-3036 before selling will occur.
Expected target to await 3019 maximum which can hold retrace, stop loss at 3052, entry at 3039-3036
Bullish can take place at 3057, once new ATH have taken place.
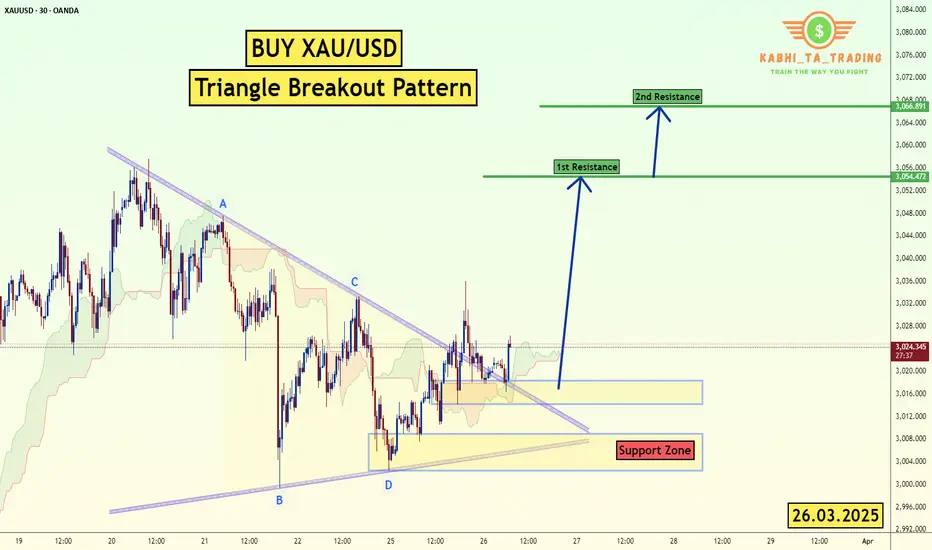
XAU/USD (Gold) Triangle Breakout (26.03.2025)The XAU/USD pair on the M30 timeframe presents a Potential Buying Opportunity due to a recent Formation of a Triangle Breakout Pattern. This suggests a shift in momentum towards the upside and a higher likelihood of further advances in the coming hours.
Possible Long Trade:
Entry: Consider Entering A Long Position around Trendline Of The Pattern.
Target Levels:
1st Resistance – 3054
2nd Resistance – 3066
🎁 Please hit the like button and
🎁 Leave a comment to support for My Post !
Your likes and comments are incredibly motivating and will encourage me to share more analysis with you.
Best Regards, KABHI_TA_TRADING
Thank you.
GOLD knocking on heaven's door againAnd once again we are at the spot, where MARKETSCOM:GOLD is trying to go for another all-time high. Will we see another strong push, or is it time for the commodity to slow down and retrace? Let's dig in!
TVC:GOLD
Let us know what you think in the comments below.
Thank you.
74.2% of retail investor accounts lose money when trading CFDs with this provider. You should consider whether you understand how CFDs work and whether you can afford to take the high risk of losing your money. Past performance is not necessarily indicative of future results. The value of investments may fall as well as rise and the investor may not get back the amount initially invested. This content is not intended for nor applicable to residents of the UK. Cryptocurrency CFDs and spread bets are restricted in the UK for all retail clients.

DOLLAR INDEX (DXY): Strong Bullish Sentiment
As I predicted yesterday, Dollar Index continued growing.
Analyzing the intraday price action today,
we can see that the market established a nice rising channel on a 4H.
I think that the Index will keep rising within a channel and will reach 105.0 level soon.
❤️Please, support my work with like, thank you!❤️

gold is bearish#XAUUSD price have multiple rejected above 3028-3032, now we expect a strong bearish to break down below 2990-2950.
Firstly below 3015 holds bearish, target 3007-2990. Stop loss 3030.
Bullish can hold when the H1 closes above 3035 limit.

Gold Trend for Today: Likely to hit its Support area 3000-2980Wednesday, March 26, 2025, with a specific scenario based on your support level at 2980 and the prior context of resistance at 3035–3060 and downside targets at 3000 and 2960. I’ll outline two plausible scenarios—a bounce at 2980 and a break below 2980—to give you a clear picture of what might unfold today. Projecting from a hypothetical opening near $3,020

USDCAD Sell PlanWatching price reaction at H1 and H4 FVGs — expecting continuation to the downside. Eyes on liquidity resting below recent lows.
H1 & H4 FVGs respected 👀

$DXY 10% Declines along with $SPX declines from 1987-1995In case you are wondering if the drop in the $USDOL TVC:DXY US Dollar of 10% from a high is a sign of something major going on in the stock market, it reminded me of research I did right when I got out of college in 1987.
Here's a quick overview of that pattern of TVC:DXY declines of 10% against the backdrop of SP:SPX or S&P500 Index declines at that time. The 1987 stock market crash is on the far left of this graph and gets the chart started for you to review.
The 10% drops from highs in the TVC:DXY index are labeled with yellow arrows and there were 9 of them across this time series from 1987-1995.
We can imagine how a Non-US investor would handle both a drop in the TVC:DXY and a drop in the SP:SPX , but a drop of both the TVC:DXY and SP:SPX of 10% together would mean a loss of 20% for the non-US investor. That is a painful loss and perhaps more than investors wanted to risk.
Historically, it was a good time to look for a stock market bottom AFTER a drop in the TVC:DXY index and the green boxes at the top show the risk of a deeper decline in the SP:SPX was minimal after this scenario.
So the end result of this analysis is that the Dollar can be viewed as a contrarian indicator after a meaningful decline, as in 10% in this time frame. Look for other signs of a market bottom, especially using my TVC:VIX signals (5 point spike indicator and VIX75% retracement) to help define a bottom. The VIX75 signal triggered on Monday, March 24th, indicating that the panic from the selloff had moderated to a point enough to signal that the panic was over.
Do some more research for yourself and see if the TVC:DXY drop was an "asset allocation" shift as US investors bailed out of US stocks to invest in non-US stocks or was it another wave of non-US investors dumping US stocks to cut risk.
Either way, know what you are investing in and question everything. These days, it is more important to be educated and use TradingView to chart and research the past will help you be a more educated investor.
Cheers,
Tim

USDJPY R&S ANALYSIS IS READY Hello Guys Here Is Chart Of USDJPY in 1-H AT
Entry Limit: BUY Around 150.000
SUPPORT: 150.000 - 149.600
Target Will Be : 151.300
This analysis R&S the price respects the Support zone.And it went to Uptrend

EURUSD - 2 ScenariosHello Traders !
On Tuesday 11 March, Th EURUSD reached the resistance level (1.09374 - 1.09058).
So, We have 2 Scenarios:
BULLISH SCENARIO:
If the market breaks above the resistance level and closes above that,
We will see a bullish move📈
TARGET: 1.11580🎯
BEARISH SCENARIO:
If the price breaks and closes below the neckline,
We will see a huge bearish move📉
TARGET: 1.06350🎯

US Dollar Weakens: Hedge Funds Shift to Short PositionsThe U.S. dollar, long considered a bastion of stability, is facing a significant shift in sentiment as hedge funds begin to adopt a bearish stance. This reversal, marking a notable change since the period following Donald Trump's election, is driven by a complex interplay of economic uncertainties and evolving market expectations.
Factors Driving the Bearish Turn:
• Shifting Federal Reserve Expectations:
o A key driver of this bearish sentiment is the evolving outlook on the Federal Reserve's monetary policy. Initially, expectations of a strong dollar were bolstered by projections of limited Fed rate cuts. However, growing concerns about the fragility of the U.S. economy have led to increased expectations of multiple rate reductions. This shift in expectations weakens the dollar's appeal.
• Economic Uncertainty and Trade Policies:
o Concerns surrounding potential trade wars and the impact of certain economic policies are also weighing on the dollar. Uncertainty about future trade relations and their potential impact on U.S. economic growth is creating apprehension among hedge fund managers.
o The impacts of possible public sector job cuts, and restrictive immigration policies, are also adding to the economic uncertainty.
• Data from the CFTC:
o Data from the Commodity Futures Trading Commission (CFTC) reveals a clear trend. Speculative traders have moved from holding significant long-dollar positions to net short positions, indicating a substantial shift in market sentiment.
• Global Economic Factors:
o The relative strength of other global economies also plays a role. If other global economies are showing signs of stronger growth, that can also put downward pressure on the dollar.
Implications of a Weaker Dollar:
• Impact on Global Trade:
o A weaker dollar can have significant implications for global trade, potentially making U.S. exports more competitive while increasing the cost of imports.
• Inflationary Pressures:
o A depreciating dollar can also contribute to inflationary pressures within the U.S. as import prices rise.
• Investment Flows:
o Changes in the dollar's value can influence international investment flows, as investors adjust their portfolios in response to currency fluctuations.
Market Analysis:
• Analysts are closely monitoring these developments, with some revising their dollar forecasts downward. The shift in hedge fund positioning underscores the growing uncertainty surrounding the U.S. economic outlook.
• It is important to understand that the currency markets are very dynamic, and things can change rapidly.
• The effects of political events, and world wide economic changes can have very large effects on the dollar.
In essence, the shift in hedge fund sentiment reflects a growing recognition of the complex economic challenges facing the U.S. As these challenges unfold, the dollar's trajectory will remain a key focus for investors and policymakers alike.

EURUSD Forming the new long-term Top.The EURUSD pair continues to trade within a Bullish Megaphone pattern and is about to complete today the 4th straight red 1D candle.
This is technically a top formation as the 1D RSI went from overbought (above 70.00) to below 60.00. Technically a downtrend gets confirmed when the price breaks below the 1D MA50 (blue trend-line) so until it does, the probability for another short-term bounce there isn't small. This is what took place in September 2024.
Once the 1D MA50 breaks though, we expect a test of Support 1 at 1.03650, as it happened on October 23 2024.
-------------------------------------------------------------------------------
** Please LIKE 👍, FOLLOW ✅, SHARE 🙌 and COMMENT ✍ if you enjoy this idea! Also share your ideas and charts in the comments section below! This is best way to keep it relevant, support us, keep the content here free and allow the idea to reach as many people as possible. **
-------------------------------------------------------------------------------
Disclosure: I am part of Trade Nation's Influencer program and receive a monthly fee for using their TradingView charts in my analysis.
💸💸💸💸💸💸
👇 👇 👇 👇 👇 👇
