$DXY HOLDS FIRM—TRUMP TARIFFS & FED FUEL 2025 BUZZTVC:DXY HOLDS FIRM—TRUMP TARIFFS & FED FUEL 2025 BUZZ
(1/9)
Good afternoon, Tradingview! The U.S. Dollar Index ( TVC:DXY ) sits at 106.47 today—tariffs and Fed vibes keep it humming 📈🔥. Down a hair from 106.60—let’s unpack this greenback glow! 🚀
(2/9) – YEARLY SURGE
• 2024 Run: From 100.16 to 107+ by Dec 💥
• Today: 106.47—off 0.12% from yesterday 📊
• Driver: Trump tariffs juice inflation fears
TVC:DXY ’s got grit—2025’s off to a zesty start!
(3/9) – BIG BOOSTERS
• Tariffs: Auto, chip threats—dollar darling 🌍
• Fed: Slow cuts—rates outshine abroad 🚗
• Crypto Nod: Pro- AMEX:USD admin vibes 🌟
Greenback’s flexing—policy packs a punch!
(4/9) – MARKET PULSE
• Vs. Peers: Outpaces euro, yen—rate gaps shine 📈
• X Chatter: 107 peak, post-swearing dip?
• Edge: U.S. growth trumps global woes 🌍
TVC:DXY ’s steady—king of the currency hill?
(5/9) – RISKS IN PLAY
• Deficits: Fiscal bloat looms long-term ⚠️
• Geo-Tension: Wars nudge safe-haven bets 🏛️
• Fed Pivot: Faster cuts could dim shine 📉
Tough tailwinds—can TVC:DXY dodge the drag?
(6/9) – SWOT: STRENGTHS
• Tariffs: Inflation lift—dollar darling 🌟
• Rates: Fed’s edge over ECB, BOJ 🔍
• Haven: Chaos loves $ USD—rock solid 🚦
TVC:DXY ’s got muscle—global star!
(7/9) – SWOT: WEAKNESSES & OPPORTUNITIES
• Weaknesses: Debt piles—future wobble? 💸
• Opportunities: Tariff hikes zap rivals 🌍
Can TVC:DXY keep the crown or stumble?
(8/9) – TVC:DXY at 106.47—what’s your vibe?
1️⃣ Bullish—108+ by spring.
2️⃣ Neutral—Holds steady, risks hover.
3️⃣ Bearish—Dips below 100 soon.
Vote below! 🗳️👇
(9/9) – FINAL TAKEAWAY
TVC:DXY ’s 106.47 glow—tariffs, Fed, and grit shine 🌍🪙. Deficits lurk, but strength rules—bull or bust?
DJ FXCM Index

NZDUSD Short-term Channel Up aiming higher.The NZDUSD pair has been trading within a 20-day Channel Up and today hit its 4H MA50 (blue trend-line). Last time it did (February 18), it held and initiated a rebound marginally above the 1.236 Fibonacci extension.
Given that the current pull-back is almost as strong (-1.30%) as the previous, but more importantly the 4H RSI hit its 1-month Higher Lows trend-line, we expect a rebound. Our Target is again the 1.236 Fib ext, this time at 0.57900.
-------------------------------------------------------------------------------
** Please LIKE 👍, FOLLOW ✅, SHARE 🙌 and COMMENT ✍ if you enjoy this idea! Also share your ideas and charts in the comments section below! This is best way to keep it relevant, support us, keep the content here free and allow the idea to reach as many people as possible. **
-------------------------------------------------------------------------------
💸💸💸💸💸💸
👇 👇 👇 👇 👇 👇

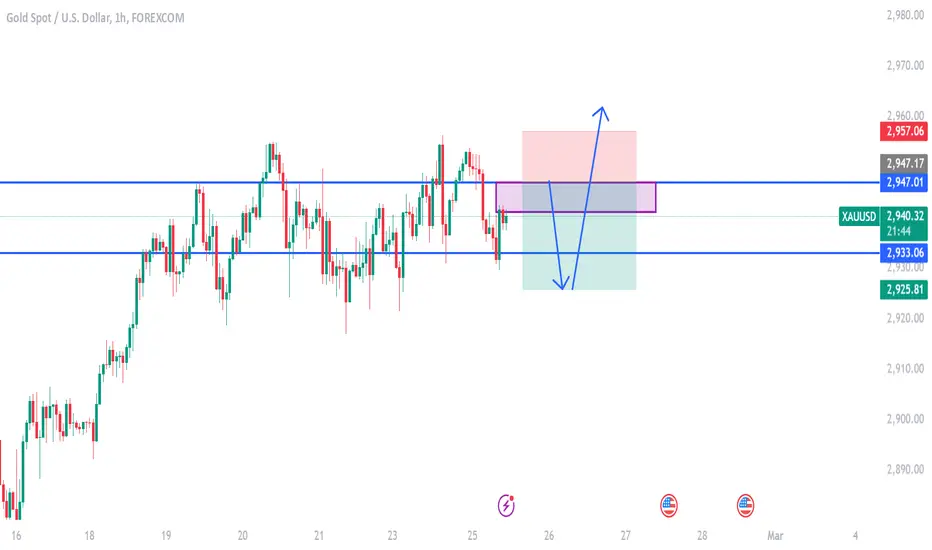
gold on bearish#XAUUSD price is now bearish, but firstly we await for price to close above 2947 or between the rectangle to sell. TP below 2933-2926, SL 2957. Below 2926 have bullish reverse but its depends on how the bearish takes control.
Dollar Index (DXY): Pullback From Resistance
I think we may see a local bearish continuation after a test
of a key daily/intraday resistance.
A local Change of Character on an hourly clearly shows the strength of the sellers.
The index may retrace at least to 106.53
❤️Please, support my work with like, thank you!❤️

SPY WEEKLY 24 FEB 2025Welcome to SPY Weekly. I have clearly explained the price action & momentum in this analysis.
If you have any doubts feel free to ask.
NOTE:DO NOT BLINDLY FOLLOW ANYONE

NZDUSD INTRADAY Bullish consolidation The NZDUSD currency pair price action sentiment appears bullish, supported by the longer-term prevailing uptrend. The recent intraday price action appears to be a sideways consolidation towards the breakout level, previous resistance, and now a new support zone.
The key trading level is at 0.5730 level, the previous consolidation price range and also the support trendline zone. A corrective pullback from the current levels and a bullish bounce back from the 0.5730 level could target the upside resistance at 0.5770 followed by the 0.5800 and 0.5825 levels over the longer timeframe.
Alternatively, a confirmed loss of the 0.5730 support and a daily close below that level would negate the bullish outlook opening the way for a further retracement and a retest of 0.5690 support level followed by 0.5635.
This communication is for informational purposes only and should not be viewed as any form of recommendation as to a particular course of action or as investment advice. It is not intended as an offer or solicitation for the purchase or sale of any financial instrument or as an official confirmation of any transaction. Opinions, estimates and assumptions expressed herein are made as of the date of this communication and are subject to change without notice. This communication has been prepared based upon information, including market prices, data and other information, believed to be reliable; however, Trade Nation does not warrant its completeness or accuracy. All market prices and market data contained in or attached to this communication are indicative and subject to change without notice.

EURUSD - the upcoming US PCE & the ECB rate decisionAt the moment, we are seeing that the bulls are fighting hard to keep MARKETSCOM:EURUSD elevated. But they are struggling to overcome some key resistance barriers. But the upside doesn't look very promising, due to the upcoming US PCE numbers and the ECB rate decision. Let's dig into the possible near-term outcome scenarios for the $FX_IDC:EURUSD.
What are your thoughts on this?
74.2% of retail investor accounts lose money when trading CFDs with this provider. You should consider whether you understand how CFDs work and whether you can afford to take the high risk of losing your money. Past performance is not necessarily indicative of future results. The value of investments may fall as well as rise and the investor may not get back the amount initially invested. This content is not intended for nor applicable to residents of the UK. Cryptocurrency CFDs and spread bets are restricted in the UK for all retail clients.

GBP/USD Wedge Breakout (24.2.25)The GBP/USD Pair on the M30 timeframe presents a Potential Selling Opportunity due to a recent Formation of a Wedge Breakout Pattern. This suggests a shift in momentum towards the downside in the coming hours.
Possible Short Trade:
Entry: Consider Entering A Short Position around Trendline Of The Pattern.
Target Levels:
1st Support – 1.2567
2nd Support – 1.2515
🎁 Please hit the like button and
🎁 Leave a comment to support for My Post !
Your likes and comments are incredibly motivating and will encourage me to share more analysis with you.
Best Regards, KABHI_TA_TRADING
Thank you.

btcusd on bearish rebound#BTCUSD price have reformed, now we wait for breakout below 95200 to sell, the expected target is below 93800 which holds reverse, Stop loss at 96200. But price falling below 95200 can reverse firstly before taking the next step to sell.

Is it time to buy the US dollar?With US inflation rising, the US economy performing well, and rates higher for longer (well, I wouldn't be surprised to see the Fed hike rates by the end of 2025), the USD continues to be an obvious buy.
The TVC:DXY is currently testing key horizontal support (previously resistance) and is nearing the weekly moving averages. This could be the time to buy the dollar.
I'm personally looking to short OANDA:EURUSD OANDA:GBPUSD and OANDA:NZDUSD and buy OANDA:USDCAD and OANDA:USDCHF

EURUSD Will it follow Trump's 1st Term??The EURUSD pair made a market bottom on January 13 2025 and in recent trade, it has been consolidating above the 1D MA50 (blue trend-line). Interestingly enough, this is so far similar to the price action that preceded and followed Trump's 1st Term.
A 1D Death Cross took the market from the November 2016 elections to the January 2017 bottom. After a 1D RSI Double Top and Resistance rejection, the pair dropped again below the 1D MA50 (blue trend-line) but recovered to reach the 1D MA200 (orange trend-line) in end of March 2017 and initiate an aggressive Channel Up that peaked on the 1.618 Fibonacci extension from the September 2016 High.
If EURUSD continues to replicate Trump's Year 1 of his 1st Term, it is possible to see the price reach 1.19000 by the end of 2025, although of course we can't rely solely on repetitive patterns, but have to go along macro reports and policies one at a time.
-------------------------------------------------------------------------------
** Please LIKE 👍, FOLLOW ✅, SHARE 🙌 and COMMENT ✍ if you enjoy this idea! Also share your ideas and charts in the comments section below! This is best way to keep it relevant, support us, keep the content here free and allow the idea to reach as many people as possible. **
-------------------------------------------------------------------------------
Disclosure: I am part of Trade Nation's Influencer program and receive a monthly fee for using their TradingView charts in my analysis.
💸💸💸💸💸💸
👇 👇 👇 👇 👇 👇

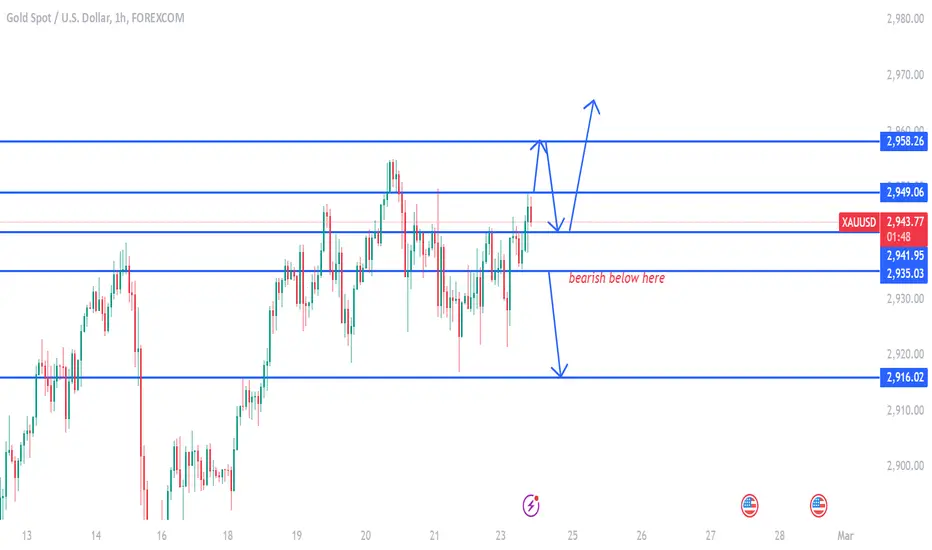
gold on bullish rejection above 2958#XAUUSD has repeatedly faced rejection above the 2949 level, forming a strong bearish zone. Currently, the market awaits a decisive breakout.
A breakout above 2949 could trigger a bullish toward the next decline zone at 2958, where profit-taking may occur. However, a pullback to 2942 is expected before further bullish continuation.
If the price fails to sustain above 2949 and drops below 2935, strong selling pressure could push toward 2916, indicating a deeper bearish trend.
Bearish drop?US Dollar Index (DXY) has rejected off the pivot and could drop to the 1st support that line sup with the 161.8% Fibonacci extension.
Pivot: 107.49
1st Support: 105.44
1st Resistance: 108.67
Risk Warning:
Trading Forex and CFDs carries a high level of risk to your capital and you should only trade with money you can afford to lose. Trading Forex and CFDs may not be suitable for all investors, so please ensure that you fully understand the risks involved and seek independent advice if necessary.
Disclaimer:
The above opinions given constitute general market commentary, and do not constitute the opinion or advice of IC Markets or any form of personal or investment advice.
Any opinions, news, research, analyses, prices, other information, or links to third-party sites contained on this website are provided on an "as-is" basis, are intended only to be informative, is not an advice nor a recommendation, nor research, or a record of our trading prices, or an offer of, or solicitation for a transaction in any financial instrument and thus should not be treated as such. The information provided does not involve any specific investment objectives, financial situation and needs of any specific person who may receive it. Please be aware, that past performance is not a reliable indicator of future performance and/or results. Past Performance or Forward-looking scenarios based upon the reasonable beliefs of the third-party provider are not a guarantee of future performance. Actual results may differ materially from those anticipated in forward-looking or past performance statements. IC Markets makes no representation or warranty and assumes no liability as to the accuracy or completeness of the information provided, nor any loss arising from any investment based on a recommendation, forecast or any information supplied by any third-party.

Weekly FOREX Forecast Feb 24-28thThis is an FX FUTURES outlook for the week of Feb 24-28th.
In this video, we will analyze the following futures markets:
USD Index*
EUR
GBP
AUD
NZD
CAD
CHF
JPY
The USD continues its bearish ways this upcoming weak. It's currency counterparts will likely see some upside this week. Especially the JPY.
Enjoy!
May profits be upon you.
Leave any questions or comments in the comment section.
I appreciate any feedback from my viewers!
Like and/or subscribe if you want more accurate analysis.
Thank you so much!
Disclaimer:
I do not provide personal investment advice and I am not a qualified licensed investment advisor.
All information found here, including any ideas, opinions, views, predictions, forecasts, commentaries, suggestions, expressed or implied herein, are for informational, entertainment or educational purposes only and should not be construed as personal investment advice. While the information provided is believed to be accurate, it may include errors or inaccuracies.
I will not and cannot be held liable for any actions you take as a result of anything you read here.
Conduct your own due diligence, or consult a licensed financial advisor or broker before making any and all investment decisions. Any investments, trades, speculations, or decisions made on the basis of any information found on this channel, expressed or implied herein, are committed at your own risk, financial or otherwise.

USDCHF shortMy analysis was on the 1 hour timeframe and a small position. When I looked at the daily timeframe, I came across a range that could work very well. I have a Fibonacci line that is 86 and I love this line. In one of my tutorials, I came across this line that in range bounds, the trend reversal always comes and touches 86. It has touched the high level and is changing the trend downwards and we can ride this wave.

xauusd analysis for coming weekKey Factors Influencing XAU/USD
Monetary Policy & Interest Rates:
By early 2025, the Federal Reserve’s stance will be critical. If rate cuts are underway (due to recession risks or controlled inflation), gold could rally as the USD weakens. Conversely, a "higher-for-longer" rate policy could cap gains.
Watch for Fed speeches and the PCE inflation report (due late February 2025) for clues.
Geopolitical Risks:
Escalations in conflicts, trade tensions, or unexpected crises (e.g., energy disruptions, elections) could trigger safe-haven demand for gold.
USD Strength:
A strong dollar (e.g., from robust U.S. economic data) may pressure gold. Monitor the DXY Index for inverse correlations.
Scenario-Based Outlook
Bullish Case:
Fed dovishness + weak USD + geopolitical instability → Rally toward $2,100–2,150/oz.
Bearish Case:
Hawkish Fed + strong U.S. data + risk-on sentiment → Decline toward $1,900–1,850/oz.
Trading Strategy
Long-term investors: Accumulate near $1,920–1,950/oz if fundamentals align with bullish drivers.
Critical Events to Monitor
Fed Chair Powell’s testimony (if scheduled).
U.S. Q4 GDP revisions (February 27, 2025).
Global PMI data (manufacturing/services activity).
Geopolitical developments (e.g., U.S.-China relations, Middle East tensions).
Conclusion
Gold’s trajectory will hinge on the interplay between Fed policy, the dollar, and risk sentiment. While technicals suggest a range-bound market between $1,900–2,080/oz, prepare for volatility around key data releases. Always use risk management tools (stop-loss, position sizing) given the uncertainty of long-term forecasts.
more detailed video analysis will be published soon
BOOST US SHARE US

USD Bulls on the RopesThe US dollar (USD) – per the US Dollar Index – is on track to end February on the ropes following January’s monthly indecision candle at the resistance of 109.33. I believe USD bears have space to drive towards a ‘local’ descending support around 105.40ish, extended from the high of 107.35.
Similarly, the daily timeframe demonstrates scope for sellers to strengthen their grip. Last week witnessed the Index reject resistance at 107.05, drawing focus towards an ‘alternate’ AB=CD from 105.77 (the 1.272% Fibonacci projection ratio). For those unfamiliar with Harmonic trading, an alternate AB=CD is simply an extended equal AB=CD formation using either 1.272% or 1.618% Fibonacci projection ratios. Interestingly, not only does the alternate AB=CD pattern share chart space with daily support at 105.62, but these daily levels are located just north of the monthly timeframe’s descending support line underlined above. Consequently, although there is room for bears to take control in the short to medium term, the combination of the monthly and daily support levels could entice profit-taking and encourage fresh long positions into the market, should we reach said area.
Given monthly and daily charts echoing a bearish vibe, I will primarily focus on short-term resistance levels this week. One standout area of H1 resistance is between 107.24 and 107.14, made up of two trendline resistance lines (drawn from 109.88 and 106.57), a horizontal resistance level and two Fibonacci retracement ratios (78.6% and 38.2%). What is also interesting from a technical perspective is that the above-noted H1 resistance zone converges closely with daily resistance mentioned above at 107.05, therefore should the H1 resistance area be tested, the fact daily resistance is also present could add weight to a bearish showing. Should we fail to reach as high as the H1 zone, my next base case scenario is to watch local H1 supports to cede ground to trigger possible selling opportunities: the 106.43 low, for example.

USDJPY Weekly BiasThis pair has been on a bearish momentum for the past few weeks and I do anticipate that it will continue.
My targets are;
1. 148.68 - Towards the Sellside Liquidity
2. 147.4 - Towards the Weekly FVG
The daily and hourly timeframe will give us our entry price.

EURUSD: Support & Resistance Analysis For Next Week 🇪🇺🇺🇸
Here is my latest structure analysis
and important supports and resistances for EURUSD for next week.
Consider these structures for pullback/breakout trading.
❤️Please, support my work with like, thank you!❤️

BTCUSD Daily Inflection Point UpdatePreviously I mentioned the weekly was consolidating, but there is potential for this momentum consolidation to have a breakout leg as momentum shifts and the final emotional price movements are played out. I was too conservative in my price projections; a lot more than I used to be- but there wasn't a whole lot of TA involved- I figured the dollar issues would crop up earlier.
Now that the Fed had pivoted. the yields are creeping back up pushing bitcoin back down. The fed doesn't let on just how dire the situation is- and with global tensions rising, the dollar is at significant risk.
I expect a broad correction in all the markets- and cash to become very tight.
There is daily momentum consolidation- and if any other events occur that send yields upward- bitcoin is likely to suffer as a consequence. If instead we sail into the new year unscathed- then this consolidation may provide another leg up; but a break below 88k and a push towards 60k may solidify bitcoins correction.
DAILY
WEEKLY

btcusd on bearish reverse#BTCUSD remains in a bearish setup, with a key break below $96,000 needed to confirm further downside momentum. The take profit zone for shorts is set at $94,800 - $93,000, with a stop loss at $97,000 to protect against a reversal.
However, if price recorrects and forms a double breakout above $97,400, it could trigger bullish momentum, potentially pushing BTC toward $98,300 before any further movement.

GBP/USD at Key Resistance: Potential Reversal or Continuation?The GBP/USD 15-minute chart indicates a strong uptrend, with price action forming a **Crab harmonic pattern**, suggesting a potential overextension. The pair has reached a key resistance zone at **1.26323**, aligning with significant Fibonacci levels, with the **Harmonic Optimal Point (HOP) at 1.26469** acting as a potential reversal area.
If a pullback occurs, the first downside targets are 1.26127 and 1.25993 , while the ** 200 EMA ** below may provide further support. A sustained break above 1.26469 could signal continued bullish momentum. Traders should monitor price action for confirmation before positioning accordingly.

DOLLAR INDEX (DXY): One More Bearish Movement
Dollar Index keeps updating the lows on a daily.
With a strong bearish movement, the price violated a key horizontal support yesterday.
Probabilities are high that the market will continue falling.
Next support - 106.15
❤️Please, support my work with like, thank you!❤️
