USD completing wave 5US Dollar index hit the long term 61.8% retracement at 108.95.
This could be the wave 5 completion, which may be a big resistance for the US Dollar to start the year.
DJ FXCM Index

btcusd on bullish#BTCUSD have rejected the bearish continuation which was below 94800, now price is about to breakout 97k which will take it above 100k for bearish flag, now we await for 97k to take buy, SL 96k, TP 100k. Above 100k holds sell which will drop the coin back to 94800 or more.

gold on bearish retracement#GOLD price have finally breakout above the third pattern, now we expect price rejection above 2646 which have sell retracment, the minimum on D1 TF shows decline above there unless price can hold above 2640. Between 2636 have sell on multiple breakout also and 2630.5. Bullish range can form unless price did not break below 2630.5 in 3 hours. Sell 2646, SL 2654, TP 2612. Also sell 2636 on multiple breakout and 2630.5

btc on bearish#BTCUSD firstly we await for H1 candle to close between the rectangle before taking sell but if price closes above bullish then the sell is inactive. Entry closure at 95400-95500 for selling, target 93800-91k, stop loss at 96359. Based on the movement if inactive then price is heading 97500 for sell retracment.

gold on bearish#XAUUSD on multiple reverse, now we expect price to reach 2625 for bearish retracment, above there holds some decline to drop the pair back to 2607 which will form buy. Sell limit 2625, take profit 2607, stop loss 2632. Bullish can take place unless there is longer candlestick on H1.

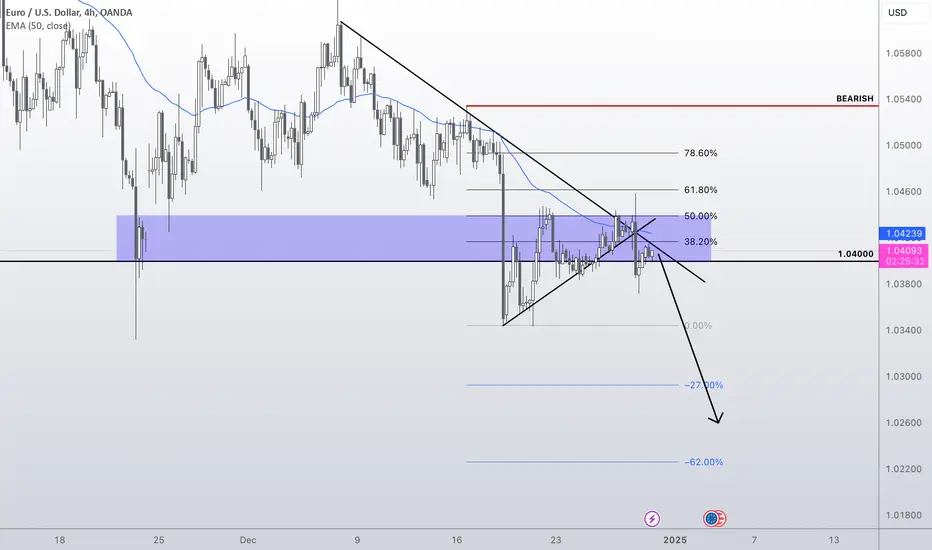
Shorting Euro DollarPrice has consolidated in SNR zone for the past few days. Creating a double top and a break of a counter trend line. Shorts incoming
GBP/USD Technical Analysis: Key Levels and Possible ScenariosThe chart focuses on GBP/USD in the 1-hour timeframe, highlighting critical resistance levels and potential downside targets. The current setup indicates rejection from a resistance zone, with a potential move toward the predefined price targets.
Key Levels:
Resistance Zone at 1.2580–1.2590:
This area has acted as a strong resistance, with the price failing to break above it.
A breakout above this zone could shift the market sentiment and pave the way for further upside toward 1.2600+.
Downside Targets:
1.25124 and 1.25012 have been identified as key bearish targets.
These levels represent potential areas where the bearish momentum may slow down or pause.
Indicator Insights:
DT Oscillator:
Currently trending downward, indicating bearish momentum in the short term.
A further drop toward oversold territory could coincide with the price approaching the bearish targets.
Scenarios:
Bearish Scenario:
Continued rejection from the 1.2580–1.2590 resistance zone could lead the price toward the bearish targets at 1.25124 and 1.25012.
A breakdown below 1.25012 could accelerate the downside movement further.
Bullish Scenario:
If the price reverses and breaks above the 1.2580–1.2590 resistance zone, it could invalidate the bearish outlook and signal a potential move toward higher levels, such as 1.2600+.
Conclusion:
GBP/USD is showing signs of bearish momentum, with 1.2580–1.2590 acting as a strong resistance and 1.25124 and 1.25012 identified as key downside targets. Traders should monitor price reactions at these levels and use confirmation signals, such as momentum shifts, to adjust their strategies accordingly.
Feel free to share your thoughts in the comments and follow me for more detailed analyses!

GOLD XAUUSD IS RECOVERING BECAUSE OF HAWKISH POLICIESThe expert explained that amid persistent inflation concerns, the US Central Bank is expected to be more cautious in its interest rate decisions next year. This is likely to support bond yields and the US dollar, two factors that often reduce the appeal of gold.
Higher bond yields have a significant impact on investment demand for the yellow metal, as they increase the opportunity cost of holding these non-yielding assets. “At the same time, the greenback’s resilience, supported by hawkish central bank policies and strong economic data, makes gold more expensive for buyers holding other currencies. These dynamics could limit gold’s upside potential in the first half of next year.”
🔥 XAUUSD SELL 2625 - 2628🔥
💵 TP1: 2620
💵 TP2: 2610
💵 TP3: OPEN
🚫 SL: 2637

EURUSD Channel Up targeting the 4H MA200.The EURUSD pair broke above its 4H MA50 (blue trend-line) and following a Double Bottom bounce on the Support Zone on December 18, it started a Channel Up.
Having initiated that after a highly oversold 4H RSI, it shares many similarities with the November 22 Channel Up, which peaked just below the 4H MA200 (orange trend-line). This is where our current short-term Target is at 1.04900.
-------------------------------------------------------------------------------
** Please LIKE 👍, FOLLOW ✅, SHARE 🙌 and COMMENT ✍ if you enjoy this idea! Also share your ideas and charts in the comments section below! This is best way to keep it relevant, support us, keep the content here free and allow the idea to reach as many people as possible. **
-------------------------------------------------------------------------------
💸💸💸💸💸💸
👇 👇 👇 👇 👇 👇

The Dollar Index Rises by 6.7% in 2024The Dollar Index Rises by 6.7% in 2024
Throughout 2024, the US dollar traded with mixed dynamics but showed consistent strengthening over the past three months.
According to WSJ and Reuters, the following factors contributed to this growth:
→ Reports of a strong US economy and expectations that further interest rate cuts by the Federal Reserve will be limited.
→ Projections of policies under President-elect Donald Trump, which are anticipated to focus on tax reductions, increased tariffs, and stricter immigration controls.
During the low-volatility holiday trading period, the US Dollar Index—a tool measuring the dollar's strength against a basket of major currencies—hovered around a two-year high, where it may close a strong year.
Meanwhile, the euro remains near two-year lows, but bulls hold onto hope.
As technical analysis of the EUR/USD chart indicates today:
→ The price is near a support level formed by an ascending channel (marked in blue).
→ Simultaneously, price fluctuations are shaping a bullish “cup and handle” pattern below the 1.0444 level—signalling growing interest among buyers.
A breakout above the red descending trendline could help bulls start 2025 confidently, potentially pushing the price higher from the lower boundary of the channel.
This article represents the opinion of the Companies operating under the FXOpen brand only. It is not to be construed as an offer, solicitation, or recommendation with respect to products and services provided by the Companies operating under the FXOpen brand, nor is it to be considered financial advice

gold on short bullish#GOLD price have declined multiple above 2623-2627, now we await price to form another bullish at 2613 which holds short breakout on buy, likely we still wait for price to see if it will break below 2608 which holds strong bearish. Buy limit 2613-2621 which holds bullish also, take profit 2638, stop loss 2608 which holds sell.

UP "Please provide a meaningful and detailed description of your prediction..." Says Tradingview
Up. It go up. Why? Idono the same as you do or do not know. It's the simple things I think that makes dollars sound like soundness of mind. While lil Timmy has been working hard to get a few bucks to buy his favorite dog coin he heard about at lunch yesterday in middle school.
Asking a fool like me what to buy with his allowance. Who isn't looking for a return nowadays I guess even at 11 we need to make 1000x gainz because "10 years!?" "That's forever!" he and any other like minded person may say to me. I think all they heard was the "10 Year" Part...😋
Ya know? One things for sure we are all counting dollars when this or whatever thing you think will make you money moves up or down. Hummmmmm Maybe there's something to that whole I need a dollar thought?🤑
I bet it would be carzy to see the Yield on the 10 year US GOV Bonds run up to 16%.
What kind of future are we all living in when that happens??? Asking for this 11 year old thats asking me what the next best coin is from here....
YOLO Moonboyz 🌛 If you feel so inclined to do so.
🚽👄 Toilet Mouth: "Why do all your post say Short!?" or a bunch of "BUT, BUT, BUT"
⭐Not my job to tell you to buy or sell entries matter to most I only care about my exits.
⭐Let each person determine their cost to acquire and choice to play or not.
No Advice to give just thoughts that I can't shake after the last 8 years in the world of "CRYPTO"
Things 🤷♂️ #Fixed IDK!
🙏FOR JUST A HEALTHLY PULLBACK!
""KEEP CALM AND MANAGE THY RISK & BALANCE your Senses!""
I am The CoinSLayer 👨💻😈
You have been warned by The Coin SLayer!
P.S. Now witha bag!
P.S.S. well two or Ten

Bullish bounce?US Dollar Index (DXY) is falling towards the pivot and could bounce to the 1st resistance.
Pivot: 107.49
1st Support: 106.72
1st Resistance: 108.52
Risk Warning:
Trading Forex and CFDs carries a high level of risk to your capital and you should only trade with money you can afford to lose. Trading Forex and CFDs may not be suitable for all investors, so please ensure that you fully understand the risks involved and seek independent advice if necessary.
Disclaimer:
The above opinions given constitute general market commentary, and do not constitute the opinion or advice of IC Markets or any form of personal or investment advice.
Any opinions, news, research, analyses, prices, other information, or links to third-party sites contained on this website are provided on an "as-is" basis, are intended only to be informative, is not an advice nor a recommendation, nor research, or a record of our trading prices, or an offer of, or solicitation for a transaction in any financial instrument and thus should not be treated as such. The information provided does not involve any specific investment objectives, financial situation and needs of any specific person who may receive it. Please be aware, that past performance is not a reliable indicator of future performance and/or results. Past Performance or Forward-looking scenarios based upon the reasonable beliefs of the third-party provider are not a guarantee of future performance. Actual results may differ materially from those anticipated in forward-looking or past performance statements. IC Markets makes no representation or warranty and assumes no liability as to the accuracy or completeness of the information provided, nor any loss arising from any investment based on a recommendation, forecast or any information supplied by any third-party.

EURUSD: 4H MA50 crossing signals new rally.EURUSD is remains bearish on its 1D technical outlook (RSI = 41.523, MACD = -0.006, ADX = 15.575) but today it crossed and closed a 4H candle over the 4H MA50 for the first time since December 10th. Along with that, it crossed above the LH trend-line, thus technically invalidating the short term bearish trend. Given the recent December 18th double bottom on the S1 Zone, the pattern that prevails is a Rectangle, thus today's breakout is technically targeting the patterns top. Consequently our target is near the R1 Zone (TP = 1.0600).
## If you like our free content follow our profile to get more daily ideas. ##
## Comments and likes are greatly appreciated. ##

The Relationship Between Dollar Dominance, Debt, and Deficits
The US dollar's position as the world's reserve currency grants the United States a unique set of economic advantages and challenges. This "exorbitant privilege," as it's often called, significantly influences the nation's ability to manage its debt and deficits. Understanding this complex relationship is crucial for comprehending the dynamics of the global financial system and the US economy's position within it.
Dollar Dominance: A Foundation of Economic Power
The dollar's status as the primary reserve currency means that it is widely held by central banks, international institutions, and businesses worldwide. This widespread acceptance creates consistent demand for dollar-denominated assets, particularly US Treasury bonds. This demand is a key factor in allowing the US government to finance its debt at relatively low-interest rates. If the US were to borrow in another currency, or if global demand for its debt were significantly lower, the cost of borrowing would likely increase, making it more expensive to finance government spending.
This dominance also simplifies international trade for US businesses. Because the dollar is the standard currency for many global transactions, US companies can conduct business with reduced exchange rate risks and transaction costs. This ease of trade strengthens the US position in the global economy and contributes to its overall economic power.
Debt and Deficits: The Fiscal Realities
Government debt represents the accumulation of past budget deficits. A budget deficit occurs when government spending exceeds its revenue in a given fiscal year. These deficits require the government to borrow money, primarily by issuing Treasury bonds, which then contribute to the overall national debt.
While deficits can be used strategically to stimulate the economy during downturns or to fund essential public services, persistent and large deficits can lead to a growing national debt. A high debt level can have several potential consequences, including higher interest payments on the debt, reduced fiscal flexibility to respond to future economic crises, and potential inflationary pressures.
The Interplay: Dollar Dominance and Fiscal Policy
The relationship between dollar dominance, debt, and deficits is complex and multifaceted. The ability to borrow at lower costs due to the dollar's reserve currency status can, in some ways, lessen the immediate pressure to address budget imbalances. The lower interest rates make it less painful in the short term to finance deficits, potentially leading to a greater accumulation of debt over time.
However, it's crucial to understand that dollar dominance does not directly cause deficits. Deficits are a result of fiscal policy decisions—specifically, decisions about government spending and taxation. Dollar dominance merely affects the cost of financing those decisions. A government could run deficits regardless of its currency's global status, but the financial implications would likely be significantly different.
One could argue that the "exorbitant privilege" afforded by dollar dominance creates a moral hazard. Knowing that borrowing costs are relatively low could incentivize policymakers to engage in more expansive fiscal policies than they might otherwise pursue. This can lead to a situation where the long-term consequences of debt accumulation are downplayed in favor of short-term political or economic gains.
Potential Challenges to Dollar Dominance
While the dollar has maintained its dominant position for decades, several factors could potentially challenge its future status. The rise of other economic powers, the development of alternative reserve currencies, and shifts in global trade patterns are all potential threats.
For example, the increasing economic influence of countries like China has led to discussions about the potential for the renminbi to become a more prominent player in the global financial system. However, for a currency to achieve reserve status, it requires deep and liquid financial markets, strong institutions, and widespread trust in the issuing country's economic and political stability. These are factors that have contributed to the dollar's strength and are not easily replicated.
Furthermore, the emergence of new technologies, such as cryptocurrencies and digital payment systems, could potentially disrupt traditional financial flows and challenge the existing currency hierarchy. However, these technologies are still relatively new and face regulatory and adoption hurdles before they could pose a significant threat to the dollar's dominance.
Maintaining the Dollar's Strength
Maintaining the dollar's strength and its reserve currency status is a complex undertaking. It requires a combination of sound economic policies, strong institutions, and a commitment to maintaining open and transparent financial markets.
Sustainable fiscal policies are essential. While dollar dominance provides some flexibility, persistently large deficits and a rapidly growing national debt could eventually erode confidence in the dollar and its long-term value. This could lead to a decrease in demand for dollar-denominated assets, potentially increasing borrowing costs and weakening the dollar's global position.
In conclusion, the relationship between dollar dominance, debt, and deficits is a critical aspect of the US and global economies. While the dollar's reserve currency status provides significant advantages in financing government spending and facilitating international trade, it also presents challenges in managing fiscal policy. Maintaining the dollar's strength requires a balanced approach that prioritizes sound economic management and recognizes the complex interplay between these crucial economic factors.

You Are Here -> 10YR YIELDSThe next financial crisis is potentially right around the corner
11:11
The question is, has the fed lost control?
Is it by design?
In less than 50 Days the fed gets back together, 11/7
Election is 11/5
Veterans Day is 11/11

gold on bullish until breakout 2633#GOLD on H4 shows bullish range on breakout above 2633, possible movement above 2633 will take the price to 2650 which will form another bullish range to overall bullish at 2700, but looking at the D1 price can fall below 2621 which can possible drops between 2610-2616 but if any breakout below 2608 then #GOLD is bearish, price will make move on longer 2570-2500. Firstly we wait for breakout to happen before taking any possible trades. Gold is bullish looking at the H1 but without the breakout above 2633 it won't make move.

DXY Happy New Year Analysis Hey guys, this will be my last analysis for the year. I hope you all get some rest and reflection. The markets aren't that great during this period, so don't put yourself at a disadvantage. Go spend time with your family and friends, go have fun, go get ready to dominate the coming year.
Merry Xmas and a happy new year!
- R2F Trading

btcusd on bearish reverse below 92130#BTCUSD on multiple reverse, now we exercise drop below 92130 for longer sell till 90k-89k but market price sell can start at current price ,above 93800 buy can still move. Overall move on #BTC can take correction if price falls 92130 back to 93k-94k. Selling at 92130, SL 92800 TP 90k 89k

US Dollar Index (DXY) COnsolidating Within an Ascending ChannelChart Analysis:
The U.S. Dollar Index (DXY) continues to trend higher within a well-defined ascending channel (green zone). The index has pulled back slightly but remains firmly within its bullish structure.
1️⃣ Ascending Channel:
Price action remains within the channel, with current consolidation near the midline around 108.08. A move to test the upper or lower bounds of the channel could be next.
2️⃣ Moving Averages:
50-day SMA (blue): Positioned at 105.69, acting as short-term dynamic support.
200-day SMA (red): Positioned at 104.29, confirming the long-term bullish trend.
3️⃣ Momentum Indicators:
RSI: At 65.34, indicating strong bullish momentum but nearing overbought levels, which may limit immediate upside.
MACD: Bullish momentum remains intact, with the MACD line above zero, though the histogram suggests a potential slowdown.
What to Watch:
A move higher could target the upper channel boundary near 109.50–110.00, while a pullback may see support at the 50-day SMA near 105.69 or the channel's lower boundary.
RSI and MACD movements will be key to gauging whether the bullish momentum can persist or if a deeper retracement is likely.
The DXY remains in a bullish structure, with the ascending channel providing a clear technical framework for traders to monitor.
-MW

EURUSD short-term trading set-upThe EURUSD pair has been trading within a Channel Down since the September 25 High and remains on a bearish course below the 4H MA200 (red trend-line) since October 01. The 1D RSI is displaying a huge Bullish Divergence, being on Higher Lows against the Lower Lows of the Channel Down, so long-term a strong bullish break-out is expected.
On the short-term though, we can take advantage of this Lower Lows fractal that has been formed another 2 times on this pattern and rebounds towards the 4H MA200. You can short towards the RSI's Higher Lows trend-line, take the profit and switch to buying just before it touches it and then target 1.04200 (expected course of the 4H MA200).
-------------------------------------------------------------------------------
** Please LIKE 👍, FOLLOW ✅, SHARE 🙌 and COMMENT ✍ if you enjoy this idea! Also share your ideas and charts in the comments section below! This is best way to keep it relevant, support us, keep the content here free and allow the idea to reach as many people as possible. **
-------------------------------------------------------------------------------
💸💸💸💸💸💸
👇 👇 👇 👇 👇 👇

XAUUSD - Gold will welcome the holidays?!Gold is located between EMA200 and EMA50 in the 1-hour time frame and is trading in its short-term ascending channel. In case of a valid failure of the bottom of the channel, we can see the continuation of gold's decline and seeing the demand zone. Within the demand range of demand, we can buy with a suitable risk reward. If the upward movement continues, gold can be sold in the supply zone.
Without a doubt, 2024 has been the year of the US dollar. While high inflation continued to spread across Europe and other parts of the world in 2023, the Federal Reserve reported progress in controlling price growth. Similar to last year, other central banks have been more proactive in reducing interest rates, but the slow pace of inflation containment has delayed the Federal Reserve’s rate-cutting process.
Federal Reserve officials now anticipate only two 0.25% interest rate cuts in 2025. As a result, it is expected that the Federal Reserve will maintain a tighter monetary stance compared to other major central banks, except for the Bank of Japan, which is currently increasing its interest rates.
This decision follows previous rate cuts implemented earlier this year, including a 50-basis-point reduction in September and a 25-basis-point cut in November. Overall, these measures have resulted in a full 1% decrease in the benchmark rate, signaling a shift in the Federal Reserve’s approach to the current economic environment.
By lowering interest rates, the Federal Reserve aims to stimulate consumption while continuing to monitor inflationary pressures. Although these pressures have generally subsided, they have slightly risen in recent months. Nonetheless, the decision to reduce rates could benefit borrowers by lowering consumer interest rates, making it more affordable to buy homes, secure personal loans, or borrow funds in other areas. However, the implications extend beyond lending.
Adjustments to the Federal Reserve’s interest rates could create a complex environment for investors, particularly those drawn to traditional safe-haven assets like gold. Historically, the relationship between interest rates and gold prices has been inversely proportional. Lower rates typically increase gold valuations, as the reduced cost of holding non-yielding assets like gold makes it more appealing, thereby driving up demand and prices.
However, it is crucial to understand that the impact of interest rate decisions on gold prices operates within a broader network of interconnected factors beyond monetary policy. For investors considering adding gold to their portfolios, understanding this broader context is essential.
In addition to Federal Reserve policies, one key driver of the gold market is central bank purchases, particularly by emerging economies seeking to diversify their reserves. These purchases have recently reached historic levels, providing substantial support for gold prices. Global trade tensions, supply chain disruptions, and evolving industrial demand—especially from technology and renewable energy sectors—also add layers of complexity to the gold market.
In the first quarter of this year, India’s central bank recorded a net purchase of 77 tons of gold, followed by Turkey’s central bank with 72 tons, increasing the share of gold in its foreign reserves to 34%. Poland, with a purchase of 69 tons, was the third-largest buyer, while China, traditionally the largest gold buyer in recent years, ranked fourth with less than 30 tons.
BlackRock, the world’s largest asset manager, has predicted in its 2025 global outlook report that the coming year will be marked by increased geopolitical fragmentation and the formation of rival economic and political blocs. These developments are likely to accelerate the trend of de-dollarization and bolster gold purchases.
Moreover, the strength of the US dollar continues to play a crucial role in gold pricing. However, factors such as relative economic growth rates, trade balances, and international capital flows can overshadow this influence.For instance, the dollar may strengthen if major economies face significant challenges or if investors seek safe-haven currencies during market turmoil—even in a rate-cut environment.
Inflation expectations also strongly influence the gold market. While moderate inflation typically supports gold as a store of value, extreme inflation may shift investment patterns, potentially reducing demand if other assets offer higher returns. Changes in consumer demand, particularly from major gold-buying countries, can also impact prices. Additionally, seasonal trends, such as increased gold purchases during festivals or weddings in these countries, may contribute to price fluctuations.
Finally, US President Joe Biden signed a budget bill that will fund the government until mid-March next year, preventing a year-end shutdown. This legislation, recently approved by both the House of Representatives and the Senate, ensures government operations continue until the beginning of Donald Trump’s presidency next year.

gold on neutral buy or sell#XAUUSD price have been declining between 2622-2626, now we wait for breakout above 2632 for bullish to occur above 2650 which have a retracment back 2632 for bullish formation but below 2624 have bearish range await, the candlestick isn't strong to make further move. Buy stop 2632, SL 2624 which is sell stop also, TP 2650 for sell also.
