US Dollar Index Targets Below 94.65 As Wave 3 UnfoldsUS Dollar Index had dropped between 103.00 and 98.29 subdividing into 5 waves, hence labelled as Wave 1. The subsequent rally was corrective and found resistance around fibonacci 50% retracement (100.93), potential Wave 2. Sine then, Wave 3 could be underway towards 94.65 and lower. A drop below 98.90 would confirm the above. Alternately, Wave 2 could be still unfolding and might test fibonacci 0.618 retracement at 101.20, before terminating. Either ways US Dollar Index remain bearish as long as prices stay below 103.00 resistance.
Strategy:
Short against 103.00, targeting 94.65
Legal Disclaimer: This article is not investment advice. The data provided is for marketing material purposes and is not intended to confuse nor guide our clients on trading decisions. Any investment activity performed is perceived to be a self-directed decision. Exclusive Markets is not liable for losses that may occur because of a decision made after reading the information published on our research page or any other media.
Risk Warning: Trading the capital markets is risky therefore further knowledge and experience may be required. Apply appropriate risk and money management always and ensure the implementation of safe leverage.
Usdollarforecast


USDOLLAR Ascending inverse scallopAscending inverse scallop, looks like the short term drop has already begun, looking for bullish continuation.
Dollar Index- what's next?Following FOMC yesterday, DXY has broken the trend line channel support and now is trading at 97.15 which coincides with horizontal support.
We believe that we assist to a chance of trend and we can expect the index to fall to the next support at 96.00

DXY - 18/11/19Quick Update on the DXY, we're seeing this downtrending trendline, price has been respecting. I'm looking for a loss of strength in the USD over this week based on technicals. HOWEVER, we have a lot of high impact news regarding the US Dollar this week therefore I would trade with caution. Be strict with risk management on USD pairs.
If the dollar does in fact lose strength, USDXXX pairs will sell and XXXUSD pairs will buy.
The dollar is relatively strong as of right now. But price is on a solid downtrend.

DXY - 8/9/19My forecast for the dollar since last week. Looking for price to head down to that trendline, based on technical analysis, we have the channel, resistance at the point it sold from. We have had strong sell momentum since last week and based on all the bearish news, I expect it to drop further.

USDJPY formed bullish shark | A good long opportunityAfter successful formation of bullish Shark pattern the price line of US Dollar / Japanese Forex pair Yen has formed another bullish shark pattern.
Even though the price action has hit the sell zone upto 0.382 fibonacci but all indicators are still turning bullish therefore I am expecting more profit.
MACD is turning bullish
Stochastic is oversold and has given bull cross
Volume profile is showing less interest of traders at this area.
I have used Fibonacci sequence to set the targets:
Buy between: 105.502 to 103.691
Sell between: 107.035 to 110.572
Regards,
Atif Akbar (moon333)


US DOLLAR INDEX DXY - LET THE REVERSAL BEGINDollar Index - Weekly chart - After patiently waiting ( for monthss!!) for dollar index to rally into the weekly supply zone for a reversal, we have now reached this point and can anticipate a share reversal/decline for dollar in the coming weeks to months.

DXY - 30/7/19The dollar index hasn't been past this 98 level since May 2017. With strong buying momentum recently and major news this week, will the dollar finally break above? This area is a key resistance level. Overall, I'm bearish based on Technical Analysis. Fundamentals, according to news websites, suggest a bearish forecast as well.


DXY - 1/6/19Price has been on an uptrend since January 2019 giving us a series of Higher Highs and Higher Lows, shown clearly on the Daily TimeFrame. Price has also been rejecting to push higher than 98.00 since April 2019. I have highlighted the MACD divergence seen on the Daily and 4HR indicating the possibility of a bearish run.
Moving to the 1HR, price is sitting on the trend-line and a strong support area.
The above is based solely on Technical Analysis.
The strong bearish candle resulted from a news release on Friday, I would wait to see what happens and how price moves and reacts at market open.
However, my overall outlook on the DXY is bearish.

USD/CHF Break 1.000usd/chf will break 1.00 after break and retest of phase line...
see previous post for analysis and trade config...

DXY / U.S Dollar - Weekly OutlookHello traders, today we take a look @ the DXY
We are nearing an important Monthly S/R level in which we can expect the next trend to take place for the U.S Dollar.
A rejection and we can expect the DXY to target the Bottom of our Monthly Range. We will be looking for Bearish Engulfings via our Lower TFs.
A solid High TF close above 97.25 and we can expect the U.S Dollar to rally to new highs of 105.00~ and test our Monthly S/R level
Twitter - Signals - Telegram

US DOLLAR CURRENCY INDEX: ABC Correction In Progress?Find Winning Trades In Seconds >> efcindicator.com (Special Discount)
After a double top forming a bulltrap, It looks like we started an ABC correction.

Dollar more Bearish Expected - Sell on RallyThe Dollar Index broke the important level and made a new low today, but rallied due to the weakness of GBP and some other things.
Now it's rallying to that broken support level, time to sell it now!

USD Downside trend projection.Firstly fundamentals: Trumps specific policy, his trade wars, etc. makes me think, that US Dollar index is under big pressure, and it might affect with a bearish movement for that currency.
In the other hand, if we look what happens on the chart, we can see really strong supply zone, that has been respected by DXY. In my opinion USD is going south, with the targets that I have marked.
Taking everything into the conclusion, my long term view of DXY is bearish, and seeing it on the 88 level is just matter of time.

US Dollar - DXY - Breakdown Expected US Dollar - Daily chart
Price is currently making a Rising Wedge pattern.
We are expecting to see a drop towards the support level before an upside move. A potential Inverse H&S is possible.

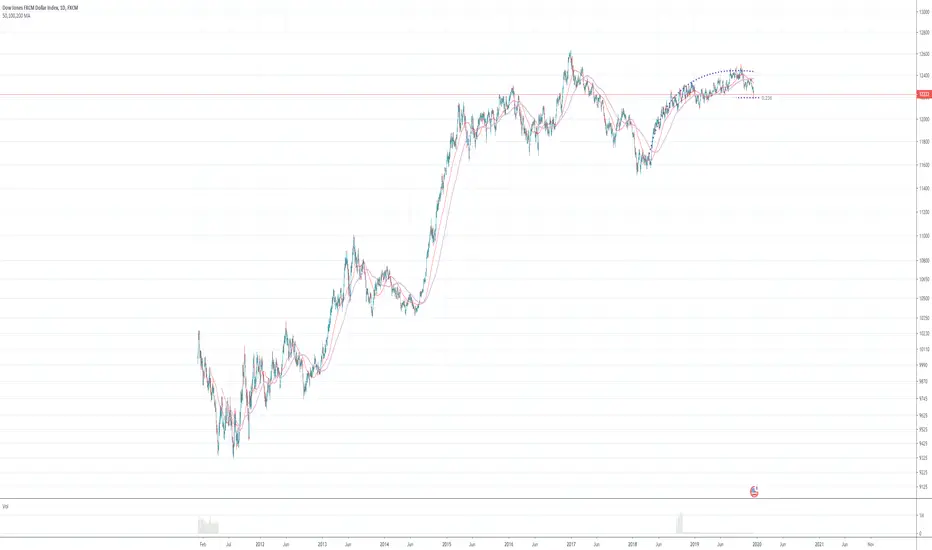
DXY Technical AnalysisDXY moves between the bearish channel, Now it's on strong support price @ 92.34.
If it breakout the strong support and goes below 92.29 means it will bearish. Otherwise it will bullish until price 92.42


US Dollar Index (15M TF)I believe the dollar is still starting the week strong following last week. The US Dollar sustained inflation as well last week which allows hopes for the Fed to raise the interest rates four times this year to allow the bulls to run.

USDOLLAR Short 450 Pips OpportunityUSDDOLLAR is in a short trend from the looks of the Weekly and Monthly chart. If the current support level is broken, then we can expect it to go down 400 pips+ below until next support.
Depending on the price where you sell, do attention to your SL.
This is a good move to keep an eye on.

US Dollar Index Bullish Trend OpportunityIt seems DXY index reached it's support @ 89.43. Now there is a good opportunity to bullish until price @ 90.46
