Bullish Liquidity Grab on USD/SGD ExpectedTechnical Analysis
Monthly Chart:
On the monthly chart, USD/SGD has shown a recovery after testing significant support zones, indicating that buyers stepped in to defend these levels. However, the recent upward movement appears overextended, suggesting a potential slowdown or correction in the near term. This aligns with broader market dynamics and the technical exhaustion seen after extended bullish runs.
Daily Chart:
The daily chart offers more clarity on current price action:
Double High Formation: Two equal highs have formed on the chart, a classic indication of liquidity resting above these levels. From a price behavior perspective, this suggests that the market is likely to push upward to liquidate these equal highs before considering a significant move lower.
Consolidation Zone: The price is currently consolidating, which often precedes a breakout. This consolidation reinforces the likelihood of a push higher to clear liquidity, especially when aligned with the broader USD dynamics.
Fundamental Analysis
U.S. Dollar Factors Impacting USD/SGD:
The strength of the U.S. Dollar (DXY) plays a crucial role in USD/SGD movements. Here's how recent developments affect the pair:
Liquidity Grab in DXY: The DXY recently breached its key level of 107.348 and is now showing bearish tendencies. However, short-term bullish corrections could provide temporary support for USD/SGD, aligning with the potential liquidity grab above the equal highs on the daily chart.
Interest Rate Outlook:
The Federal Reserve has shown hesitancy toward further rate cuts due to inflation concerns.
Robust labor market conditions, especially during the holiday season, reduce the immediate likelihood of aggressive rate cuts.
However, rising unemployment or stable-to-declining inflation could shift this outlook, leading to USD weakness and potential corrections in USD/SGD.
Upcoming Economic Catalysts:
Nonfarm Payrolls (NFP) and unemployment data later this week are expected to influence USD sentiment significantly. If unemployment increases as expected, it could lead to a broader decline in the U.S. Dollar, impacting USD/SGD.
Summary and Outlook
Technical Expectations:
Short-Term: USD/SGD is likely to push higher to liquidate the equal highs on the daily chart, given the consolidation and market behavior around these liquidity zones.
Post-Liquidity Grab: After clearing the highs, a correction is probable, particularly if the broader U.S. Dollar weakens. This correction could take the pair back toward key support levels, depending on fundamental triggers.
Key Factors to Monitor:
DXY price action, particularly around its short-term support zones.
NFP and unemployment data for clues on the U.S. labor market and inflation trends.
Any changes in Federal Reserve policy outlook or macroeconomic developments in Singapore.
Price Outlook:
In the short term, USD/SGD may target the equal highs as a liquidity zone.
In the medium term, the pair could correct lower following the liquidity grab, aligning with overextended technical patterns and potential USD weakness driven by fundamental factors.
By aligning technical insights with the fundamental outlook for the U.S. Dollar, traders can anticipate near-term bullish moves in USD/SGD, followed by a potential correction.
Usdsgdsignals

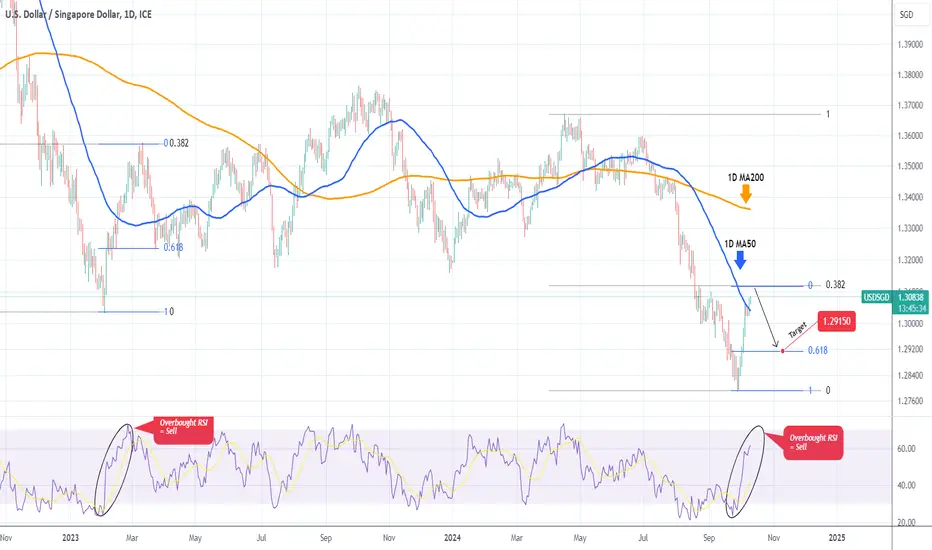
USDSGD Time to sell this rally.The USDSGD pair has been rebounding non-stop since the September 27 bottom and yesterday broke above its 1D MA50 (blue trend-line) for the first time in more than 3 months (since July 04). This confirmed that the correction since July is over but with the 1D RSI above 60.00 and heading towards the overbought barrier (70.00), we expect a rejection there.
In fact, there was a similar fractal that was rejected on March 10 2023, on the correction's 0.382 Fibonacci retracement level a little after the 1D RSI turned overbought. This resulted into a test of the 0.618 Fib of the rebound Leg.
As a result, we are expecting a rejection on the 0.382 Fib or when the 1D RSI gets overbought above 70.00 and our Target is the 0.618 Fib at 1.29150.
-------------------------------------------------------------------------------
** Please LIKE 👍, FOLLOW ✅, SHARE 🙌 and COMMENT ✍ if you enjoy this idea! Also share your ideas and charts in the comments section below! This is best way to keep it relevant, support us, keep the content here free and allow the idea to reach as many people as possible. **
-------------------------------------------------------------------------------
💸💸💸💸💸💸
👇 👇 👇 👇 👇 👇
USDSGD Buy signal at the bottom of a Channel Down.The USDSGD pair has been trading within a Channel Down pattern since the April 16 2024 High and today almost touched its bottom (Lower Lows trend-line). That is a technical short-term buy opportunity towards its top (Lower Highs trend-line).
The previous Bullish Leg of the pattern registered a +1.31% rise. Our Target is slightly lower than a new potential rise of this magnitude at 1.35000.
-------------------------------------------------------------------------------
** Please LIKE 👍, FOLLOW ✅, SHARE 🙌 and COMMENT ✍ if you enjoy this idea! Also share your ideas and charts in the comments section below! This is best way to keep it relevant, support us, keep the content here free and allow the idea to reach as many people as possible. **
-------------------------------------------------------------------------------
💸💸💸💸💸💸
👇 👇 👇 👇 👇 👇

USDSGD Bullish unless this Support breaks.The USDSGD pair is on the 1D MA50 (blue trend-line) currently but within conflicting Channels. The long-term one is a Channel Up that hasn't yet been invalidated, the medium term one a Channel Down and the shortest term a Channel Up.
As long as Support 1 (1.34225) holds, we will go with the short-term Channel Up and stay bullish, targeting 1.37250, which will be a Lower High on the medium-term Channel Down. If on the other hand, Support 1 breaks, we will take the loss and go short instead, targeting 1.32725 (Support 2).
-------------------------------------------------------------------------------
** Please LIKE 👍, FOLLOW ✅, SHARE 🙌 and COMMENT ✍ if you enjoy this idea! Also share your ideas and charts in the comments section below! This is best way to keep it relevant, support us, keep the content here free and allow the idea to reach as many people as possible. **
-------------------------------------------------------------------------------
💸💸💸💸💸💸
👇 👇 👇 👇 👇 👇

USDSGD Still a buy but not for long.The USDSGD pair has been trading within a Channel Up pattern (blue) since the February 02 2023 Low but on December 28 2023 it posted a Lower Low, so we have to consider the possibility of an emerging (dotted) Channel Down.
As a result, the trend remains bullish but technically we should be careful and only target the top of Channel Down at 1.37350 (symmetrical Bullish Leg at +4.49%).
-------------------------------------------------------------------------------
** Please LIKE 👍, FOLLOW ✅, SHARE 🙌 and COMMENT ✍ if you enjoy this idea! Also share your ideas and charts in the comments section below! This is best way to keep it relevant, support us, keep the content here free and allow the idea to reach as many people as possible. **
-------------------------------------------------------------------------------
💸💸💸💸💸💸
👇 👇 👇 👇 👇 👇

USDSGD Strong bullish signal above the 1D MA200It's been again a long time since we traded the USDSGD pair (October 03 2023, see chart below) but it did manage to give us a low risk sell opportunity:
The price hit today the 1D MA200 (orange trend-line) for the first time in exactly 2 months (since November 17). That is a major pressure level as it is also exactly where Resistance 1 (1.34550) is. The long-term pattern is a Channel Up and technically this is the 3rd Bullish Leg. The previous two rose by more than +4.00% but the 2nd made a temporary pause at +3.44%.
That is our 1D MA200 break-out target and it interestingly falls almost exactly on Resistance 2. We are targeting 1.36100 but if the 1D MACD forms a Bearish Cross earlier, we will the the profit on that market price.
-------------------------------------------------------------------------------
** Please LIKE 👍, FOLLOW ✅, SHARE 🙌 and COMMENT ✍ if you enjoy this idea! Also share your ideas and charts in the comments section below! This is best way to keep it relevant, support us, keep the content here free and allow the idea to reach as many people as possible. **
-------------------------------------------------------------------------------
💸💸💸💸💸💸
👇 👇 👇 👇 👇 👇

USDSGD ____ INCOMING BULLISH RALLYHello Guys,
As I had previously published, the dollar index seems to be setting up for a bullish rally (analysis inserted below) and USDSGD which is correlated with the dollar index is aligning accordingly.
You will also notice that the price has buy-side liquidity to hunt. I have set an alert to know when price trades into the daily order block from which I will be looking out for a CHOCH on the 1-hour timeframe to go long.
Also, USDCHF is aligning for this long (analysis inserted below)
Follow me for more updates.
US DOLLAR INDEX ANALYSIS
USDCHF ANALYSIS
Cheers,
Jabari

USDSGD ____ INCOMING BULLISH MOVEHey Guys,
USDSGD hunted sell-side liquidity last week Thursday & Friday and also traded into the weekly FVG. From the weekly FVG, I speculate that the price will rally to hunt the buy-side liquidity and head into the daily FVG.
However, I expect that price will try again to go lower at the beginning of the week and start the bullish rally.
Also, as a confluence, the dollar index is also getting ready for the bullish rally (see below my analysis on DXY)
Follow for more updates.
Feel free to DM me.
See my Dollar Index analysis
Other USD-related pairs
GBPUSD
NZDUSD
USDJPY
Cheers,
Jabari

USDSGD Triangle break-out. Buy signal.Last time we looked at the USDSGD pair (October 11 2022) we gave the best sell signal possible (see idea below) as the price entered the 6 year Resistance Zone:
This time we have a buy signal flashing as the price not only broke above the Triangle pattern on the 1D time-frame but also above the 1D MA50 (blue trend-line). As long as Support 1 holds, we are bullish targeting 1.35500. If Support 1 breaks (1.32050), we will book the loss and open a sell, targeting 1.30550.
-------------------------------------------------------------------------------
** Please LIKE 👍, FOLLOW ✅, SHARE 🙌 and COMMENT ✍ if you enjoy this idea! Also share your ideas and charts in the comments section below! **
-------------------------------------------------------------------------------
💸💸💸💸💸💸
👇 👇 👇 👇 👇 👇

USDSGD Possible drop to support levelUSDSGD Possible drop to support level.
Logic behind analysis :
1. Long term downtrend
2. Daily Bearish engulfer
3. 4H Head & shoulder on resistance with liquidity grab
Summary : A sell trade is high probable as per chart analysis.
Press the link button if you enjoy this analysis.

🟢 USDSGD - 4H (09.11.2022)🟢 USDSGD
TF: 4H
Side: Long
SL: $1.39610
Entry: $1.39858
TP 1: $1.40277
TP 2: $1.40690
TP 3: $1.41024
USD is gaining strength again so it's time to start buying it.

USDSGD Entered its 6 year Resistance Zone.The USDSGD pair has entered a Resistance Zone where it has made long-term tops and got rejected since January 2016. Even if the long-term pattern is a Channel Up, technically there isn't much room for further growth before a correction near the 0.786 Fibonacci retracement level at least.
It is interesting to see also that all rejections had the same aggressive sell-off behind them, reaching the middle of the Channel (0.5 Fib) in a matter of 2-3 months. Also check the 1W RSI. Strong rejections took place once it broke above the 70.000 overbought barrier. Right now we are above it.
-------------------------------------------------------------------------------
** Please LIKE 👍, SUBSCRIBE ✅, SHARE 🙌 and COMMENT ✍ if you enjoy this idea! Also share your ideas and charts in the comments section below! This is best way to keep it relevant, support me, keep the content here free and allow the idea to reach as many people as possible. **
-------------------------------------------------------------------------------
You may also TELL ME 🙋♀️🙋♂️ in the comments section which symbol you want me to analyze next and on which time-frame. The one with the most posts will be published tomorrow! 👏🎁
-------------------------------------------------------------------------------
👇 👇 👇 👇 👇 👇
💸💸💸💸💸💸
👇 👇 👇 👇 👇 👇

USDSGD pulling back. Two levels to buy.The USDSGD pair made a Double Top rejection two days ago and is currently on a strong bearish 1D candle. With the 1D RSI also rejected on a Double Top last since in September 29 2021, the next level to consider entering is just above the 1D MA50 (blue trend-line), which is where the June 16 Bull Flag found Support. A 1D candle close below the 1D MA50, should target the bottom of the long-term Channel, just above the 1D MA200 (orange trend-line), which is where the last two Higher Lows were formed on August 11 2022 and April 14 2022.
--------------------------------------------------------------------------------------------------------
** Please support this idea with your likes and comments, it is the best way to keep it relevant and support me. **
--------------------------------------------------------------------------------------------------------

USDSGB top-down analysisHello traders, this is the full breakdown of this pair. We will take this trade if all the conditions are satisfied as discussed in the analysis. Smash the like button if you find value in this analysis and drop a comment if you have any questions or let me know which pair to cover in my next analysis.

Currency pair analysis usdsgdIt is possible to reach the target by combining strategies 1 and 2 myself

USDSGD Has Broken Above a Major Resistance
Welcome back Traders, Investors, and Community!
Hi Traders, USDSGD on H4 has broken above a major Resistance by several green candles. It might go down for a retest before goes up to hit TP1
⬆️Buy now or Buy at 1.3580
⭕️SL @1.3554
✅TP1 @ 1.3706
✅TP2 @ 1.3784
✅TP3 @ 1.3859
We will have more FREE forecasts in TradingView soon
❤️ Your Support is really appreciated!❤️
Have a Profitable Day

USD/SGD Bullish continuation signalHi Traders
USD/SGD (H4 Timeframe)
A high probability, entry to go LONG is forming @ 1.34787 after the market found support @ 1.34100. Only the downward break of 1.34100 would cancel this bullish scenario.
Trade details:
Entry: 1.34787
Stop loss: 1.34100
Take profit 1: 1.35855
Take profit 2: 1.36947
Take profit 3: 1.38727
Score: 10
Strategy: Bullish Wave - We2

USDSGD LongWhat I see here is quite clear we have nicely broken trend line and then cute pull back to our trend line. as we were waiting for 2nd pull back to broken point of trend line to open buy position, it has quite nice R:R 1:4.
Position Open
Good Luck Everyone

USDSGD - long biasedHi all traders,
I hope you have a good day with all the pips from fomc.
Now that fomc have settled, this is a trade analysis i have for you all on usdgsd.
Please take note of the levels i have informed in usdsgd and trade those levels carefully.
Please also help to like and share this video with your friends.
Follow me on tradingview for more video analysis.
Cheers and thank you as always!

USDSGD Break-out Sell SignalPattern: Channel Down on 1W.
Signal: Bearish if a full 1W candle closes below the 1W MA50.
Target: 1.35000 (just above the Symmetrical Support Zone).
** Please support this idea with your likes and comments, it is the best way to keep it relevant and support me. **
Most recent USDSGD signal:
