SIGNAL FOR TRADE IN 15m TIMEFRAMEBTCUSDT prepare for downward trend in 15m timeframe
its my opinion about this chart
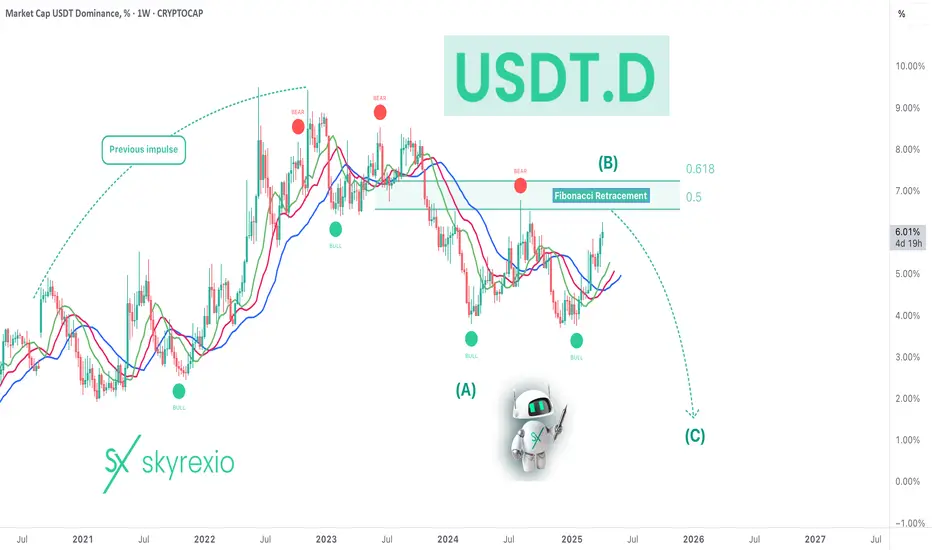
USDT-D

USDT.DSecond Point:
The USDT Dominance on the daily timeframe is showing the exact opposite behavior of Bitcoin. It has reached a supportive trendline which, for the past 3 months, has led to a reversal every time the index has touched it — pushing the market one level lower. And now, we're back at that critical zone again.
Will things be different this time?
This current touch appears to be a wave F, and perhaps we could even consider a potential wave G, which would imply one final leg up for USDT Dominance. However, there’s no certainty. There’s also the possibility that the trendline breaks, tether gets deployed, and the market becomes just a little — just a little — more pleasant.
We're literally on the edge right now, and this is where market pumps and dumps tend to occur — right in these key zones.
When will the situation become clear?
We have an important time zone coming up, and it’s likely that within the next couple of days, market makers will show their hand.
What do you think will happen?
Trendline breaks → Market pump
Trendline holds → Market dump ❤️

BTC — Bulls in Full Control | Next Stop $87K+?Bitcoin just smashed through the resistance around $84,300, and the bullish momentum is 🔥
Now we’re heading straight into the next key zone at $87,000–$88,765, which lines up perfectly with previous supply.
If bulls keep this pace — a clean push toward 87K looks very real in the coming sessions.
Entry: $84,500 – $85,500
TP: $86,800 – $87,000
SL: $83,500
More thoughts in my profile @93balaclava
Personally I trade on a platform that offers low fees and strong execution. DM me if you're interested.

A Quick Look at Tether DominanceTether Dominance has reached a strong support level.
If it breaks below its long-term trendline, that could signal a bullish move for the market.
However, if it holds above the trendline and breaks through its one-hour trendline to the upside, we might see further downside in the market.
Let’s see how it plays out

$INJ BULLISH PATTERNCRYPTOCAP:INJ showing a bullish Descending Broadening Wedge Pattern on the weekly.
Breakout could send it to $26, a potential 267% move!
👀📈

USDT.D(based on NEowave)check the long term of usdt dominance then you will understand this.
according to bow tie diametric(from 12H counting) we will see a new bull run and this is the last wave of that.

$BTC consequences of the Trump 90 days tariff pauseCan It Last? Is This a Trend Reversal?
Today, #Bitcoin surged over +8%, but surprisingly, #Tesla outperformed with a massive +20%—almost as much as $FARTCOIN! 🤯
History is being written, and we’ll remember this day… but is this truly the end of the consolidation phase?
What to Watch:
📈 Price Action: Bitcoin must break above the descending trendline (in green) and close a daily candle above it to flip resistance into support. The price to watch is $84.5k. Closing under 80k would invalidate this pump.
📊 RSI: Currently in mid-range—could swing either way.
🔁 MACD: Was turning bearish. We need a clear bullish crossover to confirm a trend continuation.
Conclusion:
With all the recent global tensions, many investors are feeling a sense of relief, especially as the trade war appears paused until September. This gives markets some breathing room to recover.
However, it’s not all clear skies yet:
Bitcoin is still stuck inside the descending bearish channel.
The recession risk hasn't gone away.
Trump may have been pressured to offer good news to avoid a full-blown market crash.
🕵️♂️ Let’s see how the weekly candle closes after this sharp move to the upside.

BREAKING: Tether at Decisive point! Rejection means Reversal!$Tether is approaching a key resistance level.
A rejection here could trigger a temporary recovery in the broader market.
This rejection may signal a potential trend reversal if confirmed on higher timeframes.
However, a break above this resistance would likely mean no altseason for the next few months possibly until the end of the year.
If you found this helpful, please hit that like button.
I’ll update this chart and share insights you can use in your trading decisions.
Also, drop your thoughts in the comments I’d love to hear what you think.
Thank you.
#Peace ✌️

USDT Dominance Confirms Bull Run ContinuationHello, Skyrexians!
Yesterday we shared the analysis when told you that the first confirmation of altcoin season has been received. For sure, Bitcoin dominance still has not confirmed reversal. Today we will show the third important chart. CRYPTOCAP:USDT.D also can help us to predict altseason.
Let's take a look at the weekly chart. Tether dominance has been in the large uptrend wave and now it's in the major correction. Wave A has been finished, wave B has the flat shape and it's also almost done. Fibonacci target area has been almost reached. We want to see the red dot on the Bullish/Bearish Reversal Bar Indicator as a huge confirmation, but it's not obligatory.
Best regards,
Skyrexio Team
___________________________________________________________
Please, boost this article and subscribe our page if you like analysis!
%6.49Think simple.
* What i share here is not an investment advice. Please do your own research before investing in any digital asset.
* Never take my personal opinions as investment advice, you may lose all your money.

Bitcoin will grow inside upward channel to resistance levelHello traders, I want share with you my opinion about Bitcoin. Previously, the price moved inside a triangle pattern, where it faced pressure from the resistance line while holding above the lower boundary. After the breakout from this formation, BTC began forming an upward channel, signaling a shift toward a bullish structure. Inside the channel, the price reacted multiple times to the support line, especially within the buyer zone between 79600–81000 points. Every touch of this zone triggered a rebound, indicating that buyers consistently protect it. Most recently, BTC bounced again from the 81000 support level, which aligns with the lower channel boundary. This rebound shows that bullish momentum is still present, and the structure remains intact. Now, the price is stabilizing and preparing for another upward move. I expect BTC to continue rising toward the 88500 resistance level, which is both the TP1 and the upper boundary of the current channel. This level also aligns with the lower edge of the seller zone, making it a natural target for the next wave. With the price holding above key support, the confirmed channel structure, and repeated bullish reactions from the lower zone, I remain bullish and anticipate a continued move upward toward 88500 points. Please share this idea with your friends and click Boost 🚀

BNB / USDT - Downfall AheadEvening friends,
Lotta hype on this coin right now, but I have to leave my thoughts here.
Its straight forward so I won't take long here, just read the notes and let me know what you think.
Trade thirsty!

I'm Bullish, but... NEAR / USDTHello again my brothers and sisters,
3 Drive Structure, do I need to say anything else?
I mean, look at this symmetrical triangle, when this blows, in the past, did it only touch base twice? I dont think so, 3 drive structure is needed for this and then we can be extremely bullish!
I'll be loading my boat down there.
If this helped you out, let me know!
Trade thirsty!
I'm Bullish, but... BTC / USDHello my friends,
At a minimum we're looking at 30 days inside this wedge before breaking out and testing the $96k range once again. Trust me, Bitcoin must form a bullish structure before doing anything interesting.
It could wick to FWB:73K but I'm thinking the heavy orders around $75k might hold and we range instead of dumping more.
Keep an eye on this wedge.
Trade thirsty, my friends!

Patience Friends...Howdy again,
As much as the 2.5% is coming we must have patience. It looks like it wants to tough the resistance trend lines once again before actually losing this support here. It also is a double bottom on the weekly which is pretty hard to break, but once it does, not only btc, but the whole market will explode.
Trade thirsty!
P.S: I'll put this as SHORT even though you should LONG usdt and SHORT the market.

I'm Bullish, but... MANA / USDTHi friends,
My latest post about MANA was bullish, and I did buy some of the blood we just had.
But this would be another coin that could drop 25% - 30% giving a great opportunity.
Keep an eye on BTC cause if it dumps, this will happen.
Trade thirsty!

$SOL Breakdown Alert🚨 CRYPTOCAP:SOL Breakdown Alert! 🚨
Solana has broken down from a rising wedge pattern and is now targeting the Fair Value Gap (FVG) zone between $30–$50.
A potential -73% drop from recent highs could be on the table.
If support fails here, things could get brutal.
Stay cautious.

WOW, I can see ALTSEASON of 2025 what about you?USDT.D can show me as a big sign of starting ALTSEASON. also if break the line.

ATOMUSDT Forming Inverse Head & Shoulders ATOMUSDT is currently forming a classic inverse head and shoulders pattern on the chart—a strong technical indicator often associated with trend reversals. This bullish pattern, combined with rising volume, suggests that a breakout may be on the horizon. The neckline is being tested, and a confirmed breakout could trigger a wave of buying interest as traders anticipate a significant upside move.
Volume is looking promising as buyers step in around key support zones, showing confidence in the potential of ATOM. With the broader market stabilizing and altcoins gaining momentum, ATOMUSDT could ride this wave for a projected gain of 50% to 60%+. The current technical setup aligns well with historical bullish reversals seen with this pattern.
Investors are increasingly paying attention to ATOM, not just for its price action but also for its utility in the Cosmos ecosystem. With strong fundamentals backing the project and a promising technical structure, this may be the beginning of a new uptrend. A successful breakout above resistance could bring renewed momentum and fresh highs in the short to medium term.
✅ Show your support by hitting the like button and
✅ Leaving a comment below! (What is You opinion about this Coin)
Your feedback and engagement keep me inspired to share more insightful market analysis with you!

TURBO long-term outlookAfter completing its first cycle TURBO seems to stabilize around the 0.0010-0.0020$ region which marks the last ATH from 2023. What's interesting here is that TURBO follows the DOGE coin pattern levels almost to a T, in speedrun mode. It is absolutely not the same structure but it respects the same trading ranges and shows a lot of similarities, which is quite remarkable.
Watch out for this yearly trendline in the TURBO chart and expect some volatility for the next months. Breaking under 0.0010$ could potentially confirm a longer downtrend if we don't see a big impulsive bounce to the upside in the near future.

USDT.D.the end of wave B and the last incoming pulse that will open the altseason and end it as part of C(c)

USDT.D - The dominance of real moneyThe dominance of the dollar over cryptocurrencies is a real indicator of the growth status of ETH!
The last wave of correction and decline is happening now! Pay attention to the accumulation zone before the Bitcoin price drops/inflates.
Money is being transferred to BTC=>ETH=>ALT=>USDT=>BTC and so on in a circle, during the active participation phase of DOU, money is being transferred to ETH and beyond, so be vigilant
In addition, I would like to draw your attention to the BTC.D indicator.

EOSUSDT Breakout with Strong Volume: Bullish Momentum BuildingEOSUSDT has recently completed a breakout, demonstrating strong bullish momentum with significant volume backing the move. The breakout from the previous resistance level indicates a potential trend reversal, and with the volume surge, it confirms that investors are actively participating in this rally. Market sentiment appears positive, and the pair is well-positioned to capitalize on this momentum.
With the current bullish outlook, EOSUSDT shows promising potential for gains ranging from 90% to 100% or more. The increasing interest from investors further supports the likelihood of continued upward movement. If the buying pressure sustains, we may witness a robust rally that could attract more attention from the trading community.
Technical analysis highlights that the successful breakout combined with consistent volume influx may serve as a solid foundation for future growth. Traders should keep an eye on key support and resistance levels to make the most of potential price surges. As the momentum builds, managing risk effectively and staying updated with market conditions will be crucial.
✅ Show your support by hitting the like button and
✅ Leaving a comment below! (What is You opinion about this Coin)
Your feedback and engagement keep me inspired to share more insightful market analysis with you!
