Called move after move for Bitcoin, what happens next?If you been lucky enough to work out my analysis and pull the trigger on the trade setups that played out over and over again, I commend you for your knowledge of how to read an analysis and then use it to make an informed decision.
If you caught the last analysis I mentioned about a bear trap spike below the blue line and as you can see it played out. You can see I have removed the green trendline on left chart as it is now done with and the green trendline on the right hand side chart is basically invalidated now.
We see on the left chart the orange trendline is respected with the candle closing above it. The white major trendline also held as major support. You can see the other trendlines still being used, especially on 4 hour timeframe.
So, what now?
We need to watch for the right hand side RSI to breakdown under the red trendline for BTC to get to 108k.
On the left chart the RSI needs to break back above trendline. In regards to the price action, we can see a massive buy up in the crash candle that was just made. Price could move up to 108k from here now there are trapped short traders below. This would put the right USDT.D chart at the blue trendline and as per previous analysis we know what happens if that then breaks below this line.
On the bearish side, if price loses the light green vwap line then expect another retest of the white trendline.
Smash the like button and good luck!
USDT-D

$USDT February Local Top Hit!well well well... look at that.
TA PERFECTION 💯
Should I start charging for my calls? 😂
I couldn't imagine anyone not following my account at this point 🧐
(see prior USDT chart for the original call).

Bitcoin can exit from triangle and continue to fall nextHello traders, I want share with you my opinion about Bitcoin. By observing the chart, we can see that the price started to grow inside the upward channel, where it at once rebounded from the resistance line of the channel and fell to the support line. Then BTC broke the support level and rose in a short time to the resistance line of the channel and then it started to decline. Bitcoin fell to the support level, which coincided with the buyer zone, thereby exiting from the channel and after it some time traded between 94250 level, it fell to 90850 points. Next, the price impulsed and continued to grow inside the upward triangle, breaking the support level again. Later it reached the even resistance level, which coincided with the seller zone. Soon, BTC broke the 104700 level, rose to the resistance line, and then fell back and continued to trades between the 104700 level. Later BTC broke this level and fell below, after which turned around and quickly rose to the resistance line of the triangle and then dropped to the support line, where at the moment continues to trades close. So, in my mind, I think that Bitcoin can move up and then exit from the triangle and continue to decline to the 94250 support level. For this case, I set my TP at this level. Please share this idea with your friends and click Boost 🚀

USDT Dominance is bouncing!#usdt #tether dominance has been defended the support zone very well above green line i drew on chart and now there' s chance that #usdtd may have a hard bounce. The invalidation: CRYPTOCAP:USDT dom. loses the green line with weekly closings.

Ethereum is more bullish than everBullish divergence on daily RSI, falling wedge support & the bullish daily candles make #ethereum supper bullish to me..

USDTDOMINANCE CHART UPDATE !The chart highlights USDT dominance (USDT.D), which is used to measure market sentiment and money flow into or out of stablecoins such as USDT
The chart shows a completed “head and shoulders” pattern, which is often considered bearish in technical analysis.
The neckline has been broken, indicating the possibility of further declines.
The price appears to be testing a descending triangle, which could indicate a continuation of the decline.
The green area below (possibly around 2.5%-3%) could act as a crucial support if dominance continues to decline.
The 50-day (red) and 200-day (green) moving averages are plotted.
Dominance is trading below both moving averages, which reinforces bearish momentum.
A breakdown of the current triangle could lead to further declines towards the marked support area.
If you found this analysis helpful, hit the Like button and share your thoughts or questions in the comments below. Your feedback matters!
Thanks for your support!
DYOR. NFA

Here's the Analysis of $JUPHere's the Analysis of LSE:JUP
#JUP is in a large consolidation range and Price has already nearly got it reacted from the major support zone of $0.65 - $0.69. Price is already at resistance and might dump a little, a flip-over of $1.14 will be a good buy towards the resistance area of $1.42 - $1.46.


Bitcoin will break support level and continue to declineHello traders, I want share with you my opinion about Bitcoin. By observing the chart, we can see that the price a few moments ago rebounded from the support line, which coincided with the support level with the buyer zone and rose to the resistance line. After this, BTC rebounded from this line and dropped back to the support line, breaking the 93400 level, and soon rebounded up, breaking this level one more time. Later BTC rose to the resistance line and then fell to 90850 points, after which made a strong impulse up, breaking the 93400 level with the resistance line too. Then price continued to move up inside Pennant, where it broke the 102700 current support level, made a retest, and then tried to grow more, but failed and made correction below the 102700 level. After this movement, BTC turned back and rose to 109600 points (new ATH) and then made a correction movement one more time. Price fell to the support line of the pennant and then in a short time rose to the resistance line and recently it fell and exited from the pennant. In my opinion, the price can fall to the current support level, break it, and then continue to decline, therefore I set my TP at 99K points. Please share this idea with your friends and click Boost 🚀

HBAR is currently trading at equilibrium.Using my "grafting" trading technique, HBAR is currently trading exactly at the point of equilibrium. This could be either bullish or bearish, depending on the pattern, but it appears that HBAR could potentially drop down to #4 on the wave count, sweeping the lows before making a significant move to the upside.
Nothing in trading is guaranteed, but this pattern plays out in the same fashion frequently.
Good luck, and always use a stop loss!

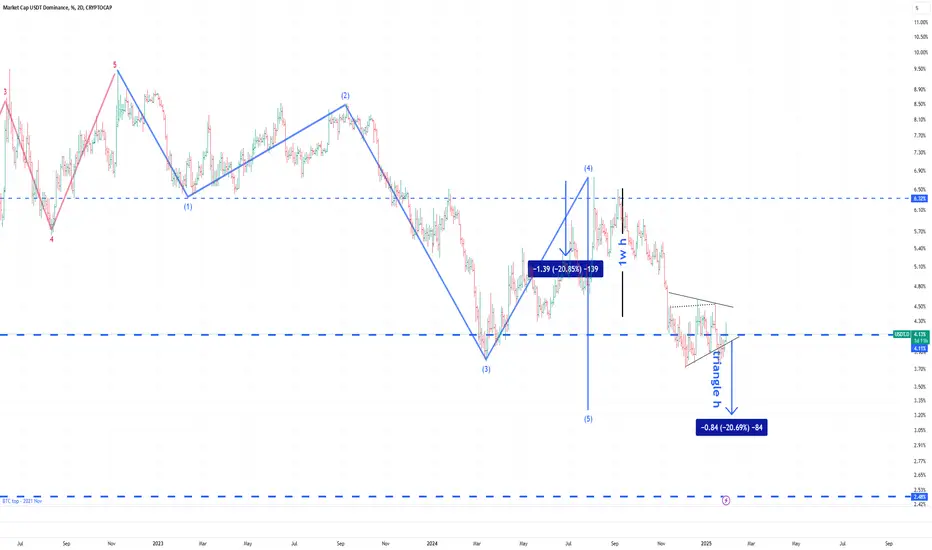
Key to upcoming price action pathHere are 2024 September - November USDt rally metrics:
66 days, 4.6 Trillions volume.
The first sub wave of micro degree is 1.39 points or 20.85% length.
The third sub wave of micro degree is 2.32 points or 35.7%. Which led to +89% at BTC, from 52k to 99k.
The triangle in fourth position has 0.75 points - 16.77% min basement or 0.97 - 20.69% max height. Triangles usually precede the last wave in the direction of the main trend. The terminal point for this triangle may reach 3.15% dominance and last in approximately the next 80 days.
The dominance of USDt on RSI 2D TF signals a downward divergence.
I think the signal line could reach ~22% before meeting the support trend line and reversing. It is -18% from the current point.
These values coincide with trend lines on Bitcoin, about 155k, or +55% from the current point.
Dodgecoin in percentage terms does move about 2x further.
This is a third confirmation proving upcoming rise in all crypto assets.
keep in mind that there is always place for an alternative waves count, but i bet that the analysis results worth millions!
So, wish you safe trading, fat profits and see you again :)
NO. 1 IS BITCOIN (STILL) BITCOIN-ALTCOINS-MEMECOINS THIS IS PLANDescending Trading Channel IS IN PROGRESS.
Bitcoin is currently trading within a descending channel, characterized by lower highs and lower lows.
The resistance line at the top of the channel is acting as a barrier to upward momentum.
The support line at the bottom of the channel provides a temporary floor for price movement.
Current Price Action:
The price is near the channel's lower support, indicating a critical decision zone for traders.
The presence of high volume at support suggests potential buying interest.
Indicators:
VMC Cipher B Divergences: Shows momentum divergence, signaling a potential reversal near the current level.
RSI (14): Reading of 27.94 indicates oversold conditions, suggesting a possible bounce.
Stochastic Oscillator (14,3,1): Extremely low (17.32), aligning with the RSI to indicate oversold conditions.
ArTY Money Flow Index (MFI): Neutral, showing neither significant inflow nor outflow of capital.
Key Levels:
Support: $98,282 (current zone within the channel support).
Resistance: $107,153 (aligned with the channel's resistance and previous consolidation).
Breakout Zone: A break above $107,153 could signal bullish momentum toward higher resistance zones ($112,000–$120,000).
Breakdown Risk: A breakdown below $98,000 may trigger bearish continuation to the $90,000 support zone.
Trading Plan
Entry Strategy
Long Position:
Enter near the support zone ($98,000–$99,000) with tight stop-loss at $97,000.
Confirm reversal with bullish candlestick patterns or volume breakout above $100,000.
Short Position:
If the price breaks below $98,000 with strong volume, consider shorting with a target of $92,000.
Take-Profit Levels:
For long trades, scale out profits at:
$105,000 (minor resistance).
$107,150 (channel resistance and key breakout level).
$112,000 (next major resistance).
Stop-Loss Placement:
Place stops 1–2% below the support level ($97,000 for long trades, $99,000 for short trades).
Risk-Reward Ratio:
Aim for a minimum risk-reward ratio of 1:3 (risk $1,000 to make $3,000).
Trade Management:
Monitor volume closely; rising volume during upward movement strengthens bullish conviction.
Use trailing stops to secure profits if the price moves favorably.
Breakout Trading:
If Bitcoin closes above $107,153 with strong momentum, consider entering a breakout trade targeting $112,000 and $120,000.
Contingency Plan:
Stay out if the price consolidates without clear direction near the current levels.
Avoid over-leveraging and stick to predefined risk parameters.
Bitcoin is at a pivotal moment within a descending channel. The oversold indicators and support proximity suggest a high-probability bounce, but traders must remain cautious of breakdown risks. The trading plan emphasizes disciplined risk management and capitalizes on both breakout and breakdown scenarios.

KASPA IS THE FIRST CRYPTO TO SOLVE THE BLOCKCHAIN TRILEMMA!Pattern: Symmetrical Triangle
Formation: The chart shows a symmetrical triangle pattern forming on the weekly timeframe. This pattern typically indicates price consolidation and suggests that a breakout (up or down) is imminent.
Support and Resistance:
Support: Defined by the ascending green trendline.
Resistance: Defined by the descending red trendline.
Prognosis:
Prognosis 1: A bearish breakout (less likely).
Prognosis 2: A bullish breakout (more likely).
Indicators
Volume:
Volume is declining during the formation of the triangle, confirming the pattern’s validity. A volume surge is expected during a breakout.
RSI (Relative Strength Index):
Current RSI value is 44.55, indicating neutral momentum but leaning towards an oversold condition.
Stochastic Oscillator:
The stochastic is in the lower range (23.19), suggesting potential upward momentum soon.
Money Flow Index (MFI):
The MFI is showing a slight uptick, signaling that money inflows may be returning.
Market Cipher B:
Momentum is gradually increasing, with signs of bullish divergence.
Key Levels
Resistance:
$0.24522 (intermediate target).
$0.34669 (major target post-breakout).
Support:
$0.10 (triangle base and psychological level).
Spot Trading Plan
Entry Strategy
Breakout Confirmation:
Buy above $0.145 on a confirmed breakout from the triangle (with a 4-hour or daily candle close above resistance).
Volume Surge:
Enter only if the breakout is accompanied by high trading volume.
Stop Loss:
Place a stop loss below the breakout level or $0.12 to limit downside risk.
Profit Targets
First Take Profit:
$0.24522 (approx. 68% above breakout level).
Sell 50% of the position.
Second Take Profit:
$0.34669 (approx. 138% above breakout level).
Sell the remaining position.
Risk Management:
Allocate no more than 5-10% of your portfolio to this trade.
Maintain a risk/reward ratio of 1:3.
Monitoring:
Keep an eye on overall market conditions (Bitcoin dominance and trends) as they heavily influence altcoin performance.
Reassess if the price deviates significantly from the expected triangle breakout.
Bearish Scenario:
If the price breaks below $0.12 with high volume, wait for the $0.10 level to evaluate for potential entry or exit further positions.

Bitcoin at strong supportbitcoin is at a very strong support and the bottom of it should be about 97.5k IMO.
Im expecting to hold it an continue to the upside

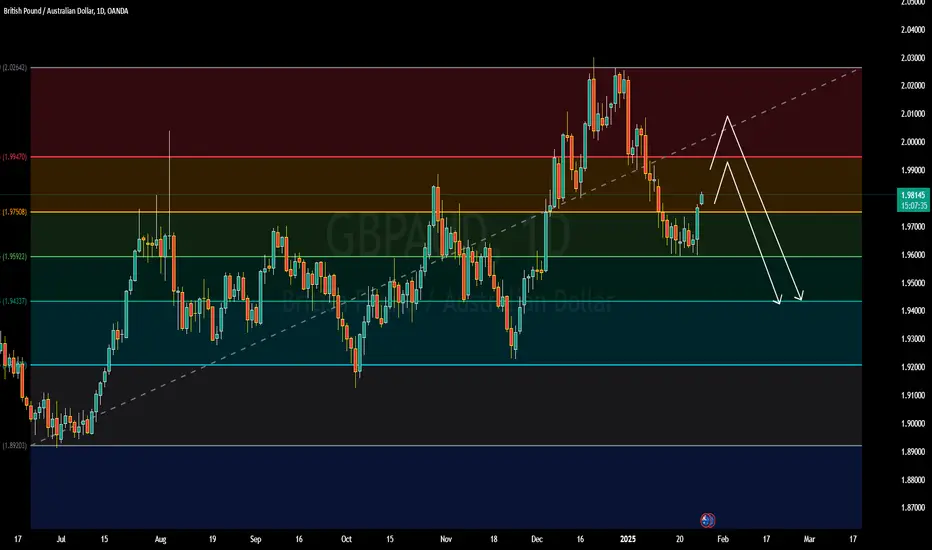
GBPAUD Retesting Resistance with a Potential for Price ReversalGBPAUD is currently trading at 1.981, with a target price set at 2.000, indicating a potential gain of over 200 pips. The market analysis is based on the support and resistance pattern, which suggests key price levels where the pair may react. Currently, the pair is in a retesting phase, meaning it is testing the resistance level after a previous breakout or price movement. This retesting phase helps confirm whether the resistance holds or breaks. If the resistance holds, it signals a potential reversal, leading to a price drop. Traders are advised to closely monitor this retesting period for confirmation before taking positions. A rejection at the resistance level could trigger a bearish move. Patience during this period is critical to avoid premature entries. This setup reflects a potential opportunity for experienced traders following technical analysis strategies.
FIL/USDT BullishIn my opinion, FIL is in a reaccumulation zone with the potential to reach the $11$ zone again. It is also possible to reject the first target around $7.10$. I am prepared for every outcome. I am only spot trading here. On the longer timeframe the zone 14-15$ is on the table, but that depends on the overall market conditions. Good Luck.

SWFTC/USDT PRICE PREDICTION 2025 $0,12 (Blockchain swift)SWFTC/USDT PRICE PREDICTION 2025
Means for long-term follow, and where the possibility is for this coin 2025
The best way of volume entering is in steps.
Depending on the 2025 protection for this coin, we expect this is a good chance this swift system for blockchain can gain over $0,12
We already know the real swift where billions of transactions going, this one means for the blockchain tech.
How more time the coin stays stable and holding levels, how better it is for the coming volume spike.
This update will stay a prediction, do always your study and manage the risk.
Expect nothing from the market, but more see the possibilities.

GRT LONG GRT seems to be heading toward the nPOC, considering that the USDT.D chart is also in a support zone, increasing the chances of GRT reaching 0.14. Interestingly, the stochastic RSI also attempted a positive cross but was rejected. Moreover, the price forms a descending triangle. These combined factors make me think there's a 60–70% chance we'll see GRT at a lower price soon.

BTC - Steady... steady... almost there!BTC in the short term is looking very much like a WXYXZ is forming. We should therefore see a low, which could temporarily breach the lower trend line. In fact, it'd make for a bullish signal if it did - so watch this carefully. If we see it ping back within the channel, then the formation will likely complete. Next thing we'll need to look for us the breakthrough of the upper trend line. This would then lead to higher higher and the completion of wave 5 of 1 which we have long been looking for. I'm not going to take any actions here until either trend line is decisively broken leading to a trend change. Looks good though, follow for more.

N3/USDT VOLUME INCREASEN3/USDT VOLUME INCREASE
There is good chance this coin can increase in the coming time new uptrend volme

$DAG/USDT AnalysisAfter breaking out of resistance and reaching the first target, the price is now pulling back to the new support level in green.
🎯 Potential Bouncing Entry:
First Target: Green line
Second Target: Blue line

!!! BITCOIN !!! - Bearish Diamond PatternHi,
Trump's first week is coming to an end and it looks like BTC gas is coming to an end
This is just an idea!
Be careful!

Bitcoin can turn back to the seller zone from the support lineHello traders, I want share with you my opinion about Bitcoin. By observing the chart, we can see that the price some days ago reached a resistance level, which coincided with the seller zone, and then dropped to the support level, which coincided with the buyer zone, and then started to trades in the range. In range, BTC at once rebounded from the support level and tried to grow, but failed and fell back. After this, the price bounced up and then turned around and declined to the buyer zone, after which started to grow. A short time later, Bitcoin rose to the top part of the range and then dropped to the buyer zone back, making a fake breakout of the support level, and then turning back to the range. Price sometimes traded near the 93200 level and later broke it, exiting from the range also and falling to 90800 points. Then BTC made a strong impulse up from this point and rose to almost resistance level, which coincided with the seller zone, after which corrected to the support line. Then BTC rebounded up from this line and rose to the seller zone, reaching a new ATH (109K), and soon fell back to the support line. But recently price bounced from this line and started to grow. So, for this case, I think that BTC can fall to the support line and then rebound up to the seller zone, breaking the resistance level. That's why I set my TP at 109500 points. Please share this idea with your friends and click Boost 🚀
