BTC brief move 1hMITIGATION
FVG
CHOCO
OVER BOUGHT
Please set stop loss always
There is always next opportunity
Confirmation check
3 RULES
Buy
Sell
Wait
FOLLOW YOUR TRAIND SYSTEM FOR LONG RUN
USDT-D

Compare BTC DOT ATOM It seems that Bitcoin has grown a lot compared to the currencies of Polkadat and Atom. Of course, it is not a correct comparison, but this shows that the way for Atom and Polkadat to move will be much smoother due to the developments that will happen in their networks.

USDT dominance chart update details: “death cross” has formed, where a short-term moving average (possibly the 50-day, shown in red) has crossed below a long-term moving average (possibly the 200-day, in green). This pattern typically suggests a bearish signal, indicating the potential for further declines in USDT dominance.
The overall direction appears downward, with USDT dominance testing lower support areas within a descending channel.
Key support levels are marked in green and gray. The current price level is slightly above the major support area around 5.0%. The chart suggests a possible continuation downward, with the next significant support area near 4.0%.
The large downward arrow indicates a bearish outlook for USDT dominance, suggesting potential further declines toward the 4.0% range if current support levels fail to hold.
This chart indicates that if USDT dominance continues to decline, this could correlate with a potential uptrend in the broader crypto market, as money flows from stablecoins into other assets.
Disclaimer: This analysis is for informational purposes and is not financial advice. Always stay updated with market movements and adjust your trading strategies as needed.
You can DM us for information on any other coin.
@Peter_CSAdmin

Bitcoin can make correction and then rise to 80K, and even moreHello traders, I want share with you my opinion about Bitcoin. Observing the chart, we can see how the price traded inside the buyer zone and soon broke the 67600 level, after which made a retest and continued to grow. In a short time, BTC rose to current support level, which coincided with the support area, and then started to decline inside the wedge. When the price fell to the 67600 support level, it entered the buyer zone, rebounded from the support line of the wedge, and started to grow. Firstly it corrected and then rebounded up to the current support level. Price broke this level, made a retest, and continued to grow to the resistance line of the wedge. Bitcoin some time traded near this line and later corrected to support line of the wedge pattern, after which it made an upward impulse. After this movement, the price exited from the wedge and now reached a new ATH (79800 points), after which made little correction. Now, it continues to rise, so, in my opinion, the price can make a correction movement and then start to grow. Also, I think it can reach new ATH, so, I set my target at 81500 points. Please share this idea with your friends and click Boost 🚀

DRIFT Triangle breask out soonMarket is greedy now.
Alt coin rotation is happening.
Hopefully this analysis helps you all.
Thank you,
#Make sure always set SL in case.

Market volatilityMarket volatility chart for general market direction slowing down.
Looks like Soon or later BTC will go sideway then will find out what is next direction.
Please keep an eye on volatility corresponding to market move.

Tether dominance 's LTF bounceA bullish divergence has been forming in #tether #usdt dominance chart in lower time frame. A bounce may be expected. LTF bounce in #usdtd = minor correction in #crypto

Tether Dominance is very bearish (1D)It seems that Tether Dominance has entered a large C wave.
Any return of Tether Dominance to supply is a buy opportunity in altcoins.
We expect Tether Dominance to be supported from the lower green box.
It is better to forget sell/short positions for a while!
For risk management, please don't forget stop loss and capital management
Comment if you have any questions
Thank You

Tether Dominance UPDATE (4H)Due to the US election and the heavy decline and rejection, Tether Dominance is expected to reach the lower support range.
Support and resistance ranges are marked on the chart
Closing a daily candle above the invalidation level will violate this analysis
For risk management, please don't forget stop loss and capital management
Comment if you have any questions
Thank You

SOLUSDT ANALYSIS UPDATE Sol seems to have completed a diametric correction as the g wave is dwarfed another bullish trend is expected to from.
by maintaining the green range it can move towards the targets .
Closing a daily candle below the invalidation level will voilate this analysis

ADA briefingBOS structure
Momentum candle with volume
Upward direction EMA
Good retracement level in 1D
Break out Trend line
Break out 1W S/R Flip zone
3 rules buy, sell ,wait
Follow your trading plan, scenario and wait for confirmation

Tether Dominance looks bullish#usdt #tether dominance index formed bullish divergence and this may move #usdtd up. A bullish #usdtdom is dangerous for #altcoins and #crypto

ETH 1HVolume - Decreasing
RSI - Divergence
Make sure set up Stop loss always
Yellow circle can be good indicator for trading
I am feeling one more high will happen then retracement.
Wait till confirmation found as your trading scenario.

FTMUSDT - Inverse Head & Shoulders - A Prime Long Opportunity?1.) Quick Overview
On the FTM/USDT 4-hour chart, an inverse Head & Shoulders pattern is shaping up, often hinting at a bullish reversal. If the pattern completes, this could offer an excellent long setup. The key level to watch is around the mOpen at $0.6555, where the price is expected to dip and complete the “right shoulder,” potentially setting the stage for a strong bounce.
2.) Deep Dive: Chart Analysis
Inverse Head & Shoulders Pattern:
- Left Shoulder: Formed near $0.6342.
- Head: A deeper low at $0.4744, marking the low point of the pattern.
- Right Shoulder (In Progress): Expected to complete around mOpen at $0.6555. If the price touches down here and holds, it could serve as an ideal long entry point.
Fibonacci Retracement:
- The 0.382 Fibonacci retracement level aligns near $0.6555, supporting the right shoulder as a potential bounce zone.
Key Levels to Watch:
- mOpen at $0.6555: This is our primary entry level, where the right shoulder could find support.
- VAL (Volume Area Low) at $0.6324: Another important support zone where the anchored VWAP also aligns, reinforcing this area as a significant base. If the price dips below mOpen, the VAL may act as a secondary support level.
- VAH (Volume Area High) at $0.7262: Our initial target if the inverse Head & Shoulders completes, with potential for further gains.
Volume Profile:
- Increased volume near the head formation suggests accumulation, supporting a bullish scenario if the right shoulder completes as expected.
3.) Trade Setup
- Entry: Look for a long entry around $0.6555.
- Stop Loss: Place the stop loss just below $0.58 to manage risk if the pattern fails.
- Target: Initial target at $0.7262 with room for more upside if the breakout continues.
- Risk-to-Reward: Favorable setup with solid support and a high-probability bounce area.
4.) Final Thoughts
- With the combination of the inverse Head & Shoulders, support at mOpen, Fibonacci, and anchored VWAP at the VAL, this FTM/USDT setup looks promising for a long position. Watch for confirmation around $0.6555 to see if the right shoulder completes.
Disclaimer
This analysis is for educational purposes and should not be taken as financial advice. Always do your own research and manage risk carefully!


Bitcoin can grow a little more and then make correctionHello traders, I want share with you my opinion about Bitcoin. Looking at the chart, we can see how the price some time ago declined from the buyer zone and entered the wedge. In this pattern, the price rebounded up to the resistance line from the support line, after which made a correction and then in a short time rose back, breaking the 67100 level. Then price exited from the wedge and continued to grow to a current support level, which coincided with the support area and when it reached this level, BTC broke it. Then it little grew and turned around, after which started to decline inside the downward channel, where it broke the 72100 level and fell until to the 67100 support level. After this movement, the price made a strong upward impulse to the current support level, exiting from the channel and soon breaking the 72100 level too. Next, the price made a retest and continued to move up, but a not long time ago it turned around and little declined. For this case, I think that BTC can grow a little more and then make correction to the 72100 current support level. That's why I set my TP at this level. Please share this idea with your friends and click Boost 🚀

Bitcoin can fall little more and then rebound up in channelHello traders, I want share with you my opinion about Bitcoin. By observing the chart, we can see that the price declined to the support level, and soon turned around and started to grow. But soon turned around again and dropped lower 68000 level, breaking it, and started to trades inside range. In the range, the price fell to the bottom part and then in a short time rose to the support level, and even made a fake breakout. After this, BTC fell back to the range, and even declined to bottom par again, where it made impulse up and rose higher than the 68000 level, breaking it, thereby exiting from the range too. Next, the price continued to grow and reached the 71000 level, which coincided with the seller zone and then broke this level. Then the price rose to 73600 points, after which started to decline inside the downward channel. In the channel, the price broke the resistance level and fell to the support line, after which tried to back up, but failed and continued to fall. Recently BTC reached a support level, after which rebounded and has now grown. So, in my opinion, the price can decline a little more and then rebound up to the resistance line of the channel. That's why I set my TP at 70400 points, which coincided with this line. Please share this idea with your friends and click Boost 🚀

USDT DOMINANCE UPDATE (4H)First of all you should know that "USDT Dominance" is always moving inverse of BTCUSDT .
When the Dominance Tether hits the red box, we expect a reject. This area seems to cause the cryptocurrency market to take a break for the continuation of the drop
Closing a daily candle above the invalidation level will violate this analysis
For risk management, please don't forget stop loss and capital management
Comment if you have any questions
Thank You

BTC IN UP MOVEMENT + TRADE PLANTrend Identification:
Descending Channel: Bitcoin is currently in a descending parallel channel after an uptrend, indicating a potential bullish continuation if it breaks out of this channel.
Previous Uptrend: The price came from an uptrend, and descending channels often serve as continuation patterns, suggesting a higher probability of an upward breakout.
Key Support and Resistance Levels:
Support Levels:
$68,556.87: Major support near the recent low in the channel.
$66,333.98: Secondary support zone that could act as a cushion in case of a downside move.
$64,591.15: Historical support level providing a safety net if the price dips further.
Resistance Levels:
$72,198.87: Immediate resistance that BTC needs to overcome for a continued uptrend.
$73,655.67: Key resistance area that, if broken, could trigger a strong bullish move.
Indicators Analysis:
RSI (Relative Strength Index): The RSI is close to the midpoint, indicating a neutral zone. However, an upward movement in RSI could signal increasing bullish momentum.
Stochastic RSI: Currently near the overbought zone. It indicates potential upward pressure, but caution is needed as it may signal short-term exhaustion.
Volume: Noticeable increase in volume around the support levels, indicating buying interest. Volume confirmation on breakout above the resistance line would strengthen the bullish case.
Moving Averages:
HMA (Hull Moving Average): Showing a slight upward trend, aligning with the potential breakout from the descending channel.
Trading Plan
Entry Strategy:
Aggressive Entry: Enter a long position upon the breakout of the descending channel, ideally with a confirmed volume increase above $72,198.87. This would signal a possible continuation of the previous uptrend.
Conservative Entry: Wait for a confirmed breakout and retest of the $72,198.87 level. If the price holds above this level after retesting, it indicates stronger bullish confirmation.
Stop Loss:
Place a stop loss slightly below $68,556.87 to limit downside risk. This area aligns with recent support, and a drop below it may indicate invalidation of the breakout pattern.
Take Profit Levels:
Primary Target: $73,655.67 (first resistance level). Partial profits can be taken here to lock in gains.
Secondary Target: $76,000, if Bitcoin gains strong momentum after breaking through the primary target. This level could be achieved in a continued bullish scenario.
Final Target: $80,000 as a psychological target, if there is sustained bullish momentum and no major resistance above.
Risk Management:
Position Size: Limit the position size to manage risk exposure, especially with the potential volatility in cryptocurrency markets.
Trailing Stop: Consider using a trailing stop after reaching the first target to lock in profits while allowing for potential upside.
Monitoring Indicators:
Volume: Continuously monitor the volume as the price approaches resistance zones. Higher-than-average volume would support the breakout, whereas weak volume could lead to a false breakout.
RSI and Stochastic: Keep an eye on these momentum indicators. If the RSI and Stochastic enter overbought territory and start to diverge, it could signal a potential reversal.
Timeframe:
This setup appears on a 4-hour chart, suggesting a medium-term trading perspective. Reassess positions if the breakout fails to materialize within the next few days.

Usdt.D last retrace before alt-partyMy key levels are 5.45 & 5.54.
After seeing the suitable candles and the setup I want, I take a long position on the Altcoins.

USDT DominanceUSDT.D is in a critical place. As long as it’s below 6.77%, a bearish drop is expected.
• Note:
When USDT.D goes down, theoretically the crypto market goes up.

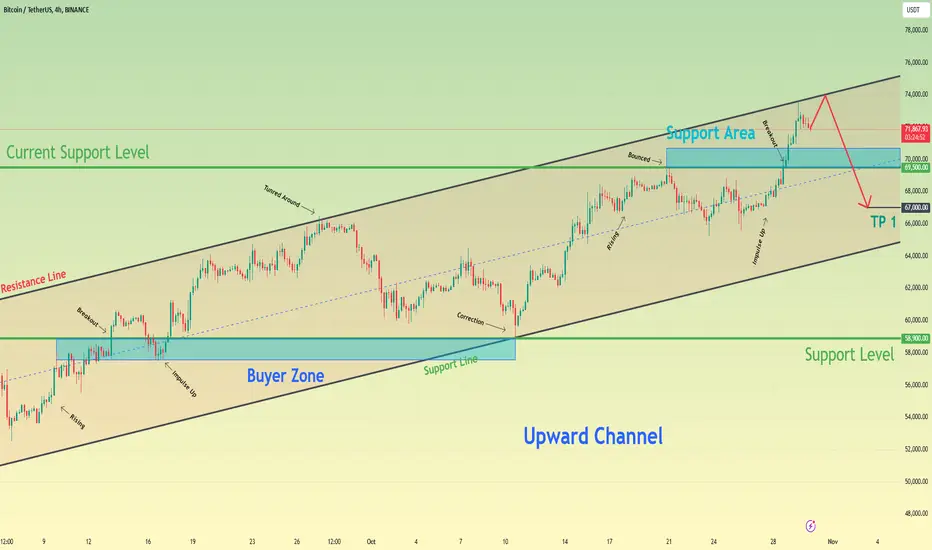
Bitcoin can reach resistance line of channel and start to fallHello traders, I want share with you my opinion about Bitcoin. Observing the chart, we can see how the price some days ago entered an upward channel, where at once it made little correction and then rose to a support level, which coincided with the buyer zone. Then BTC broke this level, after which made a correction to the buyer zone, and then BTC made an impulse up to the resistance line of the upward channel. After this movement, the price turned around from this line and then started to decline to the 58900 support level, which coincided with the support line of the channel. Later BTC rebounded and continued to move up inside the upward channel and some time later reached the current support level, which coincided with the support area. Price rebounded from this level and made a correction below, after which made an upward impulse to the resistance line of the channel, thereby breaking the 69500 level. But a not long time ago it started to decline, therefore I think that BTC can grow to the resistance line and then drop below a current support level, breaking it and continuing to decline. For this case, I set my TP at 67000 points. Please share this idea with your friends and click Boost 🚀
USDT MOON- Do you know what happens when something push too much ? it reverses and goes down.
- Sir Fibonacci said one day :
" When u launch a coin to the sky, it takes speed, then it stops, then it goes down more fast than it went up "
- if USDT grab more Dominance on Cryptos Markets, it would mean we are rolling back in the "Old Financial system" i hope everyone understand that.
- That's not gonna happens.
- i won't comments much on this analysis, but it speaks by itself. ( everything is in the graphic )
- i won't also speak about what happened recently to UST in Luna Ecosystem because it's sad for the peoples.
- Stay in BTC and pray TheKing.
Happy Tr4ding !
