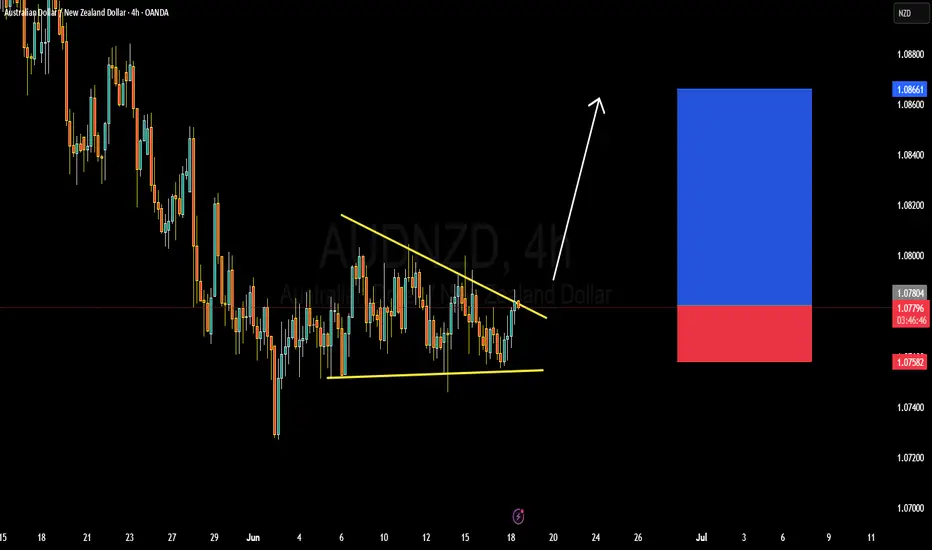
AUDNZD BULISH OR BEARISH DETAILED ANALYSISAUDNZD is currently trading around 1.078 and is on the verge of a classic falling wedge breakout, which is a bullish reversal pattern typically seen after a downtrend. Price action has been compressing within this wedge formation, suggesting an imminent breakout as market pressure builds. A decisive close above the descending trendline would be a powerful signal of bullish continuation, with a near-term upside target of 1.086. The structure has held multiple rejections at both resistance and support, highlighting strong accumulation behavior from institutional participants.
Fundamentally, the Australian dollar is gaining relative strength due to the Reserve Bank of Australia maintaining a hawkish tone, supported by persistent inflation and labor market resilience. In contrast, the Reserve Bank of New Zealand recently surprised the market by signaling a potential end to its hiking cycle, citing slower growth and inflation moderation. This divergence in monetary policy outlook is creating favorable conditions for AUDNZD bulls, particularly as global risk appetite improves and commodity-linked currencies gain traction.
Technically, this 4-hour chart pattern aligns perfectly with recent AUD strength across the board, particularly in pairs like AUDUSD and AUDJPY which have broken key resistance levels. The tight consolidation near the wedge’s upper boundary, coupled with bullish candlestick formations, suggests buyers are stepping in ahead of the breakout. With a clean invalidation below 1.075, the risk-reward ratio here is compelling, especially for momentum traders looking to catch an impulsive leg higher toward 1.086 and beyond.
This setup is high-conviction. AUDNZD is poised for a breakout that aligns with both technical and macro fundamentals. As a professional trader, I’m tracking this setup closely, and any confirmation candle above the trendline will trigger my entry. I expect bullish continuation in line with AUD’s broader strength and NZD’s underperformance.
USDT-D
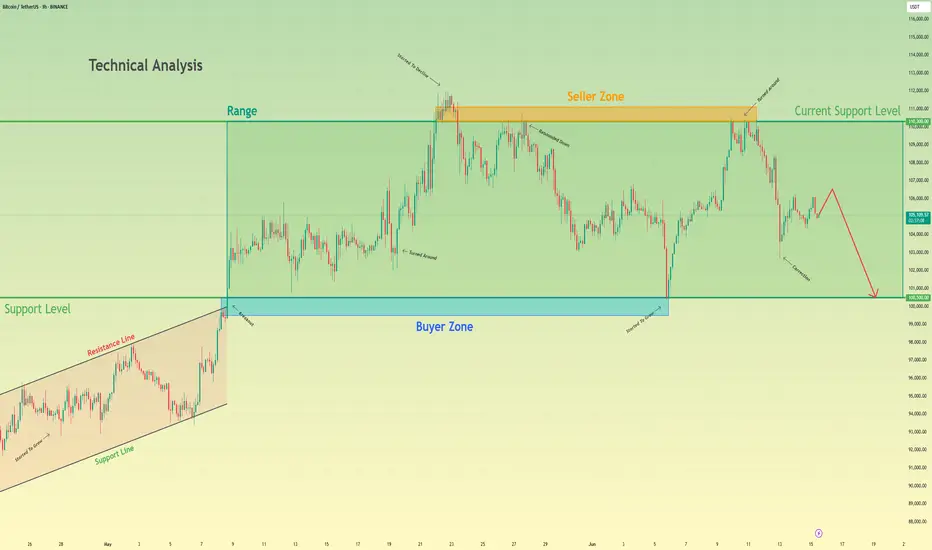
Bitcoin will make a small upward move and then continue to fallHello traders, I want share with you my opinion about Bitcoin. Earlier, the price was confidently growing inside an Upward Wedge, showing a series of higher highs and higher lows. This rising structure was supported by consistent momentum until BTC reached the seller zone between 110300 and 111100, where the growth slowed down and started to fade. From there, the price rejected this resistance and shifted into a Range, bounded by 100500 and 110300. BTC has been fluctuating inside this horizontal structure for some time, unable to break above the seller zone or below the buyer support. Now BTC is showing signs of weakness, forming a minor correction and struggling to reclaim previous highs. Given this structure and rejection from the seller zone, I expect BTC to make a small upward move and then start a decline toward the support level at 100500, which also coincides with the bottom of the range and acts as a strong psychological level. For this reason, I set my TP at 100500 points. Please share this idea with your friends and click Boost 🚀

$NMR Breakout 240% Upside Ahead$NMR/USDT has broken out of its long-term downtrend, bouncing from a key support zone around $7.20–$7.50.
The breakout signals a potential trend reversal. If this level holds, price could target $26.50, offering a 240% upside.
DYRO, NFA

$BTC Breakout Targets $125KCRYPTOCAP:BTC has broken out of a falling wedge and is holding strong above the $103K support zone.
Price is pushing upward toward the key resistance at $110K– $112K.
A breakout above this zone could trigger a move toward $125K.
DYRO, NFA

Tether Dominance matters!USDT #tether dominance is forming a bullish flag in lower time chart. If #usdtd manages to breakout, the next wave of correction will hit #bitcoin and #altcoins. If USDT.d loses %4.75 , that will be the invalidation.

$FHE 6h chart setup. The ASX:FHE 6h chart is showing a potential breakout setup.
Price has held strong at the $0.06963–$0.07132 support zone and is now testing the descending trendline resistance around $0.07600.
A breakout above this level could trigger a 54% rally toward $0.112.
Watch closely, a move above the trendline may signal a strong bullish reversal.
DYRO, NFA

$ZROUSDT Descending channel 4h chart.$ZRO/USDT is trading near the bottom of a descending channel on the 4H chart.
If support holds, a bounce toward the upper channel could offer a 26.96% upside.
Watch for confirmation, but a breakdown below the channel may signal further downside.
DYRO, NFA


$MOONPIG/USDT 6H chart The $MOONPIG/USDT 6H chart just broke above a key downtrend line, signaling a potential bullish reversal.
Price is currently at $0.02333 +15.21%.
If momentum continues, key resistance levels to watch are $0.02913, $0.04456, $0.06094, and $0.09345 539% target.
A breakout above $0.02913 could spark the next leg higher. Watch closely!
DYRO, NFA

$BTC/USDT 1D Quick Analysis$BTC/USDT 1D Quick Analysis
Bitcoin is under pressure after rejecting the $112K–$113K resistance zone. It’s now testing key demand at
$ 101,000–$ 104,000.
If bulls defend this zone, a short-term bounce toward $ 107,000–$ 109,000 is possible.
But if $101K breaks, BTC may correct deeper toward $91K.
The structure has turned bearish.
Watch this demand zone closely.
DYRO, NFA

$PNUT/USDT Breakout Trade Setup$PNUT / USDT - Breakout Trade Setup.
Entry: $0.2963 - $0.3002
Stop Loss: $0.2682
Targets: $0.3603 / $0.4305 / $0.4891
Breakout & retest of descending trendline
60 %+ upside potential
DYOR | NFA

$AUCTION Breakout +35% Target!$AUCTION has broken out of a descending triangle on the 4H chart and is now retesting the breakout zone around $10.89.
If this support holds, a move toward the $14.20 target +35.6% is likely.
Momentum looks bullish, watch for follow-through!
DYRO, NFA

$UNI Breakout: 400% Target AheadCRYPTOCAP:UNI just broke out from its long-term accumulation zone around $4.000–$4.801, gaining +30% this week.
The market structure has turned bullish, with the next major target near $19–$24, a potential 400% upside.
As long as UNI holds above the breakout zone, further gains look likely.
Watch this one closely.
DYOR, NFA.

$TRU 4H chartNYSE:TRU 4H chart has broken out of a descending trendline, showing bullish momentum.
Price is now approaching the key resistance zone around $0.041.
A successful breakout here could push the price toward the $0.0474 target +25%.
Watch for a possible retest of the breakout zone before continuation.
DYRO, NFA

$BTC Bulls BackCRYPTOCAP:BTC is breaking out of a descending channel after a healthy pullback from the $ 112,000–$ 114,000 resistance zone.
Strong demand at $ 102,000–$ 104,000 supported the bounce, with buyers now pushing prices higher.
A clean breakout above $106K could open the path to retest $112K+.
The $102K–$104K zone remains key support as long as BTC holds above it, the short-term bias stays bullish.
DYRO, NFA

$IDUSDT 1D chart The BINANCE:IDUSDT 1D chart shows a potential breakout from its long downtrend.
Price recently bounced off a strong demand zone at $0.1785 and is now testing above the descending trendline.
If momentum holds, a move toward the $0.4004 target +131% is possible.
Watch for strong volume confirmation to validate the breakout.
DYRO, NFA

Bitcoin will continue to fall to support level in channelHello traders, I want share with you my opinion about Bitcoin. This chart shows how the price rebounded from the support line and started to grow. In a short time, it rose to the support level, which coincided with the buyer zone, and it even soon broke this level. Next, the price rose a little and then continued to move up, but later corrected the support line. After this, BTC rebounded and rose to the seller zone, breaking the 108800 resistance level. Then it rose a little more and turned around, and started to decline inside the downward channel. In the channel, price soon broke the 108800 level and continued to fall next. Later, Bitcoin broke the support line and fell almost to the support line of the channel, after which it turned around and made an upward movement. After this movement, Bitcoin dropped to the 100300 support level, after which it turned around and, in a short time, rose to almost the resistance line of the channel. Price didn't reach this line, turned around, and continued to fall in the channel. In my mind, Bitcoin can continue to move down top support level inside the downward channel. That's why my TP is 100300 level. Please share this idea with your friends and click Boost 🚀

$ASTRUSDT Breakout Setup$ASTRU is attempting a breakout from its downtrend on the 6H chart.
Price is pushing above the descending trendline, supported by a bullish MACD crossover.
If the breakout holds, the next target is around $0.035061, with a stop below $0.025490.
Momentum looks promising for further upside.

Doge coin log term that my personal view for the doge coin chart
it looks like history repeat it self my price target $2.50

$DOT Setup: Watch This BreakoutCRYPTOCAP:DOT is trading in a clear range between $3.544, $4.022 support and $10.132, $12.564 resistance.
The current pullback to the demand zone hints at potential accumulation.
A breakout above $12.423 could trigger a strong rally toward $23.654, $32.756, $53.172, and higher.
DOT is gearing up for a major move once resistance clears.
DYRO, NFA

EURCAD BULLISH OR BEARISH DETAILED ANALYSISEURCAD is currently consolidating within a clean symmetrical triangle formation on the 8H chart, tightening between dynamic support and resistance. Price is hovering around 1.56200 and coiling at the apex of the triangle, suggesting a breakout is imminent. With this structure developing over several weeks, this setup is primed for a high-probability directional move. The overall technical picture is showing compression, and the bullish bias becomes more likely if price breaks and closes above 1.56900.
From a fundamental perspective, the euro is gaining moderate strength as the ECB is maintaining a cautiously hawkish tone while assessing economic recovery and inflation persistence. Meanwhile, the Canadian dollar is facing downward pressure following the Bank of Canada's recent interest rate cut — a shift that surprised many traders and sparked risk-on flows away from the loonie. Crude oil prices, which often support CAD, have also turned volatile with no sustained bullish momentum, weakening CAD’s support base.
This triangle pattern reflects indecision but also the perfect setup for breakout traders waiting for volatility expansion. A confirmed bullish breakout would likely target 1.59200, with short-term resistance levels offering minor friction around 1.57800. The breakout aligns with a well-balanced risk-reward setup, with a stop area potentially below 1.56000. Price action has respected this structure consistently, adding further confluence for a clean technical move.
As EURCAD inches toward a decision point, traders should be on high alert for breakout confirmation and follow-through momentum. This is a textbook volatility squeeze pattern — when it resolves, it tends to run fast and far. With favorable macro fundamentals, this setup has the potential to deliver a solid trend continuation wave in the coming sessions.

Bitcoin may break resistance level and continue to move upHello traders, I want share with you my opinion about Bitcoin. If we look at the chart, we can see how the price entered an upward channel and declined to the support line. Then it started to grow and soon reached the 93500 support level, after which it broke this level and then some time traded near. After this, the price rebounded and continued to move up inside an upward channel, where it later reached a resistance level, which coincided with the seller zone. When BTC reached this level, it broke it too and even rose to the resistance line of the channel, but soon it turned around and dropped to the seller zone. In this area, the price long time traded and later tried to grow, but failed and continued to decline. Soon, BTC broke the 106500 level and fell below the resistance level. But recently, price turned around and grew to this level again, and now trades very close. In my opinion, Bitcoin can decline a little and then break the resistance level one more time. After this movement, I expect that the price will continue to move up inside the upward channel, so I set my TP at 112000 points. Please share this idea with your friends and click Boost 🚀
