$Bitcoin approaching ATHBitcoin approaching ATH 👀
CRYPTOCAP:BTC breaks out of a multi-month descending triangle and flips key resistance into support.
Now pushing toward the $110K zone, a consolidation range is expected just below the all-time high.
Momentum looks strong.
ATH, retest soon?
USDT-D

$UFD Falling Wedge Breakout in Play📈 $UFD Falling Wedge Breakout in Play 🚀
Unicorn Fart Dust $UFD just broke out of a multi-month falling wedge a classic bullish reversal pattern.
After retesting the breakout zone, the price is holding strong above support.
- Target: $0.408
- Potential Upside: +1957.8%
If this setup plays out, we could witness a massive rally.
Keep your eyes on this low-cap gem! 👀

$BTC support zoneCRYPTOCAP:BTC has broken out of a falling wedge and is now consolidating above the key $91K support zone.
- Eyes are now on the All-Time High at $ 109 K.
- Once that breaks, a price discovery rally toward $ 120k+
It is highly likely. 🧠
- The chart looks.
DYRO, NFA

$1000CHEEMSUSDT Breakout Alert🚨 Breakout Alert! BINANCE:1000CHEEMSUSDT 🚀
Price broke out of a symmetrical triangle on the 12-hour chart, bullish confirmation in play.
- Entry: CMP
- Target 1: 0.001681
- Target 2: 0.002183
- Final Target: 0.003322
- SL: 0.001336
Volume confirmation next?
Watch closely! 👀

formed a bearish head and shouldersXVS has formed a bearish head and shoulders pattern and has already broken below the blue neckline. This breakdown suggests a potential move down to the green line level.
📈 Technical Overview:
Pattern: Bearish Head and Shoulders
Neckline: Blue level, already broken.
🎯 Target: Green line level upon confirmation of the breakdown.

$BR/USDT just broke out$BR/USDT just broke out of a major resistance zone after weeks of compression inside an ascending triangle 📈
Now holding above the breakout level, with a clean 100% upside potential mapped.
If the Bulls defend this zone, the next leg could be explosive.

$INJ Breakout Alert!CRYPTOCAP:INJ breakout alert!
-It finally broke above the downtrend line after months of
consolidation.
-Retest and holding the key support zone around $8.50–
$9.00.
-Now, we are aiming for the next leg toward $26, a
Potential 184% move.
-Trend shift confirmed. Watch closely!🚀
DYRO, NFA

$BTC at the start of the next parabolic run!Bitcoin's parabolic run in 2017 continued on MA11 and with the breaking of the middle band of the mass index indicator, the second parabolic run continued and now we are at the same stage.

BREAKOUT ALERT: $ONDO🚨 BREAKOUT ALERT: LSE:ONDO
Massive falling wedge breakout spotted on the daily chart!
Price has flipped key resistance into support and is now eyeing a 140% upside toward $2.20 🚀
Watch closely — breakout retest in play.
Next stop: Moon? 🌕
DYRO, NFA

$CHILLGUY/USDT BREAKOUT!$CHILLGUY/USDT BREAKOUT!
Massive breakout from falling wedge + strong retest of the previous range resistance.
If this momentum holds, a 13x rally toward $0.58 is on the cards! 📈
Targets:
- $0.137
- $0.261
- $0.581
Ride or regret. DYOR, NFA 🚀

$AITECH/USDT Analysis:🧠 $AITECH/USDT Analysis:
After a long downtrend inside a falling channel, $AITECH broke out with strength, flipping the previous supply zone into support.
- Target: 0.15613
- Potential Gain: +303% from breakout
Watch for a retest & confirmation.
DYOR. NFA.

Bitcoin may rebound from seller zone and start to declineHello traders, I want share with you my opinion about Bitcoin. In the past, the price had been consolidating within a broad range, repeatedly rejecting support and resistance zones. The buyer zone between 79100 - 80300 provided a strong base, and from there, BTC began to grow, forming a bullish structure that led into an upward wedge. This growth accelerated once the price broke through the support area and continued upward until it approached the resistance level at 95500, which also overlaps with the seller zone. As the price moved inside the wedge, the bullish impulses weakened. Buyers lost strength near the resistance line of the wedge, and recent price action suggests that sellers are stepping in at the top. We’ve now seen multiple failed attempts to break higher, and the price is consolidating under resistance, forming pressure to the downside. This entire consolidation near the wedge resistance, especially inside a confirmed seller zone, indicates a likely reversal. The current structure shows signs of exhaustion, and if the support line of the wedge breaks, that would trigger a significant correction. Given this context, I expect BTC can make a bearish move toward TP1 at 91500 points. Please share this idea with your friends and click Boost 🚀

$TRB/USDT Targeted setup $TRB/USDT – Targeted Setup
Clear descending wedge breakout
Retest of the resistance zone holding as support
Bullish structure forming with higher lows
- Entry zone: CMP
- Target: $98
- Stop-loss: $26
This is a clean breakout-retest setup, with momentum favouring bulls.
As long as $29.98 holds,
Eyes are on $97. 👀
DYOR, NFA

$ORDI/USDT Long setup 4h$ORDI/USDT – Long Setup (4h) 🚀
Entry: CMP
SL: $7.51
Targets: $10 / $12 / $13
- Breakout & retest of trendline
- Bullish momentum building
- Setup is valid as long as $8.10 holds
DYOR. Trade safe! 👀

$DOGS/USDT Breakout alert📈 $DOGS/USDT Breakout Alert
DOGS just broke out of its long-term descending wedge — a bullish signal!
- Trendline cracked
- Support held
- Reversal brewing?
One to watch. DYOR!

WLD Bearish Head and Shoulders Pattern ConfirmedWLD Bearish Head and Shoulders Pattern Confirmed 🚨
WLD has formed a bearish head and shoulders pattern and is currently breaking below the red neckline. The target for this bearish move is the green line level.
📈 Technical Overview:
Pattern: Bearish Head and Shoulders
Neckline: Red level, currently being broken.
🎯 Target: Green line level.
.

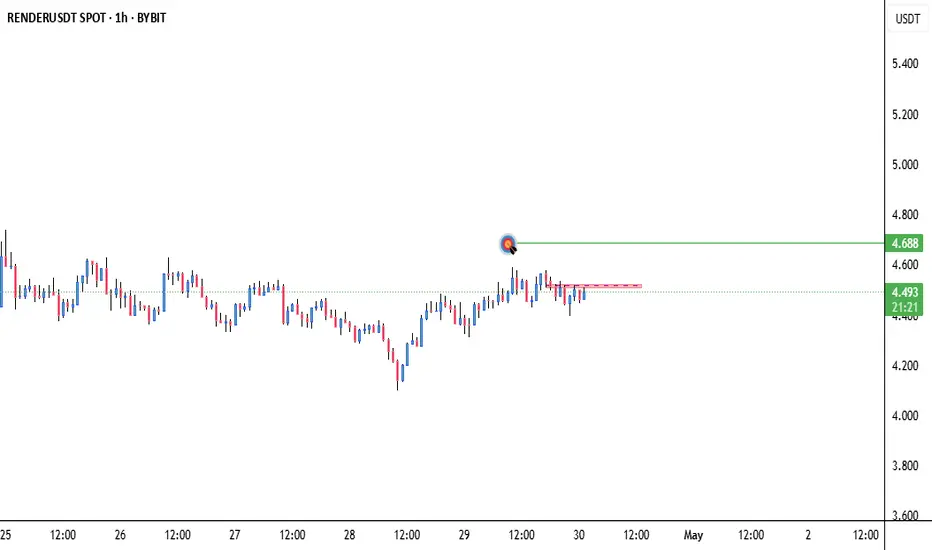
RENDER Testing Red Resistance Zone🚨 RENDER Testing Red Resistance Zone 🚨
RENDER is currently testing a significant red resistance zone. A breakout above this level could signal a bullish move, with the target set at the green line level.
📈 Technical Overview:
Resistance Zone: Red area currently being tested.
🎯 Breakout Target: Green line level upon confirmation.
Bitcoin may little correct and then continue to grow in wedgeHello traders, I want share with you my opinion about Bitcoin. Analysing the current chart, the market behaviour becomes much more understandable. Initially, Bitcoin was moving inside a clean upward channel, showing steady growth with rebounds from the support line and multiple corrective phases. After a strong breakout above the buyer zone, the price maintained bullish momentum and reached the current support level at 88500. Later, BTC consolidated within the support area, confirming its role as a springboard for the next impulse move. The price eventually broke higher, leaving the channel behind and forming a new structure, an upward wedge. This wedge is a natural development after a strong uptrend, often suggesting that the price may continue climbing toward the upper boundary before any potential reversals occur. At the moment, BTC is trading between the wedge's support and resistance lines, precisely respecting both structures. Small corrective pull-backs have already been observed, but buyers quickly defended the support area, keeping the bullish structure intact. Given the clear market structure, the strong breakout momentum from the support area, and the continuation pattern in the form of the upward wedge, I expect Bitcoin to continue moving higher toward the 97000 points, which aligns with the resistance line of the wedge. This level also serves as my TP1 for the current bullish move. Please share this idea with your friends and click Boost 🚀

$ENA/USDT Quick Analysis $ENA/USDT Quick Analysis
ENA has successfully broken its long-term downtrend and retested the $0.30–$0.35 support zone.
Price action is bullish, aiming for a $1.35 target (295% upside).
The breakdown below $0.30 would invalidate the setup
DYOR, NFA

Tether Dominance, TA» There is a lower high on the chart. This is a long-term timeframe. The signals are very strong here.
» There is a strong rejection at SMA200, this level being confirmed as resistance.
» There is a very strong decline in volume.
» There are three consecutive weeks closing red.
These are all very powerful bearish signals.
» This week wicked lower compared to 24-March.
Tether Dominance just produced the lowest reading on a drop since November 2024. When USDT.D was moving down in November 2024, everything Crypto was moving up. The conditions are similar today.
Tether Dominance can be seen moving down as a continuation of a bearish trend. This is happening after a lower high is fully in and confirmed.
Short-term, there can be a small pullback followed by lower prices.
For example, several days can close green but by the time next week ends, the action turns full red. Just as it happened on the 7-April week. The action started strongly bullish but USDT.D ended with a bearish week and the start of a decline that will lead to a lower low.
We are likely going to see the lowest reading on this index since March 2022 or December 2021. It is a long process but the chart is pointing down. That is what the chart says.
Thank you for reading.
Namaste.

DOUBLE BOTTOM PATTERN 🚨 DRIFT Forming Bullish Double Bottom Pattern 🚨
DRIFT is forming a bullish double bottom pattern and is approaching a key red resistance zone. A breakout above this level could signal a strong bullish move.
📈 Technical Overview:
Pattern: Bullish Double Bottom
Resistance Zone: Red area currently being tested.

Formed Bullish Pattern APT
Formed Bullish Pattern
APT
has formed a bullish pattern and is approaching a key red resistance zone. A breakout above this level could signal a strong bullish move, with the first target at the green line level.
📈 Technical Overview:
Pattern: Bullish
Resistance Zone: Red area currently being tested.
🎯 Breakout Target: Green line level upon confirmation.

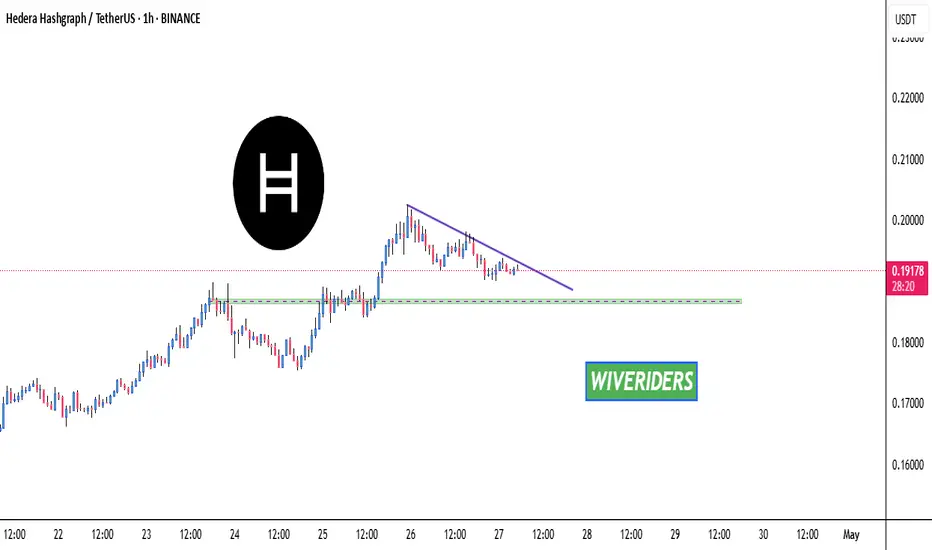
HBAR Approaching Green Support Level 🚨 HBAR Approaching Green Support Level 🚨
HBAR is nearing a significant green support level. This area could provide a potential bounce and a good entry point for a long position. Wait for confirmation of support before entering the trade.
📈 Technical Overview:
Support Level: Green zone.
Potential Entry: Long position upon confirmation of support at the green zone.