$WIF Breakout Confirmed 🚨 SEED_WANDERIN_JIMZIP900:WIF Breakout Confirmed?
Dogwifhat has officially broken out of the descending channel and is trading above key resistance with strong momentum.
If bulls hold this zone, we could be eyeing major upside moves.
Key targets:-
• $0.774
• $1.474
• $3.006
• $4.659
SL: $0.305 | Entry: CMP
Is this the start of SEED_WANDERIN_JIMZIP900:WIF ’s next moon mission? 🌕
DRYO, NFA
USDT-D

$USDT.D Cycle Top ProjectionI could see CRYPTOCAP:USDT.D playing out like this.
This November data also coincides with my BTC Cycle Thesis in November.
Lotsa other macro factors and indicators at play for a cycle top, but this lines up nicely and where I'll be taking a heavy chunk of profits.

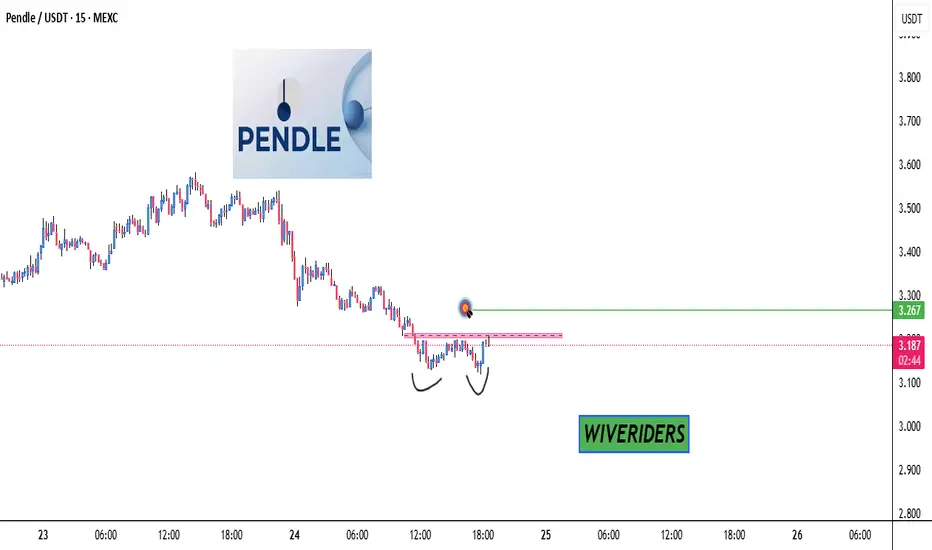
Double Bottom Breakout Watch! 📈 CRYPTOCAP:PENDLE - Double Bottom Breakout Watch! 👀
⏳ On the lower timeframe, CRYPTOCAP:PENDLE has formed a double bottom pattern.
🔴 Confirmation needed: Break and close above the red resistance zone.
🎯 Target: Green line level on a successful breakout! 🚀
USDT Dominance on its way to 3.80%: Bullish or Stormy?USDT Dominance on its way to 3.80%: Bullish or Stormy?
USDT Dominance (USDT.D) is approaching the critical threshold with the recent decline. As seen in the chart, the direction is now down with the break of the uptrend. However, the general acceptance that this decline is the beginning of the bull season may mislead many investors.
Because when we look at the past, the 3.80% - 3.60% range has usually been the end point of the bull season, not the beginning.
What does this mean?
🔹USDT.D falls while BTC rises. However, these declines usually coincide with the last days of the bull.
🔹If there's a rapid descent into this zone, we could see a sharp rise in BTC. But this move is often the last wave.
🔹So when it comes to that level, while everyone is waiting for new highs, smart money may be preparing to exit.
Also another point to pay attention to;
🔸 On the BTC side, the 102K - 104K zone still remains the strongest liquidation area.
🔸 If USDT.D falls below 3.80% while testing this region, attention! That peak may be the last.
Therefore, while waiting for the above liquidation levels, we should keep an eye on the USDT.D chart. Because when it approaches 3.80 levels, risk bells may start ringing. This is the target for now.
As a result, when you start dancing to the song that will soon play in the background, do not forget that the music may suddenly stop and the lights may be switched off.

$PEOPLE/USDT Update 📈 $PEOPLE/USDT Update
After months in a downtrend channel, SEED_DONKEYDAN_MARKET_CAP:PEOPLE has finally broken out with strong momentum.
Price has flipped a key support zone of 0.0140 and could retest it before a potential leg up. 🟢
Entry:- CMP
Targets:
TP1:- $0.01926
TP2:- $0.02533
TP3:- $0.03705
TP$:- $0.06248
SL: $0.00978
Breakout + retest play in motion.
Let's see how it unfolds. 🚀.....DYOR, NFA

TOTAL2 / BTC - Majority of Alts Look BearishDon't shoot the messenger, but the MAJORITY of your Alts need to NUKE ~25% before Alt Season 🫨
This lines up with prior cycle support before Alt Season blastoff.
First step is to reclaim the EMA9, which they have failed to against BTC.
The lack of buying Volume supports this thesis for the trend to continue downwards.

We might be seeing a short-term correctionWe might be seeing a short-term correction, as the USDT supply is rising again and both ETH and BTC failed to break through their resistance levels — while Solana did. A brief pullback is possible, especially considering that the main reason behind the breakout was recent news about Trump. That could mean the breakout was a fake move or part of a temporary trend.
The three major currencies that usually drive the market are currently showing less bullish momentum for the coming days — except for Solana , which successfully broke its resistance . However, Solana isn’t continuing to climb either, likely because we still need a breakout from both ETH and BTC to confirm the move.

NEAR/USDT is Nearing The Daily TrendHey Traders, in today's trading session we are monitoring NEAR/USDT for a selling opportunity around 2.55 zone, NEAR/USDT is trading in a downtrend and currently is in a correction phase in which it is approaching the trend at 2.55 support and resistance area.
Trade safe, Joe.

$FLM/USDT Breakout AlertAfter a strong accumulation phase, CSE:FLM just broke out of a descending trendline with volume confirmation!
Entry: 0.0154
SL: 0.0137
Target: 0.0269
Price broke above the trendline + 50ema, signalling a potential trend reversal.
Bullish momentum is building; eyes are on the next key level!
Are you riding this breakout? 👀

$TOTAL3 Breakout Altcoins breakout loading?
TOTAL3 (Crypto market cap excl. BTC & ETH)
breaking out of a falling wedge.
Target: $1.16T +51%
All-time high in sight. 👀

Bitcoin may exit from pennant and fall to support levelHello traders, I want share with you my opinion about Bitcoin. Over the past weeks, the price traded inside a broad horizontal range, repeatedly testing the boundaries of the seller zone and the buyer zone. After several failed breakouts, the price sharply dropped from the upper range and entered a phase of lower highs, forming a downward pennant structure. Inside this pennant, the market continued consolidating under pressure from the resistance area. Each attempt to break above the resistance line was met with rejection, confirming strong selling interest near the current resistance level at 88500. At the moment, BTC is testing the upper boundary of the pennant again. This area aligns closely with the resistance level and the long-term descending trendline. Given this confluence and historical rejection zones, I expect BTC to face resistance and reverse, initiating a decline back toward the 79000 support level, thereby exiting from the pennant, which is my current TP1. The compressed price structure, repeated rejections, and clean pattern formation support this bearish outlook in the short term. Please share this idea with your friends and click Boost 🚀

I'm Bullish, but... CHR / USDTEvening fellas,
My latest posts are bullish, and I did long some coins during the blood we had a couple of days ago.
But one must always be ready and I am seeing something interesting in a couple of coins, showing me that there's a hidden bearish scenario behind all the hype.
CHR is one of those coins, it's got good news, hype, etc, but I think MM'rs want to destroy some lives.
Keep an eye on it.
Trade thirsty, my friends!

People Used To Get Scared - BTC / USDMorning folks,
Read the chart, it contains all information.
I figured since I didn't update my inverted Adam & Even pattern chart much I'd just create a new one, but check it out, its playing marvelously.
Trade thirsty!

Conspicuous - MANA / USDTEvening fellow traders,
Every now and then I ride waves on MANA.
This time it won't be different, as I am already in it.
But I'm looking for an extra touch, that outta the box type thing and buying an extra chunk between the prices shown in the chart.
Please take advantage of this if you get the chance, and let's make a big chunk of money together!
Trade thirsty, my friends!

finally altcoins ready for strong bounce btc Dominance Finally Showing Signs Of Weakness, Formed Rising Wedge, Rejected From Rang,s Top, Counter Trendline Breakout Confirmed, Expecting Move Towards Ascending Trendline In Coming Days, And In Results Altcoins Finally Will Get Some Relief, However Once Ascending Trendline Got Cleared, Alts Can Bounce Sharply After That.

Bullish Rounding Bottom!📈 GHST Update – Bullish Rounding Bottom! 🚀
👀 GHST has formed a bullish rounding bottom. If breakout red resistance zone target green line level.
🔑 We are waiting for a breakout above the red resistance zone to target the green line level.
Keep a close eye on GHST!

bico getting ready for 2x bullish wave after long time, seems like bico getting ready for another breakout, currently testing multiple resistance area, once falling wedge and horizontal area got cleared, it can give solid bullish rally towards 0.2$ waiting for breakout

Bitcoin can exit from triangle and drop to support levelHello traders, I want share with you my opinion about Bitcoin. The chart shows how the price previously made a strong decline, followed by a sharp rebound from the buyer zone between 77800 - 79000 points. This recovery formed a short-term uptrend, which led the price back into the seller zone, where bullish momentum slowed down. After testing resistance, BTC formed a wedge pattern that eventually broke to the downside, causing a new wave of correction. Following this drop, the market rebounded again from support and began forming a triangle pattern. The triangle developed inside the same larger resistance area that had already rejected price action before. The structure of the triangle shows lower highs with clear resistance along the 88500 level, reinforcing bearish pressure. Currently, BTC is trading near the apex of this triangle, and the price just bounced down again from resistance. This reaction suggests that the market is struggling to push higher and could be ready for a breakdown. Based on the triangle structure, the seller zone rejection, and the multiple failed attempts to break higher, I expect BTC to move downward toward the 80000 points, which I consider as TP1. The 79000 - 80000 area also coincides with the next major support and previous accumulation zone. Please share this idea with your friends and click Boost 🚀

Potential Inverse Bullish Head & Shoulders! 📈 CRYPTOCAP:AAVE Update – Potential Inverse Bullish Head & Shoulders! 👀
CRYPTOCAP:AAVE appears to be forming an Inverse Bullish Head and Shoulders pattern, which could signal a bullish reversal! 🐂
⚠️ Watching for a breakout above the neckline (resistance) for confirmation.
🎯 Target: Green line level 👆

BAN Update – Inverse Bullish Head & Shoulders Forming!📈 BAN Update – Inverse Bullish Head & Shoulders Forming! 🚀
👀 BAN appears to be forming an Inverse Bullish Head and Shoulders pattern! This could signal a strong upward move if the blue resistance line (neckline) breaks! 🐂
⚠️ Watching for a clear breakout above the blue resistance line. If confirmed...
🎯 Target: Green line levels

USDT Dominance Analysis + $BTC priceBased on USDT dominance movements I predicted the CRYPTOCAP:BTC price for 2 years ahead.
This is just a prediction based on technical patterns and not financial advice.

USDT Dominance Update (1H)First, it’s important to remember that USDT Dominance (USDT.D) tends to move inversely with the market. In simple terms:
— If USDT.D rises, the crypto market usually drops.
— If USDT.D falls, the market typically rallies.
On the lower timeframes, USDT.D has broken out of a descending wedge formation, which is generally considered bullish.
Additionally, a double bottom pattern appears to be forming and is on the verge of breaking out to the upside.
Taking all of this into account, USDT.D could potentially rise toward the 5.81% level — suggesting that the broader crypto market may experience a short-term correction.
This outlook also aligns with one of my recent Bitcoin analyses.
Be sure to check my latest Bitcoin breakdown to understand where the market might be headed next.
— Thanks for reading.

Bitcoin can exit from wedge and then drop to support levelHello traders, I want share with you my opinion about Bitcoin. Earlier, the price was moving inside a broad horizontal range, with clear rejections from both support and resistance. The lower boundary of this range was located near the support level at 81200 points, and the market found solid footing there. After a series of bounces, BTC gradually started to grow, breaking out of the lower range and forming a new short-term trend. The growth accelerated after the price exited the buyer zone, leading to the development of an upward wedge. Within this pattern, BTC continued climbing and eventually broke through interim resistance levels, reaching new local highs. The current movement shows clean reactions to the support and resistance lines of the wedge, with the price respecting the structure closely. Now, BTC is approaching the resistance level at 88500, which aligns with the upper boundary of the previous range and borders the seller zone. The combination of this resistance and the narrowing wedge formation increases the probability of a bearish reversal. Given this setup, I expect BTC to reverse soon and continue moving down toward the 81200 support level, which remains my current TP1. Please share this idea with your friends and click Boost 🚀
