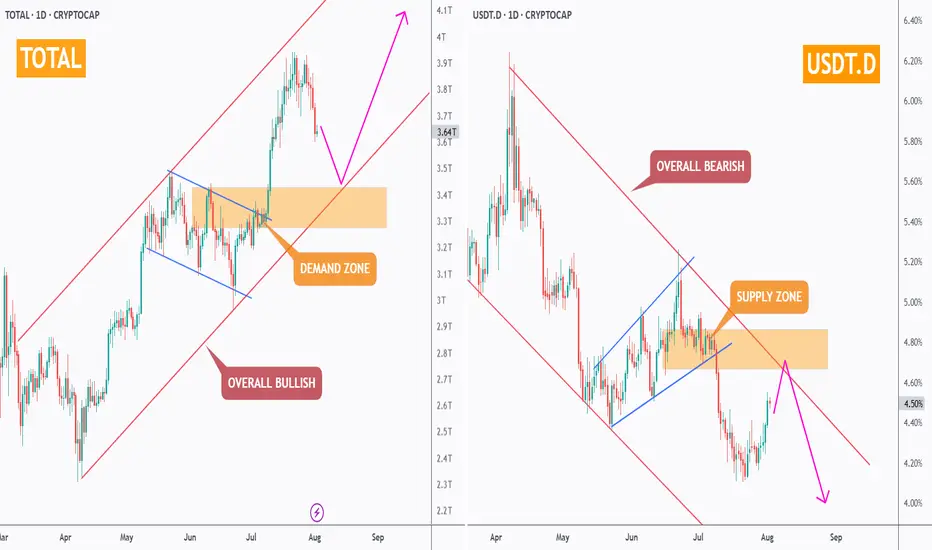
Don’t Panic — It’s Just a Healthy Crypto Correction!While the crypto market has seen some red this week, the bigger picture remains intact. Let’s zoom out and make sense of the current correction.
🔸 TOTAL Market Cap (left chart)
The structure remains overall bullish, trading inside the red rising channel.
After a solid rally, the market is currently pulling back toward a strong demand zone – perfectly aligned with the lower trendline. This area is likely to act as a major support, from which the next bullish impulse could kick off.
🔸 USDT Dominance (right chart)
USDT.D remains overall bearish, trading inside the red falling channel.
It’s currently pushing higher toward a well-defined supply zone, which also intersects with the upper red trendline. As long as this area holds, we expect sellers to take over again — giving altcoins the space they need to bounce back.
📌 In simple terms:
The market is in a healthy correction. Don’t let short-term dips shake your long-term view. The trend is still your friend.
➡️ As always, speak with your financial advisor and do your own research before making any investment decisions.
📚 Always follow your trading plan => including entry, risk management, and trade execution.
Good luck!
All strategies are good, if managed properly.
~ Richard Nasr
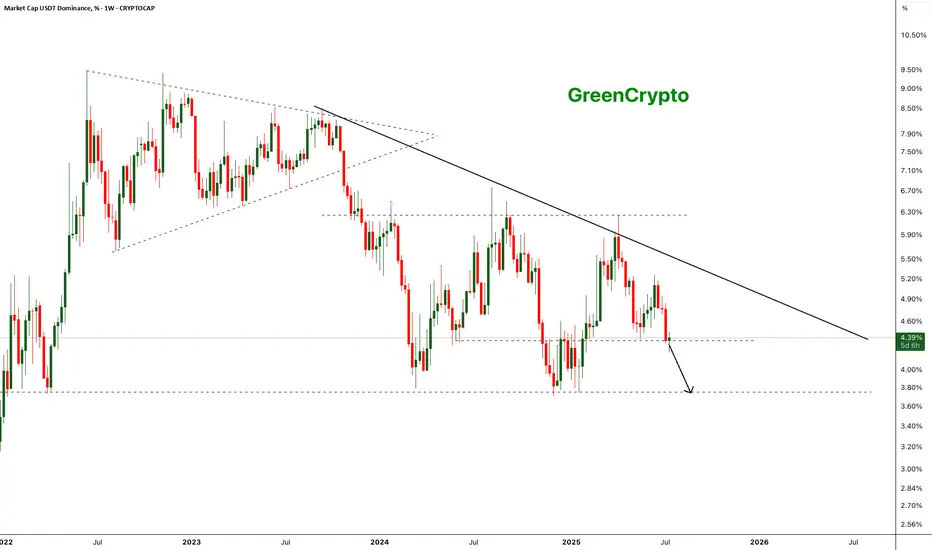
Usdt-dominance
Bearish Breakdown in USDT Dominance - Altseason Loading?The chart shows a clear long-term descending trendline acting as resistance since mid-2023. After multiple failed attempts to break this trendline, USDT dominance has broken below a key horizontal support around ~4.35% on strong bearish momentum.
- Weekly close below the ~4.35% horizontal support.
Next key support zone: ~3.65–3.70% (marked by previous 2023 lows).
- Strong bearish engulfing candle confirming breakdown.
- Bearish continuation expected if dominance remains below 4.35%.
Further drop of the usdt dominance will start the altseason
Cheers
GreenCrypto
BTC & USDT.D => Bullish Correction Incoming?Hello TradingView Family / Fellow Traders. This is Richard, also known as theSignalyst.
Both BTC and USDT.D are sitting around key rejection zones.
💰 BTC is hovering near the $100,000 level — a major previous low and a psychological round number.
📊 Meanwhile, USDT.D is testing the 5% resistance — a supply zone and another critical round number.
As long as $100,000 holds as support on BTC and 5.1% holds as resistance on USDT.D, we could expect a bullish correction across the crypto market.
What do you think? Will these levels hold or break? 🤔
📚 Always follow your trading plan regarding entry, risk management, and trade management.
Good luck!
All Strategies Are Good; If Managed Properly!
~Rich

USDT.D Original idea inspired by trader SpartaBTC — highly recommend checking out their page.
On the chart, we can clearly see a descending channel. Historically, every time the price touched the upper boundary and started moving down toward the lower one, it marked the beginning of a broader crypto market rally.
Potential targets are shown on the chart.

USDT.D Forecast: Time to Buy the Dip?#USDT DOMINANCE
This is what I’d like to see happen in the next 2 days.
And I believe it will. Invalidation would be a close above 4.80%.
I’m buying the dip, guys. Let’s see how this plays out.

Altseason is cancelled for now. But Should resume soon.If you're interested in altcoins, be sure to check out my ideas. I’m closely tracking CRYPTOCAP:BTC.D and CRYPTOCAP:OTHERS , and you’ll find plenty of valuable insights in those analyses.
So, what’s going on? My CRYPTOCAP:OTHERS prediction played out — May was bullish. But was it the real altseason? Not quite. The true altseason typically begins at the end of the Bitcoin cycle, and we’re not there yet.
Right now, we’re seeing price action reminiscent of December 2024. Bitcoin maximalists are aggressively buying BTC during a time it should be correcting, which is inflating BTC dominance and crushing any momentum for an altseason. They appear to be using altcoins as exit liquidity to pump BTC, especially as retail investors hesitate to buy Bitcoin above $100K.
What’s next?
The daily MACD suggests we’re entering a correction phase that could last around two weeks. A drop toward $1.2T is likely, as there's a major order block between the current level and that target. However, the real support lies below $900B — my "green box" — which I view as the ideal buy zone.
Historically, entries in this green box have offered 2x–3x returns on high-volatility altcoins from the top 100, especially in sectors like memes, DeFi, and AI.
I expect altcoins to correct into that zone in the coming weeks — keep an eye on it.
DYOR (Do Your Own Research).
#Crypto #Altcoins #Bitcoin #BTC #BTCdominance #Altseason #CryptoMarket #CryptoTrading #MACD #TechnicalAnalysis #DeFi #MemeCoins #AIcoins #AltcoinSeason #DYOR

USDT.DSecond Point:
The USDT Dominance on the daily timeframe is showing the exact opposite behavior of Bitcoin. It has reached a supportive trendline which, for the past 3 months, has led to a reversal every time the index has touched it — pushing the market one level lower. And now, we're back at that critical zone again.
Will things be different this time?
This current touch appears to be a wave F, and perhaps we could even consider a potential wave G, which would imply one final leg up for USDT Dominance. However, there’s no certainty. There’s also the possibility that the trendline breaks, tether gets deployed, and the market becomes just a little — just a little — more pleasant.
We're literally on the edge right now, and this is where market pumps and dumps tend to occur — right in these key zones.
When will the situation become clear?
We have an important time zone coming up, and it’s likely that within the next couple of days, market makers will show their hand.
What do you think will happen?
Trendline breaks → Market pump
Trendline holds → Market dump ❤️

USDT.D - The dominance of real moneyThe dominance of the dollar over cryptocurrencies is a real indicator of the growth status of ETH!
The last wave of correction and decline is happening now! Pay attention to the accumulation zone before the Bitcoin price drops/inflates.
Money is being transferred to BTC=>ETH=>ALT=>USDT=>BTC and so on in a circle, during the active participation phase of DOU, money is being transferred to ETH and beyond, so be vigilant
In addition, I would like to draw your attention to the BTC.D indicator.

Opportunity to escaping !The chart is monthly and each green candle is an opportunity to escape from this market.

USDT.D(based on NEo wave)The first bearish wave is a complex ( symmetrical and diametrical) which I consider this as A wave and the bullish wave is also a diametrical that I consider this as B wave which is ending and after this we can see a heavy bearish wave which can make ETH above 5000$.

bear market confirmationIf the chart will consolidates above 5.81%, i.e. above the sloping downtrend line, this would be an early indicator of the start of a bear market, because this line is global for the current bull market.
The second confirmation will be if dominance will bumped at 3.94 - 4.30% range as wave B and will update the end of wave A.

USDT.DOMINANCE WEEKLY CHART UPDATE. Current Market Structure:
Breakout Confirmation: USDT Dominance has broken out of its descending trendline and is now in a retest phase.
50MA as Support: The 50-week moving average now acts as dynamic support, reinforcing the bullish outlook.
Rejection or Breakout? The price is currently testing resistance. If it gets rejected, a temporary pullback is likely before further gains.
If you found this analysis helpful, hit the Like button and share your thoughts or questions in the comments below. Your feedback matters!
Thanks for your support!
DYOR. NFA


Tether Dominance, Weekly OutlookAs we see USDT.D Bounced from long formed Support / Resistance zone, while tested it with long wicks several times.
- RSI Divergence
- Bounced From Support
- Below 21 Week EMA

USDT.D hinting of a massive cryto market reversal ↑. GET SEEDED!USDT.D an inverse confluence of the crypto market has predicted the major correction before it happened. It has gone parabolic for a few weeks tapping its favorite resistance roof line aT 5.50%.
Now, based on the last weekly close, USDT.D is hinting of a major market reversal to the upside. (USDT.D falling = crypto market rising). It means USDT.D in red means, more cash are being converted to crypto holdings.
The first descending shift line at the upper channel has been registered. First time since September 2024. This is already conveying of a major shift in trend and a weighty series of price growth from here is forthcoming in the next coming weeks.
Best season to get seeded again on the market -- moreso scale in on the bluechip ones, BTC ETH ADA XRP.
It's that season again. A very green one.
Spotted at 5.30%
Mid target at 3.50%.
TAYOR. Trade safely.

USDT.DThe trend of Tether's dominance is both downward and several times it hit our main resistance in order to collect the necessary liquidity for the fall. Bitcoin, in my opinion, will not fall so much, but Bitcoin may be able to register a new ceiling, the market is bullish.

USDT.DOMINANCE CHART UPDATE !! USDT dominance chart on the 4H time frame is trading within a rising channel. Currently, it is approaching the upper resistance of this channel near 4.8%.
If USDT dominance continues to rise, it could signal an increase in risk-off sentiment in the crypto market, as traders may move funds into stablecoins. Rejection from the upper trendline could lead to a pullback towards the mid-range (around 4.2%) or even the lower trendline near 3.8%, which would be more bullish for altcoins and Bitcoin.
If you found this analysis helpful, hit the Like button and share your thoughts or questions in the comments below. Your feedback matters!
Thanks for your support!
DYOR. NFA

USDT Dominance Chart AnalysisUSDT dominance broke out of a long-term descending channel.
However, it is showing signs of rejection at nearly 4.60% and could head back towards support.
21-day MA (black line): Previously acted as resistance, but now provides some support.
100-day MA (purple line): Was breached, but is now being retested as support.
A red candle after the recent breakout suggests a possible failed breakout scenario.
The green arrow indicates a potential decline towards 4.20% or even lower.
Support: 4.20% (previous resistance, now potential support).
Low Support: 4.00%
Resistance: 4.60%
If you found this analysis helpful, hit the Like button and share your thoughts or questions in the comments below. Your feedback matters!
Thanks for your support!
DYOR. NFA

USDTDOMINANCE CHART UPDATE !The chart highlights USDT dominance (USDT.D), which is used to measure market sentiment and money flow into or out of stablecoins such as USDT
The chart shows a completed “head and shoulders” pattern, which is often considered bearish in technical analysis.
The neckline has been broken, indicating the possibility of further declines.
The price appears to be testing a descending triangle, which could indicate a continuation of the decline.
The green area below (possibly around 2.5%-3%) could act as a crucial support if dominance continues to decline.
The 50-day (red) and 200-day (green) moving averages are plotted.
Dominance is trading below both moving averages, which reinforces bearish momentum.
A breakdown of the current triangle could lead to further declines towards the marked support area.
If you found this analysis helpful, hit the Like button and share your thoughts or questions in the comments below. Your feedback matters!
Thanks for your support!
DYOR. NFA

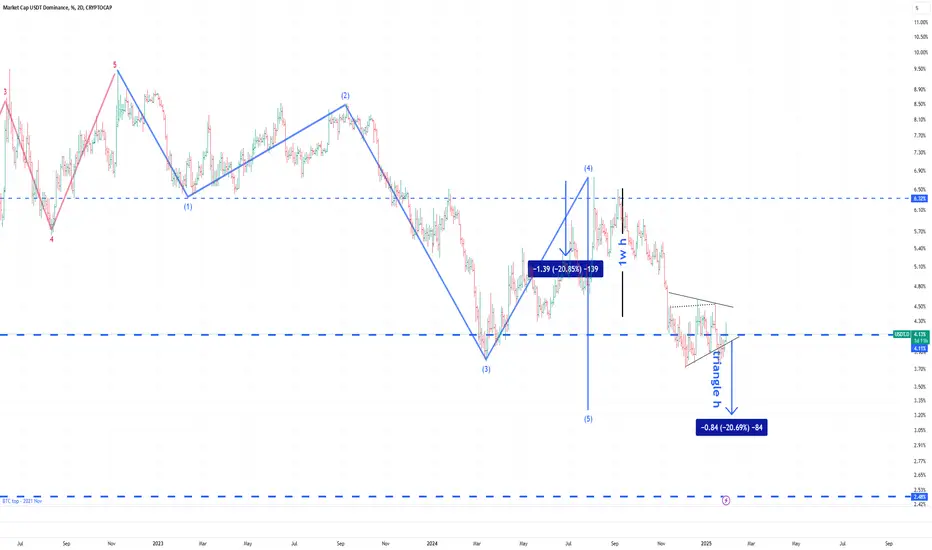
Key to upcoming price action pathHere are 2024 September - November USDt rally metrics:
66 days, 4.6 Trillions volume.
The first sub wave of micro degree is 1.39 points or 20.85% length.
The third sub wave of micro degree is 2.32 points or 35.7%. Which led to +89% at BTC, from 52k to 99k.
The triangle in fourth position has 0.75 points - 16.77% min basement or 0.97 - 20.69% max height. Triangles usually precede the last wave in the direction of the main trend. The terminal point for this triangle may reach 3.15% dominance and last in approximately the next 80 days.
The dominance of USDt on RSI 2D TF signals a downward divergence.
I think the signal line could reach ~22% before meeting the support trend line and reversing. It is -18% from the current point.
These values coincide with trend lines on Bitcoin, about 155k, or +55% from the current point.
Dodgecoin in percentage terms does move about 2x further.
This is a third confirmation proving upcoming rise in all crypto assets.
keep in mind that there is always place for an alternative waves count, but i bet that the analysis results worth millions!
So, wish you safe trading, fat profits and see you again :)
USDT.DOMINANCE CHART UPDATE ;-USDT.DOMINANCE CHART UPDATE!
Descending Channel: Dominance is trading within a well-defined descending channel, indicating a controlled downtrend.
Resistance Zone: It is currently approaching the upper boundary of the channel and a horizontal resistance zone near 4.30%-4.32%. This confluence zone could act as a rejection point.
Potential Downside: Failure to break this resistance zone could lead to a downward move toward the lower boundary of the channel, around 3.80%-3.90%.
Bearish Bias: Dominance remains under bearish pressure as long as it remains within the descending channel.
If there is a breakout above 4.32%, it could temporarily turn the sentiment bullish, indicating a reversal or a temporary halt to upward momentum.
Let me know if you’d like further assistance or adjustments!
DYOR. NFA

USDT Dominance at Make-or-Break Zone – Watch for Altcoin Moves!The chart shows a clear descending triangle pattern in the USDT dominance (USDT.D), with the dominance steadily declining and forming lower highs along a downward trendline.
This indicates weakening demand for stablecoins, which often correlates with increased risk appetite in the market as investors shift their funds from stablecoins to altcoins.
An additional argument for the alt season.Hi. I'll duplicate someone else's observation that a ‘bad cross’
of EMA 200 and EMA 50 has formed on the weekly chart of
the total dominance of USDT and USDC. And it was back in December.
This is a very good argument for TOTAL3 to start getting its share
of capitalisation in 2025.
Gosh, how many conditions are required. Market, political, sentiment, etc.
