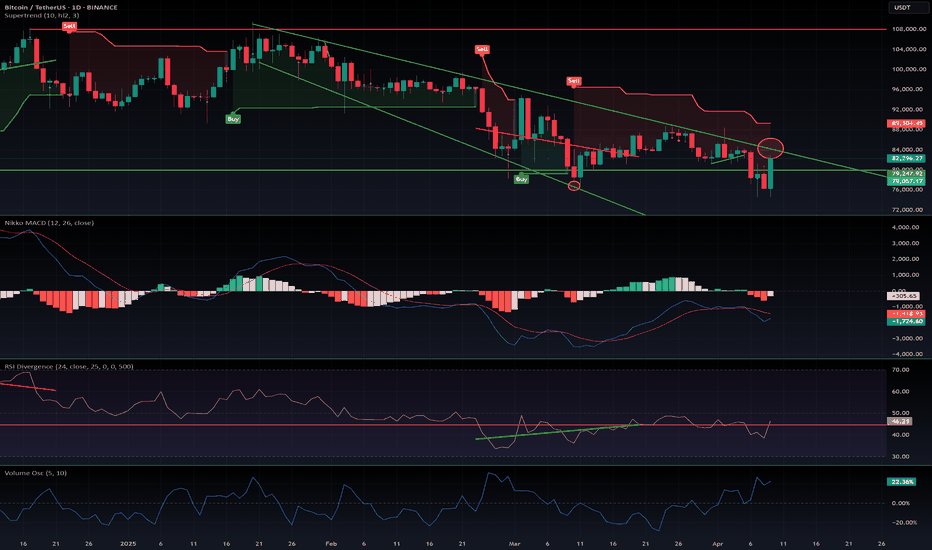
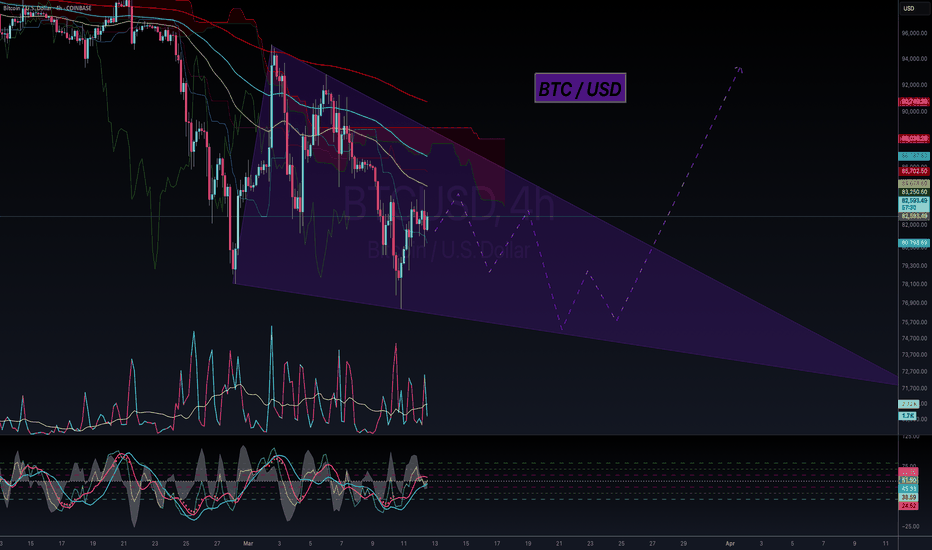
HelenP. I Bitcoin, after breaks support level, can continue fallHi folks today I'm prepared for you Bitcoin analytics. A few moments ago, the price rose to the resistance level, which coincided with the resistance zone, and when it reached it, the price made a correction movement. Then BTC rose back and repeated movement down and then continued to grow next. In a short time, the price broke the resistance level and reached the trend line, which soon broke too, and tried to grow next. But BTC couldn't rise more, turned around, and started to decline. Soon, it broke the 64600 level, made a retest, and then fell to the trend line, after which continued to decline next near this line. Also, it tried to rise but failed and dropped more, until to my past goal (60K) in the past idea, breaking the trend line and even declining a little below the 60800 support level. Next, it rose back, breaking the trend line again, but a not long time ago fell back to the support level, and now trying to break it. So, I expect that BTCUSDT will break the support level, make a retest, and then continue to decline to the trend line. For this case, I set my goal at 58800 points, which coincided with this line. If you like my analytics you may support me with your like/comment ❤️
Usdt
BITCOIN - Price can continue to move down to support levelHi guys, this is my overview for BTCSDUT, feel free to check it and write your feedback in comments👊
Some time ago price entered to falling channel, where it declined to support line, breaking $63900 level.
BTC rose to resistance line and bounced down, breaking $57200 level, but then price started to grow in another channel.
In rising channel, BTC broke $57200 level and later rose to resistance line, which coincided with $63900 level.
Price made a little gap, and even later rose higher than $63900 level, but soon turned around and started to decline.
In a short time, BTC exited from rising channel, broke $63900 level, and continued to move down close resistance line.
I think that price can make small movement up and then continue to decline, between resistance line, to $57200 level.
If this post is useful to you, you can support me with like/boost and advice in comments❤️
Technical analysis and trading plan for the ONE/USDT by BFTechnical analysis and trading plan for the ONE/USDT 1-hour chart (on Binance) by Blaž Fabjan
Descending Trading Channel:
The price is currently moving within a descending trading channel, with lower highs and lower lows. This is a bearish pattern but can lead to a bullish breakout when the price breaks the upper boundary (resistance line).
The price is testing the upper boundary of the channel, which, if broken, could signal a potential upward movement.
Resistance Line:
A key resistance line is visible near 0.0120 USDT. The price has struggled to break above this level in previous attempts.
A breakout above this level with significant volume could signal a trend reversal and potential bullish momentum.
Indicators:
VMC Cipher B Indicator: Showing potential bullish momentum building up as the red momentum wave has bottomed out, signaling a possible trend reversal.
RSI (Relative Strength Index): Currently at 54.30, indicating that the market is neutral but leaning slightly bullish. It’s above the 50 line, which suggests a shift from bearish to bullish sentiment.
Stochastic RSI: Near the overbought zone, sitting at 84.47. This could mean that there might be a small correction before the price pushes higher.
HMA+ Histogram: Shows neutral sentiment, suggesting no strong trend currently. But with a bullish setup on other indicators, this could shift positively.
Volume:
Volume is moderate at 1.879M, and increasing volume during the breakout would provide confirmation of upward movement.
Trading Plan:
Bullish Scenario (Breakout Trade):
If the price breaks out above the resistance level of 0.0120 USDT with an increase in volume, this could signal a strong move upward.
Entry Point: Buy at the breakout above 0.0121 USDT with confirmation (strong bullish candle close above the resistance line and higher volume).
Target 1: 0.0140 USDT (short-term resistance).
Target 2: 0.0150 USDT (next major resistance).
Stop Loss: Set a stop loss below 0.0110 USDT (below the previous low and support of the descending channel).
Bearish Scenario (Rejection at Resistance):
If the price fails to break above the 0.0120 USDT resistance level and reverses, it could move back into the descending channel.
Entry Point: Consider shorting if the price rejects the resistance and starts to move lower, below 0.0118 USDT.
Target 1: 0.0110 USDT (previous support level).
Stop Loss: Above 0.0122 USDT (in case of a sudden bullish breakout).
Consolidation Scenario:
If the price consolidates between 0.0115 - 0.0120 USDT, wait for a clear breakout either upwards or downwards before entering a trade.
Risk Management:
Consider using a risk-reward ratio of at least 1:2 for your trades.
Position sizing should be managed to avoid overexposure. Only risk a small percentage of your portfolio on each trade.
This plan provides both bullish and bearish scenarios, with specific entry, exit points, and risk management strategies. Always ensure you monitor the price action and volume to confirm breakouts or rejections.
PEPE/USDT pair on Binance (1-hour timeframe) TA+TRADE PLAN BY BFPEPE/USDT pair on Binance (1-hour timeframe) Technical Analysis + TRADE PLAN by Blaž Fabjan
Chart Pattern: Falling Wedge
The falling wedge pattern is identified, which is typically a bullish reversal pattern. As the price converges downward, it indicates a potential breakout to the upside.
The pattern suggests that there might be a bullish move coming once the price breaks out of the wedge. The breakout has either happened or is about to happen as per the drawing.
Key Support and Resistance Levels:
Support Levels:
$0.00000066: This is a key support level, likely the bottom of the falling wedge pattern.
$0.00000070 and $0.00000076: Potential areas of support if the price retraces after the breakout.
Resistance Levels:
$0.000000807, $0.000000886, and $0.000000986: These are key resistance levels. Once the price breaks out of the falling wedge, it will likely face resistance at these levels.
$0.000001084 and $0.000001235: The upper resistance targets if the price momentum continues.
Indicators:
RSI (Relative Strength Index):
RSI is around 56, indicating that the market is in a neutral to bullish territory. If RSI increases above 70, it may indicate overbought conditions.
Stochastic Oscillator:
Stochastic Oscillator is around 85, indicating overbought conditions. However, during a breakout scenario, this might suggest strong momentum.
Volume:
There is a slight increase in volume, which is often seen during breakouts from chart patterns like falling wedges.
VMC Cipher B Indicator:
This indicator shows momentum and potential divergence. The convergence of the lines could indicate a bullish reversal.
Hull Moving Average (HMA) Histogram:
The HMA histogram shows a slight bullish divergence, supporting the case for a bullish breakout.
Trading Plan
Entry:
Enter the trade after a confirmed breakout from the falling wedge pattern, preferably on a candle close above $0.000000807 (the first key resistance level). Confirmation can also be supported by an increase in volume or further confirmation from RSI moving upward.
Stop Loss:
Place a stop-loss below the most recent support, around $0.00000070, to minimize risk in case the breakout fails or the price retraces back into the wedge.
Take Profit Levels:
First Target (TP1): $0.000000886 (next resistance level).
Second Target (TP2): $0.000000986 (another resistance level where the price may slow down).
Third Target (TP3): $0.000001084 (for more aggressive traders aiming for a larger move).
If you are highly confident in the bullish move, you can target $0.000001235, but ensure to trail your stop-loss once the price reaches the first target to lock in some profit.
Risk Management:
Risk-to-reward ratio should ideally be 2:1 or better.
Use 1-2% of your trading capital on this trade to manage risk effectively.
Monitor RSI and Stochastic Oscillator closely, as both are nearing overbought zones. If these indicators show divergence (i.e., price rising but RSI declining), be cautious of a false breakout.
Watch for any sudden shifts in volume; if volume drops after the breakout, it could indicate weakening momentum.
In case the price drops back into the wedge pattern or below support, consider exiting the trade to avoid further losses.
This trading plan aims to capitalize on the bullish breakout of the falling wedge pattern, but always ensure to use proper risk management.
Bitcoin/USDT on 1-hour timeframe Binance. TA+Trade plan by B.F.Descending Channel Pattern:
The price is trading within a descending channel. The upper boundary (resistance) and lower boundary (support) are clearly defined.
Descending channels typically indicate a bearish trend, but if the price breaks out of the channel, it could signal a trend reversal.
Possible Breakout to the Upside:
The chart highlights the possibility of a breakout above the descending channel, supported by a bullish blue trendline.
The breakout area is noted around the 61,758.48 USDT level. If the price moves past this level, it could lead to further upside momentum.
Volume:
Volume appears moderate, indicating that the market has yet to show a strong momentum surge. A breakout on higher volume would confirm the upside move.
Indicators:
VMC Cipher B Divergences: This indicator shows multiple green dots, suggesting bullish divergence and potential reversal.
RSI (Relative Strength Index): The RSI is in neutral territory around 58.66, indicating no extreme overbought or oversold conditions. If it crosses above 60, it may confirm the bullish breakout.
Stochastic Oscillator: The stochastic shows a bullish signal, with the %K line at 90.29 and the %D line at 88.42. However, it’s approaching overbought territory, suggesting caution as there could be short-term pullbacks.
HMA Histogram: Shows a slight downtrend in the short term (negative values). If it turns positive, it could confirm the breakout move.
Support and Resistance Levels:
Resistance 1: 61,758.48 USDT (upper boundary of the channel and key breakout level).
Resistance 2: 64,591.15 USDT (previous high, and next major resistance zone if the breakout happens).
Support 1: 60,301.68 USDT (lower boundary of the channel).
Support 2: 59,000 USDT (psychological support and lower range of the broader consolidation).
Trading Plan:
Long Position:
Entry: Enter a long position if the price breaks and closes above 61,758.48 USDT with a confirmation candle (preferably on higher volume).
Stop Loss: Set a stop loss below the descending channel or at the 60,301.68 USDT support level to limit downside risk.
Take Profit: The initial target would be the next resistance at 64,591.15 USDT. Partial profits can be taken here, with further upside potential if momentum remains strong.
Short Position (in case of failure to break out):
Entry: If the price fails to break above 61,758.48 USDT and falls back into the channel, consider a short position targeting the support at 60,301.68 USDT.
Stop Loss: Place a stop loss slightly above 61,758.48 USDT to protect against an unexpected breakout.
Take Profit: Target the lower boundary of the channel and potentially below, near 59,000 USDT.
Conclusion:
The overall structure indicates a potential breakout from a descending channel. A confirmed breakout above 61,758.48 USDT could signal a bullish reversal and upside toward 64,591.15 USDT. However, if the price fails to break out, it may continue to trade within the channel, offering short-term trading opportunities.
Monitoring volume and key levels (especially 61,758.48 USDT) will be crucial for confirming the next major move.
USDT.D Pulling back into Last Point of SupplyUSDT.D Update:
The markets pulling back as expected, this is as USDT.D pulls back into the range with some momentum, creating a bearish pullback in BTC and alts in conjunction with my prior BTC and USDT.D analysis
Nothing to be worried about, simply pulling back into the range forming a last point of supply in the distribution range on USDT.D and a last point of support on BTC in its range.
We still have some pain to come where i anticipate USDT.D to push higher into the areas marked up before seeing the reversal back bearish, what matters here is sticking to the plan and remaining patient.
If your not allocated in the market, this pullback will provide ample opportunity to get some exposure and risk on before the next bullish leg in the market as USDT.D breaks down out of this range. This will be one of the last chances you get to get in coins that are still priced in discounts relative to the HTF!
As price has pushed into this area im seeing an increase in volume from the latest 2 daily candles which is a good sign imo as we come into this key area and supply. However, theres no signs yet to suggest the trend on USDT.D is over and we remain bullish on the daily and 4h as we push into the range high.
As a result, im still expecting more pain in the market and red until USDT.D tops out and there is still room to the upside for it to push into as shown on the chart. I remain patient here and confident in my bias and idea still as nothing has changed at all.
There is a lot of resistance coming up on USDT.D and id be surprised to see it continue to the upside when theres a lot of levels to clear in this range as well as the prior resistance at 6.51% and the PSY at 5.90%. These areas key areas and im looking for USDT.D to reject from these areas, with high volume before breaking down from the 4h into the daily and then pro trend in line with the HTF picture as discussed here: free-analysis-channel.
Patience needed here and some confirmations from these areas over the coming week or so!
Never surprised, never worried and always composed 🫡
USDT.D Update - Oct 02 2024USDT dominance has followed previous analysis beautifully. The reaction to 5.3% zone was strong indeed and as a result the whole market dumped heavily.
The next important area ahead of USDT.D is 5.99% - 6.04% zone where a reaction can be expected but judging by the strength of the recent move, it's high possibility that USDT.D will push through the mentioned zone and will reach higher levels. So Sell strategy is advised for now.
Bitcoin Faces Bearish Pressure: Analysis Based on USDT.DAs of October 2024, Bitcoin appears to be entering a period of heightened bearish pressure, with USDT (Tether) market cap dominance signaling significant shifts in investor sentiment and risk management across the cryptocurrency markets. The USDT.D (USDT dominance) chart reflects market behavior that points towards reduced confidence in speculative assets such as Bitcoin, with the increase in USDT dominance indicating that traders are moving funds into stable assets. Let’s explore this in further detail, combining technical analysis with fundamental and geopolitical factors.
Sentiment Shift: USDT Dominance on the Rise
The chart indicates that USDT dominance is currently trending upward, hovering at around 5.7%. With a clear upward trajectory from its lows of 3.8%, this suggests that more market participants are parking their capital in USDT. This rising USDT dominance is often interpreted as a bearish signal for Bitcoin and other cryptocurrencies, as it implies that investors are seeking safety in stablecoins, rather than taking on the risk of volatile crypto assets.
Notably, the price action of USDT dominance is testing key Bollinger Band levels. The red bands, indicating higher volatility zones, suggest that there is a heightened probability of a further spike in dominance. As USDT dominance pushes higher into the Bollinger Band range, Bitcoin and other speculative assets face selling pressure. The chart shows a growing preference for stability, which coincides with Bitcoin's decreasing speculative appeal in the current environment.
Rising ATR: Volatility Building in the Market
The Average True Range (ATR) percentage on the chart points towards increased volatility, sitting at 32.6%, and climbing to a peak of 46.9%. This heightened volatility, indicated by the widening ATR band, signals increasing uncertainty in the market. Historically, such volatility is often followed by bearish moves for risk-on assets like Bitcoin.
As volatility grows, traders and institutions typically seek refuge in less volatile assets, pushing them towards USDT or other stablecoins. The increase in ATR% suggests a continued trend of traders reducing their exposure to Bitcoin in favor of more stable investments. The consistent rise in the ATR percentage alongside the growing USDT dominance strongly suggests that the market expects a period of heightened turbulence for Bitcoin.
Fundamental Analysis: Stubborn Inflation, Central Bank Tightening, and Institutional Pullback
Bitcoin’s bearish sentiment can be linked to broader macroeconomic factors, where persistent inflation and tight monetary policies continue to hamper speculative markets. Inflationary pressures remain a concern globally, especially in regions like the United States and Europe, where central banks have adopted a more aggressive stance to tighten monetary policies.
The Federal Reserve’s ongoing interest rate hikes, aimed at curbing inflation, have made riskier investments like Bitcoin less attractive. Higher interest rates reduce the appeal of speculative assets, as borrowing costs rise and liquidity contracts. The shift to USDT reflects the broader flight to safety as investors await a clearer signal from central banks regarding future economic stability.
Institutional interest in Bitcoin has also tapered. Many firms that entered the space during the 2021 bull market are now pulling back, reducing their exposure to cryptocurrencies. Institutions are becoming more risk-averse as concerns about tightening financial conditions, higher bond yields, and slowing global growth take center stage. This reduced demand from major market players further adds downward pressure on Bitcoin.
Geopolitical Factors: Global Uncertainty
Geopolitical instability is another critical factor weighing down Bitcoin's outlook. Ongoing conflicts, notably in Eastern Europe and the Middle East, have led to considerable uncertainty in global markets. Investors are now factoring in geopolitical risk alongside economic risk, leading to a preference for safer assets.
Additionally, regulatory scrutiny on cryptocurrency markets, particularly stablecoins and decentralized finance, has escalated over the past year. US regulators, for example, are increasing oversight on Tether and other stablecoin providers, but ironically, this has not diminished the market's reliance on USDT as a safe haven. The market's trust in Tether amid rising scrutiny indicates a broader retreat from volatile assets like Bitcoin and a preference for liquid, USD-pegged stablecoins.
Moreover, China’s continued crackdown on cryptocurrency activities and Europe’s regulatory frameworks have dampened enthusiasm in the space. These geopolitical tensions contribute to the bearish outlook, as regional instability and regulatory pressures keep risk appetite low.
Bitcoin's Path Forward
Considering these factors, Bitcoin faces significant headwinds in the near term. The chart analysis, with rising USDT dominance and escalating volatility, presents a clear bearish picture. Coupled with the current macroeconomic and geopolitical backdrop, Bitcoin is likely to experience downward pressure as market participants continue to seek safety in USDT.
The combination of central bank tightening, heightened global risk, and regulatory challenges makes it difficult for Bitcoin to regain the speculative momentum it enjoyed during previous bull markets. While Bitcoin has historically shown resilience, its ability to recover in the current environment looks increasingly uncertain.
In conclusion, the growing dominance of USDT in the crypto market reflects a broader shift away from risk assets like Bitcoin. With rising volatility and macroeconomic challenges, the bearish pressure on Bitcoin is likely to persist in the coming months, barring any major shifts in the global financial or regulatory landscape. Investors should remain cautious and consider hedging strategies as the cryptocurrency market enters a more uncertain phase.
HelenP. I Bitcoin will make retest and then continue to declineHi folks today I'm prepared for you Bitcoin analytics. If we look at the chart we can see, how the price trades inside the resistance zone, but later turned around and dropped to the support level, breaking the 64000 level. After this, the price tired to grow, but failed and in a short time declined below a support level, which coincided with the support zone and fell until the trend line. Next, BTC turned around and started to grow, and later backed up to the 57500 level, broke it, and continued to move up next. But later it made a correction to the trend line, which coincided with the support level and then rebounded up to the resistance level. Price some time traded near this level and then broke it, after which rose even higher than the resistance zone. But a not long time ago BTC turned around and dropped to the trend line, which coincided with the 64000 level and recently broke it. Now, I expect that BTCUSDT will make a retest of the trend line and then continue to decline next, therefore I set my goal at 60K points. If you like my analytics you may support me with your like/comment ❤️
Bitcoin can decline a little and then start grow to 64500 levelHello traders, I want share with you my opinion about Bitcoin. Observing the chart, we can see that the price entered to range, where it at once dropped to the support level, which coincided with the buyer zone and then rebounded up. In a short time later, BTC reached a resistance level, which coincided with the seller zone, and then turned around, after which it started to decline. BTC declined to the 57000 support level, and broke it, thereby exiting from range, but soon turned around and started to grow inside the upward channel. Inside the channel, the price reached the 57000 level again, broke it, and continued to move up next. Some time later BTC reached a resistance level, which coincided with the seller zone, broke it, but quickly turned around and dropped, breaking the 64500 level and exiting from the channel also. Now, BTC continues to decline, so, I think that price can fall a little more and then start to grow to a resistance level. For this case, I set my TP at a 64500 resistance level. Please share this idea with your friends and click Boost 🚀
Bitcoin (BTC/USDT) 4h timeframe TA+Trade plan by BFDescending Broadening Wedge
Pattern Description: This is a bullish reversal pattern. As shown, the price of Bitcoin is testing the support line of the wedge, which typically suggests that a breakout to the upside might occur after the completion of the pattern.
Potential Breakout: The chart indicates a potential breakout above the upper boundary (resistance line) of the wedge, possibly signaling the beginning of an upward move.
Key Support and Resistance Levels
Support Levels:
60,301.68 USDT: This is a near-term support zone where price could find buyers if it revisits these levels.
53,988.89 USDT: A deeper support level shown on the chart, which might come into play if Bitcoin faces a significant sell-off.
Resistance Levels:
64,591.15 USDT: A strong resistance zone that Bitcoin would need to surpass for a sustained upward move.
68,556.87 USDT: A higher resistance level that could become the target in the case of a breakout.
Indicators Analysis
VMC Cipher B Divergences: It appears to show divergence. A green dot below indicates potential bullish divergence, suggesting price may increase soon.
RSI (Relative Strength Index): The RSI is at 31.48, which indicates oversold conditions. This level usually implies that the asset is undervalued, signaling a potential buying opportunity.
Stochastic Oscillator: The stochastic reading is at 23.61 (blue line) and 20.43 (red line), indicating oversold conditions as well. This adds further strength to the bullish argument, aligning with the RSI's signals.
HMA (Hull Moving Average): The HMA histogram shows green bars, suggesting a bullish trend might be forming or momentum is starting to shift to the upside.
Trading Plan
Long Position Setup
Entry:
A breakout above the resistance line of the descending broadening wedge would be the ideal entry signal. You may consider entering around 61,750–62,000 USDT.
Take Profit:
First take-profit target could be around 64,591 USDT (resistance zone).
If momentum is strong, a secondary target can be set around 68,556 USDT.
Stop Loss:
Place a stop loss just below the recent low at 60,000 USDT, as a break below this level would invalidate the bullish wedge pattern and signal further downside.
Alternative (Cautious) Approach
Wait for confirmation of a breakout with a strong candle close above the wedge's resistance line, paired with bullish indicators on lower timeframes (e.g., 1-hour chart).
Risk Management:
Risk no more than 1-2% of your portfolio on this trade, adjusting position size accordingly.
Final Considerations
Monitor for any false breakouts as Bitcoin could retest the wedge's resistance line before confirming the breakout.
Keep an eye on volume; a breakout with strong volume increases the likelihood of the wedge pattern playing out successfully.
Bitcoin Dominance Chart Update !!The Bitcoin Dominance Weekly Chart presents a comprehensive long-term view of BTC dominance.
Bitcoin dominance is moving within a long-term rising channel. The upper and lower trendlines of the channel have been tested multiple times, indicating a well-respected structure.
BTC dominance is approaching a key resistance zone between 57-58%. This zone has acted as both support and resistance in the past, as highlighted by the yellow box.
The recent upward momentum suggests a potential challenge of this resistance zone, but failure to break above it could lead to a reversal.
If BTC dominance is rejected from this resistance, it could start trending downwards within the channel, potentially retesting lower levels around 40-45% (as indicated by the red dotted line).
A decline in BTC dominance could signal strength in altcoins, as capital may flow from BTC to other cryptocurrencies.
If Bitcoin dominance breaks above the 58% resistance zone, we could see further gains up to the next major resistance near 64-65%, as suggested by the green dotted line.
This breakout would signify BTC outperforming other cryptocurrencies, potentially signaling market consolidation around Bitcoin.
This weekly chart is critical for understanding broader crypto market movements, as BTC dominance plays a key role in determining capital flows between Bitcoin and altcoins.
Would you like any further details or adjustments to this analysis?
Disclaimer: This analysis is for informational purposes and is not financial advice. Always stay updated with market movements and adjust your trading strategies as needed.
You can DM us for information on any other altcoin.
@Peter_CSAdmin
USDT Dominance Rebounded from the Support!Hello Traders,
I hope you are all doing well.
USDT dominance has rebounded as per our previous analysis. It bounced perfectly off the 5.20% support trendline, causing BTC and other altcoins to drop.
If the dominance continues to rally from here, be prepared for a significant market crash. On the positive side, this could present a good opportunity to buy BTC and some altcoins at lower prices.
For now, consider staying in USDT and avoiding high-leverage long trades. Be cautious and always conduct your own research before investing.
Thanks.
USDT.D Wyckoff Distribution Profile - Bullish Q4 Upon UsUSDT.D Distributing as BTC accumulates.... The Perfect Storm and great times ahead in Q4 are upon us!
As BTC sets up in its accumulation range near perfectly aligned to the accumulation schematic i shared prior.
USDT.D is setting up near perfectly according to the Wyckoff distribution schematic too, which is no surprise as their relationship is inverse.
A pullback is needed and forming in the market, forming phase 3 of the profile into last points of support and last points of supply.
Phase D to follow - The expansion out of the range, leading us into a beautiful Q4!
Just as BTC looks to be in an accumulation range, USDT.D looks like its forming a local distribution range as expected at these levels and as ive said plenty of times prior.
When I delve into the daily TF it becomes more apparent and easier to see, just like it is on the BTC accumulation range.
USDT.D has pushed into the FVG i was looking at and come lower into the range lows and closed bearish on the daily below the prior swing low indicating weakness.
USDT.D is naturally having a pullback now after taking SSL and filling all the FVGs in the range, and BTC and the market is also having a pullback as this trends up with it being inverse.
As im seeing this as a distribution range, i expect this to push back into the upper bound of the range into supply and form a last point of supply in a distribution profile, before continuing bearish pro trend and truly breaking to the downside throughout Q4. This is the same as my BTC analysis where im looking for a BTC pullback into a LPS before continued upside into new ATHs.
This in turn sets us up for a bullish Q4 in the market as USDT.D breaks down bearish pro trend and into the HTF targets around 3.73%, whilst BTC pushes into new ATHs alongside a bullish market.
We are not prepared enough for whats to follow 🚀
Usdt Dom & Where is the market going on?Usdt Dom 1D chart;
First of all, we see that it is at the bottom level within the ascending channel.
If it closes below the level I indicated as +OB, the trend direction will change downwards.
However, since this has not happened yet, we cannot say that this chart will fall.
It is exactly this level that makes me think the most.
So what exactly am I waiting for?
If the day closes below +OB, a decline may come down to the white trend line at the bottom. This is exactly the 3.23% level. If this happens, I will not delay my purchases.
However, if it sticks to the trend channel it is in and an upward reaction comes from here, it is possible to rise up to the 6% level first.
Now you know exactly what this means.
$USDT.D chartOne compelling metric to help make decisions when buying or selling crypto assets is the CRYPTOCAP:USDT.D chart (Dominance of CRYPTOCAP:USDT over other assets). Accordingly, the higher the indicator, the more money flows into CRYPTOCAP:USDT from other crypto assets.
Looking at the two graphs, it's hard not to notice a simple pattern: the higher CRYPTOCAP:BTC , the lower CRYPTOCAP:USDT.D , and vice versa.
CRYPTOCAP:USDT.D is currently testing the important level of 5.26%. Accordingly, money will now be transferred from crypto assets to $USDT.
This is a +1 factor, and it's time for a CRYPTOCAP:BTC correction.
If you like the content, become a ❤️ and invite your friends.
GRT New Bullish Impulse StartedGRT has had two significant bullish impulses over the last two years. With price action picking up again over the last two weeks, I'm betting that we're seeing the start of the third GRT impulse.
Note the bottom dotted support line. This has held for the last two years, and is likely to do so for the time being.
I'm looking for a move towards 1$. Stop below the recent swing low.
HelenP. I Bitcoin can rebound up from support zone to $67KHi folks today I'm prepared for you Bitcoin analytics. Some days ago, the price rose to support 1, which coincided with the support zone, broke it, and even rose a little more. But soon it turned around and started to decline inside the downward channel, where it broke support 1 again and fell to support 2. Soon, BTC broke this level too and dropped to the trend line, after which turned around and started to move up near the trend line, exiting from the downward channel. Price quickly rose to support 2, broke it, and even rose a little higher after this, but later BTC made a correction movement below the trend line. After this movement, the price rose higher than the trend line and continued to move up to support 1. When BTC reached this level, it broke it and some time traded in the support zone, until it broke the trend line one more time. A few moments ago BTC bounced up to this line and at the moment trades very close to the trend line. In my mind, BTCUSDT will correct to the support zone and then rebound up to the trend line. Then it can break this line and continue to move up, therefore I set my goal at 67000 points. If you like my analytics you may support me with your like/comment ❤️
USDT.DOMINANCE 1DAY CHART UPDATE !!The chart displays an ascending channel (white lines) where USDT dominance has been trending upward since around April. The price has touched both the support and resistance lines multiple times, indicating that USDT's dominance is respecting this pattern.
Currently, USDT dominance is at 5.27%, near the lower bound of the ascending channel. The chart suggests this is a potential support level, and the price may bounce from here based on previous behavior.
The yellow line could represent a moving average, which is currently sloping upwards, further supporting the potential for a continued increase in dominance.
The green curve suggests a possible bullish path, leading USDT dominance to potentially rise to the 6.60% level, possibly aiming for the 7.00% mark as indicated by the upper brown box.
The brown zone around 7.00% has historically been a resistance level. The area between 4.56% (orange line) and the lower red zone has acted as significant support.
This suggests a likely increase in USDT dominance in the coming weeks, with a potential upside toward the 6.60-7.00% zone. Would you like a more detailed interpretation or further analysis of its potential market impact?
Disclaimer: This analysis is for informational purposes and is not financial advice. Always stay updated with market movements and adjust your trading strategies as needed.