USDT.D 3DUSDT.D ~ 3D Analysis
#USDT.D The movement we expect,. There is still an opportunity for further increase for Crypto, if USDT.D starts down. The dominance of the USDT dropped, meaning that more USDT was exchanged for Crypto.
Usdtd

When Bitcoin Goes Up, Tether Dominance Goes Down!I was wondering, does the Tether Dominance (USDT.D) index chart supports a bullish Bitcoin and a bullish Altcoins market? It does. Let's look at this chart together.
Bullish volume has been dropping steadily. Bearish volume is very high.
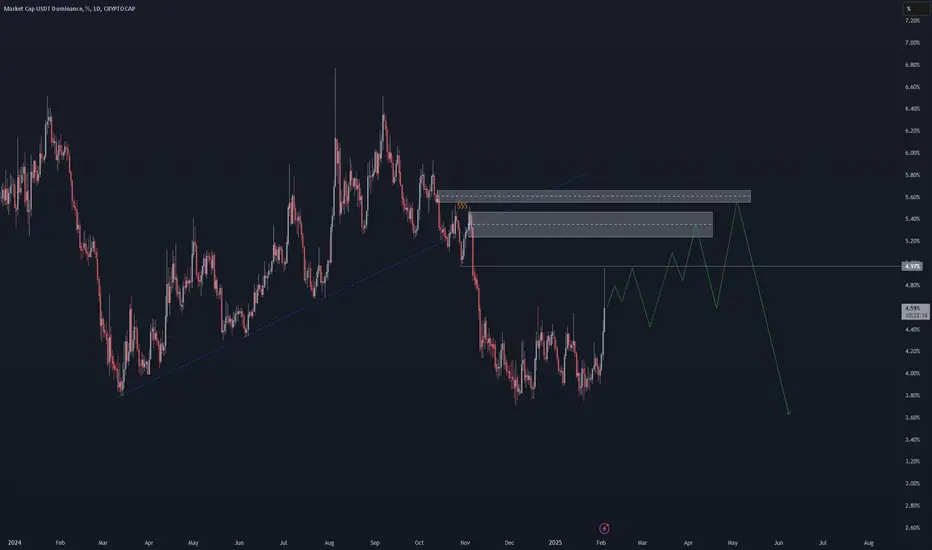
Tether Dominance has been in a downtrend, lower highs, since August 2024. Obviously, when Bitcoin hit bottom, USDT.D peaked. This index has been producing lower highs since. There is a clear downtrend on the chart.
A bearish hammer came on the 28-Feb. session. This is followed by another bearish signal 4-March. A continuation. Lower highs long-term and lower highs short-term.
The chart is pointing lower, has been going lower and will continue lower. This means that Bitcoin is going up.
Thank you for reading.
The signals are everywhere.
Namaste.

USDT.D Macro Update ( Alt Season ? )everything on the charts
I'm still holding my alts
For traders, this is one of the best charts in town (to find local tops and bottoms for potential swing opportunities)
This tells the whole story
If Invalidation occurs, I'll reconsider all my traders.
(not in the mood of writing much, check out the previous posts for more explanation + everything's on the chart)

BTC.D - Alt Season (Rotation from BTC to ALTS about to begin)only 3 charts you should care about from now = BTC.D , USDT.D and Total 2 (/3/others)
strong utility tokens will win from here
CRYPTOCAP:BTC is weak, (IT WILL DEFINITELY HAS ITS LAST RALLY THOUGH - check out my EW count and the target I've been speaking since 5th Aug)
either it consolidates here and complete its subwave 5 of macrowave 5 later or do it now and distributes later, the time for alts to shine has come...
Few more weeks of pain left. I don't recommend selling here, keep the HODL
but rotation has almost started... whales are taking profits on Bitcoin and time for our shitcoins to outperform from here...
PS. We might see new lows (than 3rd Feb) but the RR is not worth it, never sell in the middle (unless you are invalidated)
Look at the Macro chart for in-detailed analysis on BTC.D I did a few weeks ago

USDT the big rebound - The Rise from the Ashesin my newest finding i will tell you about USDT rise from the Ashes
as you can see we build a very volume heavy low
corresponding to a low in March and a really good rebound is about to happen
be prepared for heavy downturns in the crypto market
as always, just my opinion and looking for ppl who share thougths on it
no trading advice

$BTC Macrolast idea remains intact—we are still bullish. Alts have held strong while BTC plunged. (I don’t own any BTC, and neither should you above $100K.)
I predicted the exact $15.5K bottom on X, as well as the August 5th crash and bottom. Unfortunately, I wasn’t on the charts in December and missed the biggest, clearest signal on USDT.D for a potential local top, which otherwise would have 2x'd my current portfolio but mistakes were made)
BTC taking the hits while alts hold steady is a strong sign that whales are taking profits from Bitcoin and preparing for "rotation".
Most traders believe the cycle is over—and there are valid reasons for that (some of them are):
- A monthly bearish engulfing candle
- A structure resembling the 2021 top, suggesting one last rally before the bear market
- Worst of all, double bearish divergence on the monthly, which worries me too
However, there are strong counterarguments.
The biggest? The cycle has never topped with BTC.D this weak. That’s why I’m still leaning toward a bullish scenario until proven otherwise.
Update on the above chart:
The parabola is intact with a beautiful reaction. That doesn’t mean we can’t still visit the red box—there’s only air between them—but I’m holding, and that remains my primary scenario.
Alts can make new lows, but RR isn’t worth it. As I’ve said before, the time to sell spot bags has passed. You don’t sell in between unless invalidation occurs.
Timing is everything. We failed to time this market, assuming it would mimic past cycles—but everyone was wrong. Traders won this cycle, while investors (except BTC holders) struggled... until now, at least.
ONLY DIFFERENCE BETWEEN BOTH SCENARIOS (MENTIONED ON CHART) FOR ALTS?
You have to wait way longer on the second scenario but both would take us to our goal.
Worst case? We break and HTF close on USDT.D - last hope, officially ending bull market!

Possible Bearish CypherStronger RSI shows us that USDT.D is stronger than the previous bottom.
Therefore, a rise towards point D would not be surprising.
For those expecting a bull market in altcoins, point D may be the real altcoin buying point.
First target to the D point %7.49
Bearish cypher target %1.59
* What i share here is not an investment advice. Please do your own research before investing in any asset.
* Never take my personal opinions as investment advice, you may lose all your money.

USDT.D H8 : Important Chart for Crypto market Hi Guys,
Hello friends
Perhaps it can be said that the most important chart in the crypto market these days is the Tether chart. It can help you a lot in your trading.
SecondChanceCrypto
⏰ 26/FEB/25
⛔️DYOR
Always do your research.
If you have any questions, you can write them in the comments below and I will answer them.
And please don't forget to support this idea with your likes and comments.

USDT.D is getting strength what next..?USDT dominance CRYPTOCAP:USDT.D is showing signs of breaking above the resistance zone after successfully retesting the 100 EMA. If this breakout sustains, it signals a shift toward stablecoins, indicating lower risk appetite among traders.
This is generally a bearish sign for altcoins, as rising USDT.D suggests capital is flowing out of riskier assets. If confirmed, we could see increased selling pressure across the altcoin market.

BTC Updateeverything swept the lows on 3rd Feb except BTC
maybe that was it?
still holding everything and next is 120k's hopefully
Alts I'm holding didn't make new lows (than 3rd Feb)
I still don't believe we'll hit that Double Top Target and reverse from here soon enough.


USDT.DThe trend of Tether's dominance is both downward and several times it hit our main resistance in order to collect the necessary liquidity for the fall. Bitcoin, in my opinion, will not fall so much, but Bitcoin may be able to register a new ceiling, the market is bullish.

ETH UpdateAfter the brutal 3rd Feb drop (explanation in USDT.D chart - link at the end of post), the downward wedge failed but EW count is still valid
I've explained in detail what I'm expecting in this year. Please refer to the previous posts for in-depth analysis and thoughts. Too tired to write anything now :)
TLDR for the lazy ones: Late Feb-April, I'm expecting a massive rally. 100% loaded here personally!

MACRO Crypto Cycle - Alt Seasonthis is what I'm expecting this year BUT
Follow the LTF analysis, we'll use this just for reference as it's pure speculation to predict until 2026
let's keep playing level by level

BTC.D Update = What happened to the ALT SEASON?I had this possibility on the back of my mind but didn't think it'd play out since things are much different this time
I obviously missed the last downward movement (even though I had it marked on USDT.D + some alts)
PS. Trust me, BS news you see is just an excuse. It's almost always in the chart (in this case, tariffs) = This is how I was able to predict 5th August bottom (in that case, it was the Japanese Yen news but in reality, it's all in the chart but I missed it this time and I'll accept it, I was too busy so never looked at it.. the reason I stopped posting after November)
It would be wonderful if you guys interact and keep things on your panel too!

USDT.D (how to find local reversals? no alt season this cycle?) sorry I forgot to post it here a week ago after the crash
I had that shit marked (small green box for a powerful reversal), which hit in the first week of December, but I forgot to check it out—lol, was too busy with other things = can anyone at least remind me or everyone's a lazy ass like me, these days?
Anyway, it was a perfect local top indication (USDT.D along with other macro charts are the best possible indicators for local top/bottom. One must capture these beautiful reversals where you have at least 80% of confidence, to accumulate more and more of your favorite tokens)
Trust me, BS news you see is just an excuse. It's almost always in the chart (in this case, tariffs) = This is how I was able to predict 5th August bottom (in that case, it was the Japanese Yen news but in reality, it's all in the chart but I missed it this time and I'll accept it, I was to busy so never looked at it.. the reason I stopped posting after November)
Good thing we still haven't reclaimed the macro trendline.
and look what happens after such long wicks into resistances ... (5th August one, 22nd Jan, and last year's)
and CT getting bearish? I get it that normie retails are fearful but good big CTs ???
This cycle really is different...
LOWER it now !!! (obviously there are many other confluences I've found but I'm too lazy to mention all that here)
PS. Yes, there will be an alt season and it will catch many off guard since most have lost hope and capitulated already.
It would be wonderful if you guys interact and keep things on your panel too, so we don't miss any market movements!!! I don't Trade full time, it's just 1/4 of my gigs

$ZRO Structure changed but I'm obviously still bullish
we're going way higher (next post on clarification of what happened? sorry I forgot to post here earlier... my bad)

Bad news... Tether Dominance is bullish!#usdt #tether dominance made W bounce in about 1 year period and in weekly candle stick size, #usdtd also formed bullish divergence. This movement seems not good for #crypto and #altcoins in mid term.

Tether Dominance still looks bullish#tether #usdt dominance chart the #usdtd looks bullish and may aid the wick it left upside. Bullish CRYPTOCAP:USDT dominance is bearish for #altcoins and #btc

The Secret Chart To Unlocking ALTSEASONBTC.D + USDT.D + USDC.D
Once we overcome this cumulated hurdle, we head to VALHALLA .

Called move after move for Bitcoin, what happens next?If you been lucky enough to work out my analysis and pull the trigger on the trade setups that played out over and over again, I commend you for your knowledge of how to read an analysis and then use it to make an informed decision.
If you caught the last analysis I mentioned about a bear trap spike below the blue line and as you can see it played out. You can see I have removed the green trendline on left chart as it is now done with and the green trendline on the right hand side chart is basically invalidated now.
We see on the left chart the orange trendline is respected with the candle closing above it. The white major trendline also held as major support. You can see the other trendlines still being used, especially on 4 hour timeframe.
So, what now?
We need to watch for the right hand side RSI to breakdown under the red trendline for BTC to get to 108k.
On the left chart the RSI needs to break back above trendline. In regards to the price action, we can see a massive buy up in the crash candle that was just made. Price could move up to 108k from here now there are trapped short traders below. This would put the right USDT.D chart at the blue trendline and as per previous analysis we know what happens if that then breaks below this line.
On the bearish side, if price loses the light green vwap line then expect another retest of the white trendline.
Smash the like button and good luck!

USDT.D: Roadmap for Crypto MarketHi Guys,
As I have mentioned many times, the crypto market is no longer in a bear market. One of the best indicators for analyzing this market is Tether dominance. According to the chart analysis, I can imagine lower prices for Bitcoin, maybe we will have a look at the $75,000 range in Bitcoin, and continue to follow my analysis of Bitcoin.
SecondChanceCrypto
⏰ 3/FEB/25
⛔️DYOR
Always do your research.
If you have any questions, you can write them in the comments below and I will answer them.
And please don't forget to support this idea with your likes and comments.
USDT Dominance is bouncing!#usdt #tether dominance has been defended the support zone very well above green line i drew on chart and now there' s chance that #usdtd may have a hard bounce. The invalidation: CRYPTOCAP:USDT dom. loses the green line with weekly closings.
