TradeCityPro | USDT Dominance Key Levels & Market Impact👋 Welcome to TradeCityPro!
In this analysis, I will break down USDT.D, one of the most critical indicators in crypto, which reflects the amount of money held in Tether dominance.
🔑 The higher the dominance, the more altcoins are being sold and converted into USDT. Conversely, when dominance decreases, USDT is being sold and converted into other cryptocurrencies. As a result, this chart usually moves inversely to Total2 and other crypto assets—when USDT dominance rises, Total2 typically declines, and vice versa.
📅 Weekly Timeframe
In the weekly timeframe, we observe an uptrend that followed an ascending trendline. However, after getting rejected at the 8.68 resistance, the trendline was broken, initiating a bearish leg that closely followed a descending curved trendline, reacting strongly to it. After reaching 3.87, the price made a deep pullback to the previous ascending trendline. Given the PRZ formed by the confluence of the trendlines, the 6.20 resistance, and the SMA99, the next bearish leg began.
🔍 Currently, the price has once again reacted to 3.87 and pulled back to the curved trendline. If this zone holds as resistance, the probability of 3.87 breaking on the next test increases significantly, potentially triggering the next bearish leg. This leg could extend down to 2.61, although considering the current liquidity in USDT, such a deep drop seems unlikely but remains technically possible.
🔼 If the curved trendline is broken and the trigger activates at 4.61, the price may form a consolidation box between 3.87 and 6.20. Upon breaking 4.61, we could see a movement toward the top of the range. The SMA99 has been a strong dynamic resistance, with multiple price reactions to it, so it could play a key role if USDT dominance increases.
📅 Daily Timeframe
In this timeframe, we see an accumulation box forming between 3.87 and 4.36, which was broken a few days ago. If the price stabilizes above 4.36, a move toward 4.99 is likely, with the ultimate target at 6.20, as mentioned in the weekly timeframe.
📉 If the price re-enters the accumulation box and this breakout turns out to be a fake move, strong bearish momentum could enter the market, significantly increasing the probability of a 3.87 breakdown.
✨ There are no other notable points in the daily chart—this timeframe has provided clear triggers. Now, let’s move on to the 4-hour timeframe for futures trade triggers.
⌛️ 4-Hour Timeframe
In this timeframe, we can see the recent price movements in more detail. As shown, the price has formed a key resistance at 4.60, which could be a decisive level. If this area is broken, it will confirm the accumulation box breakout, increasing the likelihood of a move toward 4.99.
✔️ On the other hand, if the price drops below 4.44 and re-enters the accumulation box, the entire upward move will be invalidated. In that case, breaking 4.23 could trigger further declines, leading to a test of the bottom of the accumulation range.
📝 Final Thoughts
This analysis reflects our opinions and is not financial advice.
Share your thoughts in the comments, and don’t forget to share this analysis with your friends! ❤️
Usdtdominance

USDT Dominance - Short-Term Analysis (1H)The correction appears to be a symmetrical pattern. This formation is suspicious, and we should expect the possibility of this index reaching the upper red box.
Once wave i is completed, a major stop hunt on altcoins will occur, allowing the market maker to accumulate more liquidity.
Let’s see what happens.
For risk management, please don't forget stop loss and capital management
Comment if you have any questions
Thank You

TradeCityPro | Bitcoin Daily Analysis #1👋 Welcome to TradeCityPro!
This is the first analysis in the Bitcoin series on the channel, which will be uploaded daily. In this series, we will analyze futures triggers that can provide us with positions on the same day. Therefore, most of the analyses will be conducted in lower timeframes.
✨ However, in today’s analysis, I will also cover Bitcoin in higher timeframes since this is the first analysis and needs to be comprehensive.
📅 Weekly Timeframe
In the weekly timeframe, we see a strong uptrend where the last leg started from the 54,900 bottom and moved up to the 104,700 resistance. The candle volume has been mostly bullish, aligning with the uptrend.
🔍 Currently, the price is resting below the 104,700 resistance, and the last weekly candle, which closed just yesterday, resembles a rolling pin, indicating indecision among buyers and sellers as the price moved both up and down but ultimately closed in a range.
💥 In RSI, there are two crucial support levels. The first is at 61.85, which RSI is currently near, and if it reacts positively to this level, a new bullish momentum could enter the market. The next support is at 43.90, a critical level for market momentum. As long as RSI stays above this level, bullish momentum remains in the market.
🔼 For the next bullish leg to start, RSI likely needs to enter the overbought zone, attracting more buyers and initiating the next wave. In terms of price action, breaking the 104,700 resistance would be the best trigger for the next move.
⚡️ On the other hand, the price has so far corrected to the 0.236 Fibonacci level near 90,000 and still has the potential for further corrections. If it continues, the next support levels are at the 0.382 and 0.618 Fibonacci zones, which overlap with 81,800 and 70,000, respectively.
📣 Since this series will have daily updates and we will analyze the weekly timeframe after each weekly candle closes, I won’t discuss lower supports or higher resistances until the time is right.
📅 Daily Timeframe
In the daily timeframe, the price is ranging between 91,925 and 106,612. As seen, the price has been rejected from the range high for the second time and has dropped to 96,312.
🧩 Bearish momentum has been decreasing since reaching the 96,312 support, and a rounding formation is gradually forming. A positive aspect is that if Bitcoin establishes a bottom in this zone and moves toward the range high again, it will create a higher low compared to the 91,925 support, increasing the chances of a breakout to the upside.
📊 The volume of the last red candles in the bearish leg has been quite low. In the two recent green candles from yesterday and today, the volume is also very low, meaning the price might soon start its movement. So, it’s best to move to lower timeframes to find a suitable futures trigger.
⌛️ 4-Hour Timeframe
In this timeframe, I won’t analyze much but will instead focus on identifying futures triggers.
🔽 For a short position, the setup is quite clear. There is a solid trigger at 95,798, which the price has tested multiple times, making it a reliable trigger. Since this short position is being opened within the range and near the range low, it should be taken quickly and secured at low risk-to-reward ratios like 2 or 3. It is not an ideal trigger for a long-term trade.
📈 For a long position, the first trigger was the breakout of 97,304, which has already happened, and the price has confirmed above this level. If you haven’t taken a position on this breakout, you can enter on a pullback if a suitable candle forms or if there’s a trigger in lower timeframes. Keep in mind that this trigger is the riskiest, so enter with minimal risk.
✔️ The next long trigger is at 98,937, which is more reliable. If the price stabilizes above this level, we can expect a bullish leg toward the range high.
⌛️ 1-Hour Timeframe
In this timeframe, as seen, the price is pulling back to the 97,304 level while engulfing the previous red candles. RSI is also stabilizing above 64.12. If the candle closes as it is, a long position will be suitable. The key resistance level is at 99,730.
📉 For a short position, the trigger remains similar to the 4-hour timeframe. However, since the price has faked this level in this timeframe, we should wait for another reaction at this area to confirm the actual trigger point.
⭐️ Now, let's analyze the dominance charts. A full dominance analysis will be provided separately. The Total2 analysis will be posted tonight, and the USDT.D and BTC.D analyses will be done tomorrow, but for now, they will be reviewed in the 1-hour timeframe.
⌛️ BTC.D Analysis
In the 1-hour timeframe, we see Bitcoin dominance increasing after reaching the 61.34 bottom, which has contributed to Bitcoin’s recovery following the fake breakdown at 95,798.
👑 If dominance stabilizes above 62%, more money will flow into Bitcoin. In this scenario, if the market moves upward, Bitcoin will rise more than most altcoins, and if the market drops, Bitcoin will decline less than others. The main resistance is at 62.66.
💫 On the other hand, if dominance falls below 61.34, less money will enter Bitcoin. In a bullish market, Bitcoin will underperform altcoins, and in a bearish market, Bitcoin will drop more significantly.
⌛️ Total2 Analysis
In the 1-hour timeframe, the 1.22 level in Total2 overlaps with 97,304 in Bitcoin. However, as seen, Total2 is still below this support and hasn’t confirmed above it yet. The reason is the increasing Bitcoin dominance, causing altcoins to move less than Bitcoin.
☀️ The main resistance in Total2 at this timeframe is 1.28, which is also the key long trigger.
🔽 For a short position, Total2 offers a better trigger than Bitcoin. If Total2 breaks below 1.16 while Bitcoin dominance increases, shorting altcoins will be a better option than Bitcoin.
⌛️ USDT.D Analysis
As seen, the candle has closed below the 4.51 support in this index, and it has more overlap with Bitcoin than Total2.
✔️ The trigger for an increase in USDT dominance is 4.64, which would lead to a market decline. The alignment of this trigger with the short triggers in Total2 and Bitcoin could provide strong confirmation for those trades.
🔑 For a long position, breaking below the 4.40 support in this index would be a good signal. The main support is currently at 4.22, and if this level is broken, the market could begin its next bullish leg.
📝 Final Thoughts
This analysis reflects our opinions and is not financial advice.
Share your thoughts in the comments, and don’t forget to share this analysis with your friends! ❤️

USDT Dominance - Short-Term Analysis (1H)In lower and smaller timeframes, it appears that USDT dominance has entered a correction. This correction started from the point where we placed the red arrow on the chart.
It seems that the candles are currently in wave B.
A bearish wave C is expected, which could push the candles toward the TP levels.
The closure of a 4-hour candle above the invalidation level will invalidate this analysis.
For risk management, please don't forget stop loss and capital management
Comment if you have any questions
Thank You

The Secret Chart To Unlocking ALTSEASONBTC.D + USDT.D + USDC.D
Once we overcome this cumulated hurdle, we head to VALHALLA .

USDT Dominance + USDC Dominance 1WIMPORTANT!
CRYPTOCAP:USDT Dominance + CRYPTOCAP:USDC Dominance
These two dominances show us the cash position in the market. This is the crudest expression.
With the rise of this chart, we can see that there is an increase in cash transitions in the market or hot money inflows to the market.
In my previous post, I shared information that there may be a movement from the bottom to the falling trend line (red) above. Because this possibility was much higher. The reason was that it made a double bottom formation, supported by the rising trend line (green) and also pointed to a harmonic pattern.
With the OB level on the daily chart, the price retreated with the falling trend line (red) acting as resistance. With its retracement, the upward movement on the BTC side was realised. Because as it is known, this chart works in inverse correlation with the BTC chart.
If this chart continues its upward movement, that is, if it breaks the falling trend line and provides a movement towards 11% levels, then we can see much deeper declines on the BTC side.
Let me add one more comment to overlap here;
On the BTC side, I have been emphasising that I have an expectation of $123k - $130k for the first batch for a long time. So if this chart moves one round lower than these levels, to the bottom of the rising trend line (green), it is possible to see the levels I mentioned on the BTC side. Then again, the dominance chart will now move upwards and may cross the red line, which is the falling trend line, and move towards 11% levels.
Of course, there are other OB resistances on the route, and a pre-bullish retest will probably do. This gives misleading information that the decline on the BTC side is over.
If BTC really returns from the level I mentioned above and moves as I explained in this chart, there may not be a second spring in the market until it reaches 11% levels.

Called move after move for Bitcoin, what happens next?If you been lucky enough to work out my analysis and pull the trigger on the trade setups that played out over and over again, I commend you for your knowledge of how to read an analysis and then use it to make an informed decision.
If you caught the last analysis I mentioned about a bear trap spike below the blue line and as you can see it played out. You can see I have removed the green trendline on left chart as it is now done with and the green trendline on the right hand side chart is basically invalidated now.
We see on the left chart the orange trendline is respected with the candle closing above it. The white major trendline also held as major support. You can see the other trendlines still being used, especially on 4 hour timeframe.
So, what now?
We need to watch for the right hand side RSI to breakdown under the red trendline for BTC to get to 108k.
On the left chart the RSI needs to break back above trendline. In regards to the price action, we can see a massive buy up in the crash candle that was just made. Price could move up to 108k from here now there are trapped short traders below. This would put the right USDT.D chart at the blue trendline and as per previous analysis we know what happens if that then breaks below this line.
On the bearish side, if price loses the light green vwap line then expect another retest of the white trendline.
Smash the like button and good luck!

$USDT February Local Top Hit!well well well... look at that.
TA PERFECTION 💯
Should I start charging for my calls? 😂
I couldn't imagine anyone not following my account at this point 🧐
(see prior USDT chart for the original call).

USDT DOMINANCE Update (8H)Wave G extended, and the market maker executed the worst-case scenario.
As it hit the resistance zone, a very heavy rejection is expected. Keep in mind that reaching the lower green zone will take several months, with significant fluctuations along the way, but it seems to be following the yellow circle.
Both Tether dominance and Bitcoin dominance have reached important levels. For now, the focus should be on looking for buy/long setups on altcoins over the coming months.
For risk management, please don't forget stop loss and capital management
Comment if you have any questions
Thank You

USDTDOMINANCE CHART UPDATE !The chart highlights USDT dominance (USDT.D), which is used to measure market sentiment and money flow into or out of stablecoins such as USDT
The chart shows a completed “head and shoulders” pattern, which is often considered bearish in technical analysis.
The neckline has been broken, indicating the possibility of further declines.
The price appears to be testing a descending triangle, which could indicate a continuation of the decline.
The green area below (possibly around 2.5%-3%) could act as a crucial support if dominance continues to decline.
The 50-day (red) and 200-day (green) moving averages are plotted.
Dominance is trading below both moving averages, which reinforces bearish momentum.
A breakdown of the current triangle could lead to further declines towards the marked support area.
If you found this analysis helpful, hit the Like button and share your thoughts or questions in the comments below. Your feedback matters!
Thanks for your support!
DYOR. NFA

Tether Dominance Update (8H)This analysis is an update of the analysis you see in the "Related publications" section
First of all you should know that "USDT Dominance" is always moving inverse of BTCUSDT .
According to the previous analysis, wave G has formed, and the price is now dropping.
For the next move, there is a possibility of a pullback toward the red box, followed by a deeper correction.
Overall, the price could drop further.
For risk management, please don't forget stop loss and capital management
Comment if you have any questions
Thank You

USDT dominance on verge of breaking down!!Join our community and start your crypto journey today for:
In-depth market analysis
Accurate trade setups
Early access to trending altcoins
Life-changing profit potential
Let's analyze USDT dominance :
USDT dominance (USDT.D) recently failed to break below its support level of 3.83%. This failure led to a surge in USDT.D, pushing it up to the 4.28% level. However, it encountered resistance at 4.28% and was subsequently rejected, returning to the 3.83% support level.
A sustained break below this 3.83% support level, confirmed by a daily close below it, could potentially trigger a significant upward movement for Bitcoin (BTC), possibly leading to a price target of $120,000.
Support Levels:
3.82%
Resistance Level:
4.28%
If you find this analysis helpful, please hit the like button to support my content! Share your thoughts in the comments and feel free to request any specific chart analysis you’d like to see.
Happy Trading!!

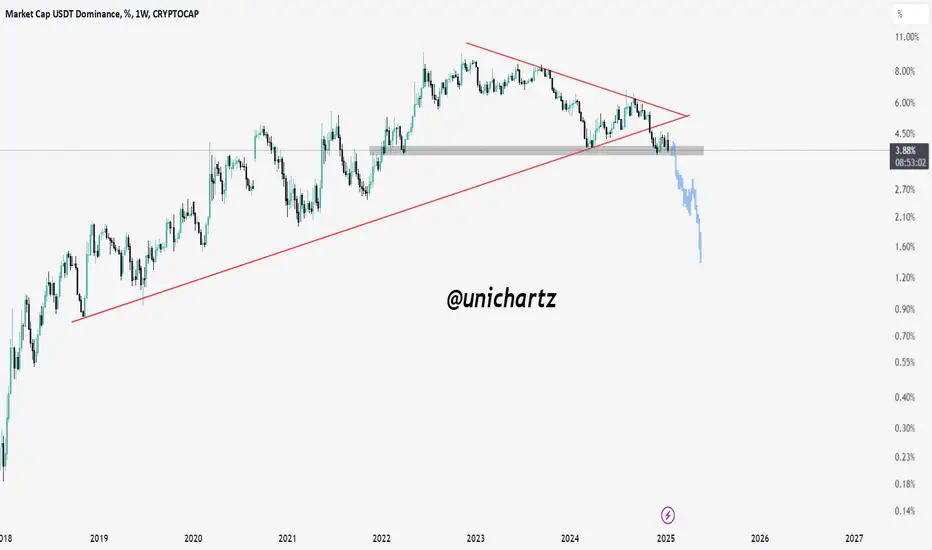
USDT Dominance Breakdown = Crypto Rally?USDT dominance has broken a long-term trendline and is now testing a critical support zone around 4.0%. If it drops below 3.8%, we could see a strong shift towards a risk-on environment, fueling a major rally in Bitcoin and altcoins.
However, if this level holds, we might see temporary consolidation before the next move. Historically, a decline in USDT dominance signals capital rotation into crypto, increasing the chances of an altseason breakout.
The coming days are crucial—watch this level closely!
Thank You!

USDT.D at Key Support: Will Altseason Ignite?USDT.D Weekly Analysis:
Key Zone: USDT.D is trading at a critical support zone, with a successful retest of the broken trendline confirming bearish momentum.
Bearish Potential: A breakdown could lead to a 48% drop in dominance, paving the way for an altseason as funds rotate out of stablecoins.
Bullish Risk: If the support holds, bearish momentum could stall, delaying the altcoin rally.

Bitcoin breakout as USDT.D breaks down, is it happening now?Refer to previous analysis in links below.
As you can see USDT.D is now trying to break below the trendline that caused 3 flash crashes in a row. Will it be confirmed by the end of the day's candle or will this be a bull trap and the candle wicks back above the trendline and then a flash crash? We watch and see. Easy trade for both short and long here with stop loss that cuts off the loser and the winner runs.
Don't forget to smash that rocket like button or give me your take in the comments below.

USDT Dominance (USDT.D)USDT Dominance (USDT.D)
The USDT Dominance chart reflects the percentage of the cryptocurrency market capitalization held in Tether (USDT), providing insights into market sentiment and risk appetite. Here's an analysis based on the chart structure:
Key Levels and Observations:
Supply Zone at 6.50%:
The 6.50% level acts as a critical resistance where the "Bull vs Bear Flip" is observed. This zone marks the upper limit of a supply area, where sellers are dominant.
A rejection here could signal an increase in market risk appetite as funds flow out of USDT and back into crypto assets.
Demand Zone at 3.63%:
The 3.63% level serves as a strong demand zone, historically supporting USDT.D during bearish periods in the broader market.
This is marked as the lower boundary of the "Bull vs Bear Flip," indicating increased caution if revisited.
Median Level at 4.48%:
The chart highlights the 4.48% level as the median point, balancing bullish and bearish sentiment. Current price action is hovering around this zone, signaling indecision and a potential breakout or breakdown.
Harmonic Pattern Formation:
A harmonic pattern is evident, with key retracement levels at 0.449 and 0.734 marking the price's journey from points X, A, B, C, and D.
Point D, near 3.63%, aligns with the demand zone, completing the pattern and triggering a potential bounce.
Rounded Bottom Formation:
A rounded bottom is visible on the left side of the chart, indicating a previous reversal from bearish to bullish sentiment. This reinforces the importance of the 3.63% level as a long-term support.
Bear Zone at 2.83%:
Below the demand zone lies the 2.83% "Bear Zone," signaling extreme bearish sentiment for USDT dominance and likely strong risk appetite in the crypto market.
Scenarios to Watch:
Bullish Scenario:
A breakout above the 4.48% median and sustained movement toward the supply zone at 6.50% would signal increased market caution as investors move to USDT.
If the 6.50% level is breached with volume, USDT.D could trend higher, indicating market-wide fear or profit-taking in crypto.
Bearish Scenario:
A breakdown below the 4.48% median would confirm bearish momentum, with the next target being the demand zone at 3.63%.
A fall below 3.63% could lead to a retest of the 2.83% "Bear Zone," indicating renewed bullish sentiment for crypto assets.
Volume Analysis:
Recent volume spikes during the recovery indicate significant interest at current levels.
However, diminishing volume near resistance suggests hesitation among market participants, requiring confirmation of the next directional move.
Conclusion:
The USDT Dominance chart is currently in a state of equilibrium around the median level (4.48%), reflecting market indecision. The next significant move will likely depend on whether the supply zone (6.50%) or demand zone (3.63%) is tested first. Traders should watch for volume confirmation and macroeconomic catalysts for the next trend in risk sentiment.

USDT.D : Roadmap For crypto market with USDT Hi Friends,
As you can see in the Tether chart, we did not reach the previous low, but Bitcoin managed to experience its highest price. This is also a type of negative divergence. Please be very careful with Bitcoin. The market is very emotional.
SecondChanceCrypto
⏰ 20/Jan/25
⛔️DYOR
Always do your research.
If you have any questions, you can write them in the comments below and I will answer them.
And please don't forget to support this idea with your likes and comments.

Crypto is going highUSDT.D is quite weak lately.
If a red candle closes below the pink box, you can buy more crypto.
This is just for entertainment to hit "Play" in the future and see how right or wrong I was :)

What is the current structure of USDT.D (8H)?This analysis is an update of the analysis you see in the "Related publications" section
It seems the structure is a diametric, and wave F is nearing completion. Wave F was a bearish wave.. A bullish G wave remains in this structure. Let's see which direction the market will take.
For risk management, please don't forget stop loss and capital management
Comment if you have any questions
Thank You

USDT.D Retests Breakdown: Is a Strong Altcoin Rally Ahead?USDT Dominance (USDT.D) has broken below its rising trendline and is trading at a key support zone after a successful retest of the breakdown. A break below this support could trigger a sharp decline, signaling capital rotation into altcoins.
This setup aligns with the potential for a strong altcoin season and an active trading period ahead.
The broader outlook of Tether dominance (8H)First of all you should know that "USDT Dominance" is always moving inverse of BTCUSDT
Many are asking about a broader perspective on Tether dominance. Our outlook from a zoomed-out perspective is as follows.
The green zone is very strong and unbreakable!
For risk management, please don't forget stop loss and capital management
Comment if you have any questions
Thank You

USDT.D Time To say byeit was a hard week and the price of the market got crazy
but that's fine bcz all was shared over here
the handle and cup pattern has been drew long time ago , and now it's confirming
just a little bit and the order block gonna break.
Good luck happy trade

USDT.D UPDATE (12H)This analysis is an update of the analysis you see in the "Related publications" section
No need to open sell/short positions or close buy/long positions
Based on previous analyses, we anticipated that there wouldn't be a significant upward move for Tether dominance. We are not truly bullish on Tether dominance. If the price returns to the yellow circle, we can look to rebuy or add volume on altcoins and Bitcoin.
For risk management, please don't forget stop loss and capital management
Comment if you have any questions
Thank You
