TradeCityPro | Bitcoin Daily Analysis #118👋 Welcome to TradeCity Pro!
Let’s dive into the Bitcoin analysis and key crypto indexes. As usual, in this analysis, I’ll review the futures triggers for the New York session.
⏳ 1-Hour Timeframe
On the 1-hour timeframe, the price remains within the same range box between 108619 and 110256, and it is currently sitting at the bottom of that box.
✔️ Since yesterday, market volume has significantly declined — as you can see, there's practically no real volume in the market.
⭐ On the other hand, it seems the 108619 trigger is about to be activated, and price may move downward. However, personally, as long as market volume stays this low, I prefer not to open any positions.
📊 If we see selling volume entering the market following a break below 108619, I’ll consider opening a short position. But in the current situation, as mentioned, I prefer to stay out of the market.
💥 The RSI oscillator is steadily and gradually declining like a waterfall. This is also due to the lack of volume in the market, which has led to very low price volatility.
⚡️ So for now, it's better not to rely on RSI data because without volume, RSI readings won't be useful.
📈 If the price gets supported at the 108619 level with a good buying volume and starts moving toward 110256, the chance of breaking that level will increase significantly.
👀 If that happens, I’ll personally try to open a long position once 110256 breaks. But I think today, Saturday, and Sunday will remain the same in terms of market conditions, and real volume will likely return starting next week.
👑 BTC.D Analysis
Moving on to Bitcoin Dominance, a descending trendline can be drawn here, which has been tested twice and is now being approached again.
☘️ If BTC dominance gets rejected from this trendline and moves downward, it will likely reach the 65.04 support level. If the trendline breaks, the next resistance will be 65.64.
📅 Total2 Analysis
Looking at Total2, you’ll notice it’s showing more bearishness than Bitcoin and has lost the support it formed at the 1.15 level.
💫 This happened because BTC dominance has been rising since yesterday, which means more money has been flowing into Bitcoin than into altcoins.
🔼 The next support level for Total2 is at 1.13, and a potential downside move may reach this zone. The suitable long trigger remains a break above 1.17.
📅 USDT.D Analysis
Finally, USDT Dominance has exited the range box it had formed and climbed back above the 4.78 level.
🎲 If this upward move continues, the next major resistance will be 4.90. However, if this move turns out to be fake, the short trigger for a bearish reversal will be a break below 4.72..
❌ Disclaimer ❌
Trading futures is highly risky and dangerous. If you're not an expert, these triggers may not be suitable for you. You should first learn risk and capital management. You can also use the educational content from this channel.
Finally, these triggers reflect my personal opinions on price action, and the market may move completely against this analysis. So, do your own research before opening any position.
Usdtdominance

USDT DOMINANCE New Update (4H)This analysis is an update of the analysis you see in the "Related publications" section
The green box from the previous analysis was engulfed, and a new demand zone has been added to the chart.
Before the main drop, we still expect a pullback from this index
For risk management, please don't forget stop loss and capital management
Comment if you have any questions
Thank You

TradeCityPro | Bitcoin Daily Analysis #117👋 Welcome to TradeCity Pro!
After nearly 20 days of inactivity on this channel, we’re back with our regular analyses. As the first post in this new round, I’ll continue the Bitcoin series and present analysis number 117.
✅As usual, the analysis is done on the 1-hour timeframe to identify potential futures triggers for the New York session.
📰 Before diving into the charts, let’s briefly look at the market fundamentals. Over the past three weeks, we’ve had the news of the conflict between Iran and Israel. Aside from the initial couple of days, it didn’t have a significant impact on the market, and eventually, the market stopped reacting to it. Right now, the two countries have agreed to a ceasefire and seem to be negotiating.
🔍 In my opinion, the market is unlikely to care anymore whether this war continues or not. Whether they reach an agreement or not probably won’t make a big difference to the market.
🔑 The other major event was the Federal Reserve meeting. Everyone was expecting Jerome Powell to provide some clear outlook regarding US monetary policy, but once again, that didn’t happen. Powell didn’t provide any meaningful data.
📊 This uncertainty led to minimal market volatility and prevented any strong legs from forming, with no significant volume entering the market as everyone was waiting for Powell’s remarks. Since that didn’t yield much, the market remains indecisive for now.
💥 We’ll have to wait and see what kind of impactful news comes in the future. Until then, it’s best to remain patient.
⏳ 1-Hour Timeframe
On the 1-hour chart, you can see a bullish move that started from the 105370 zone, and with strong buying volume, price broke through 108619 and reached the top of 110256.
✨ Currently, price has only wicked into 110256 and hasn’t shown a decisive reaction to it yet. If it revisits this zone, we’ll be able to observe its real reaction to the supply level.
🔔 The current support zone is 108619, which has already received a bounce, forming a range box between 108619 and 110256.
📈 If the 110256 level breaks, the upward move could continue with another bullish leg.
🔽 For short positions, the first trigger would be a confirmation below 108619. But for a more reliable short, I would wait for the price to form a lower high and a lower low below that zone before entering.
👑 BTC.D Analysis
Bitcoin dominance is currently hovering around a key support at 65.04. A key resistance sits at 65.64, which would be the first trigger for bullish continuation.
⭐ The main breakout level for starting a new bullish trend in dominance would be 65.97. For bearish confirmation, a break below 65.04 would suffice.
📅 Total2 Analysis
Looking at Total2, a range box has formed between 1.15 and 1.17, with price oscillating in between.
🧩 Momentum is currently bullish, and there’s a high chance of breaking above 1.17. If this level is broken, we could see another bullish leg and a long position would be valid.
📉 For shorts, a break below 1.15 would be the first signal, but I personally prefer to wait for a clearer trend change before entering any short positions.
📅 USDT.D Analysis
USDT dominance is also ranging between 4.72 and 4.78, very similar to Total2.
📊 A break below 4.72 would confirm a bearish move, while a break above 4.78 would indicate bullish continuation for dominance.
❌ Disclaimer ❌
Trading futures is highly risky and dangerous. If you're not an expert, these triggers may not be suitable for you. You should first learn risk and capital management. You can also use the educational content from this channel.
Finally, these triggers reflect my personal opinions on price action, and the market may move completely against this analysis. So, do your own research before opening any position.

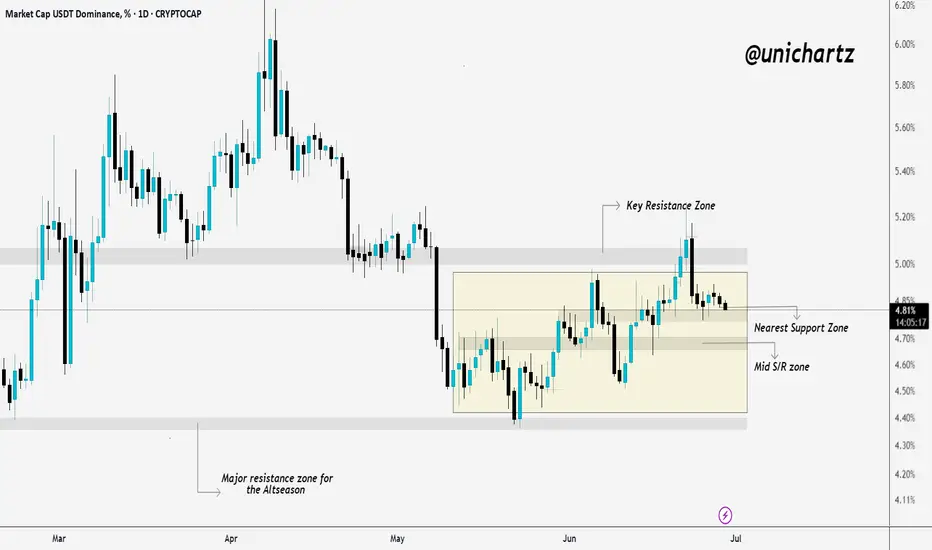
USDT.D Showing Signs of Bounce – Altseason at Risk?USDT Dominance is still moving within a rising parallel channel, holding just above the nearest support zone. After a brief dip, price is now showing signs of recovery from the lower boundary of the channel.
However, the key resistance zone near the top of the channel has proven tough to break — it rejected price on the last attempt.
Until we get a clear breakout or breakdown from this channel structure, the market may remain choppy. A breakout above 5.00% could signal risk-off sentiment (bad for alts), while a drop below the support zone may trigger altcoin momentum.
Stay cautious — the market is still undecided.

USDT Dominance Consolidating — Major Move Loading?USDT dominance is currently stuck in a sideways range between key resistance and strong support zones.
We’ve seen a rejection from the upper resistance, and now price is drifting toward the nearest support. If this zone holds, expect another bounce. If it breaks, altcoins could finally catch a strong bid — possibly the early signal for altseason.
No rush here. Just keep your eyes on that mid S/R level. It’s a key battleground.
$USDT.D: Bearish ChartCRYPTOCAP:USDT.D | 3D
Price action on USDT dominance has been significantly cleaner than CRYPTOCAP:BTC in recent weeks, providing much clearer pivot signals.
On the 3-day chart, we can see that the 5% level has turned into a strong supply zone and is currently being rejected. If the price fails to reclaim the 5% level, it will likely move back down toward the 4.30% level.
Outlook: Expecting CRYPTOCAP:BTC to sweep local highs while CRYPTOCAP:USDT.D remains bearish.
Potential downside levels: 4.5% and possibly even 3.90%


$PEOPLEUSDT Eyes 83% Upside – Watch This BreakoutBINANCE:PEOPLEUSDT is forming a bullish falling wedge on the 6H chart.
Price bounced from key support and is approaching the resistance line. A breakout could trigger a strong move toward $0.03160
Watch for confirmation.
DYRO, NFA

$C98USDT Breakout Setup – 225% PotentialC98USDT is holding the bottom of a long-term falling wedge on the weekly chart, a key support zone.
A bounce from here could push the price up by over 225% toward the upper resistance trendline, located around $0.1175.
Strong setup, but wait for confirmation.
DYRO, NFA

$PENGU Breakout RetestCSECY:PENGU broke above the downtrend and is now retesting the breakout zone.
Holding this support could trigger a 28.91% move higher. Structure remains bullish above this level.
DYRO, NFA

USDT DOMINANCE New Update (4H) First of all you should know that "USDT Dominance" is always moving inverse of BTCUSDT .
In this analysis, we want to examine this index on lower timeframes. It has reached a support zone and a trendline.
Ideally, we should see a pullback from the green box toward the red box.
There is a high chance of price rejection from the red box to the downside, which could lead to a bullish move in the market.
Let’s see how the price reacts to the red box.
For risk management, please don't forget stop loss and capital management
Comment if you have any questions
Thank You

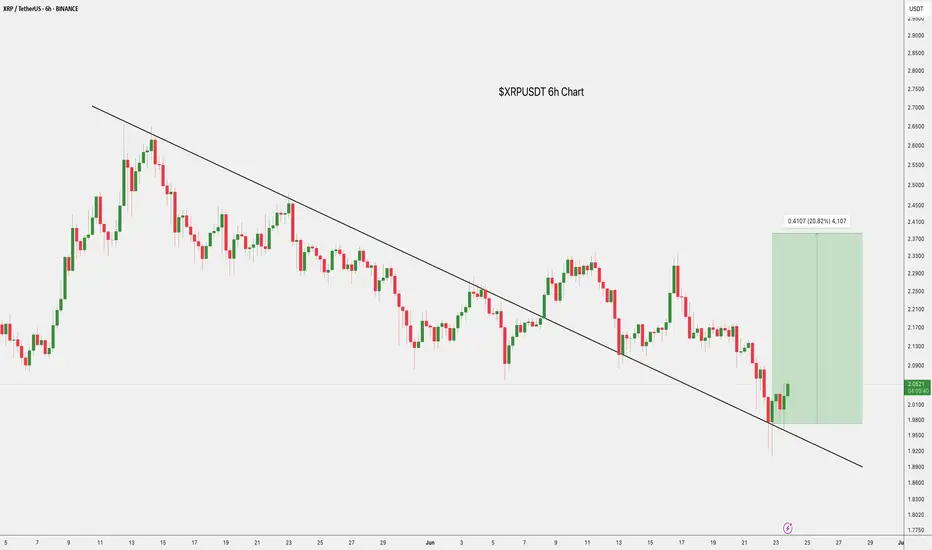
$XRP Trendline Breakout: +20% TargetCRYPTOCAP:XRP has broken out of a long-term descending trendline on the 6H chart, signaling a potential trend reversal.
Price is now holding above the breakout zone around $2.00, with a bullish target near $2.45, a potential 20% move.
Holding this support could fuel further upside.
DYRO, NFA
$FORM/USDT Breakout.$FORM/USDT just reclaimed a key demand zone after a breakout below the trendline.
The strong bullish candle signals a possible reversal, with upside potential toward $3.4456.
As long as the price holds above $2.6072–$2.7054, bulls are in control. MACD also hints at a momentum shift.
DYRO, NFA

$USDT.D Reversal Incoming USDT.D is facing rejection at key resistance near 5% within a descending wedge.
If the trendline holds, we could see a sharp - 35% drop, a strong bullish signal for altcoins and the possible start of altseason.
DYOR, NFA

USDT.D LONG - MID TERM PLANUSDT.D is one of the best tools to understand what's happening in the crypto market.
It shows the dominance of USDT across the entire space — and has a strong inverse correlation with BTC and crypto assets.
Technicals:
USDT.D is approaching its long-term support trendline.
I expect a deviation below that line — possibly toward the 0.75 Fibonacci level — before a strong move up.
That move could last 1–3 months, which means more downside for alts during this time.
Plan:
Shorting altcoins — especially ETH-related tokens and memecoins.
Looking to buy back around early August.

USDT Dominance Update (2H)The USDT Dominance (USDT.D) chart — often referred to as the “reverse chart of crypto” — is currently showing signs of strength. On the micro time frame, a new impulsive wave structure has emerged, and we are likely progressing through wave 3 of this formation.
Wave 3 appears to be targeting the 4.88% level.
A minor correction (wave 4) may follow.
Ultimately, wave 5 is projected to reach the 5.00% zone.
Market Implications:
If this scenario unfolds as expected:
Bitcoin could down toward the $100,000–$101,000 range.
However, altcoins may face a sharp correction, with potential losses of 15–20%, exacerbated by the rising BTC dominance and capital flow concentration.
⚠️ While macro bullish momentum remains intact for the market, this short-term USDT.D surge could present a temporary but significant shakeout, especially across the altcoin sector.
— Thanks for reading.

BTC.D + USDT.D + USDC.D > FLIGHT TO SAFETY SurgingStructures are being broken across the board 🚨
Looks like the Flight to Safety chart is closing the week at a new cycle ATH.
Should push to 74% before we see a meaningful turn around.

Do you wanna see the bigger picture? (USDT.D Analysis 12H)After counting many waves for many days, I have a senario for USDT dominance which will lead the entire market on its way.
For those whose not fimiliar with this parameter, there is a very simple explanation.
It's the reversed way to see the market. If this parameter drops, your alts will skyrocket and if it rises, you're gonna be crying on somebody's X post's comments.
First of all, the short term wiev is bearish. We are currently in an impulsive wave 3 which is expected to be hardest for altcoins at the moment. There will be crash unless the value of this parameter drops below %4.50 and invalidates the analysis (you'll like this senario better, trust me).
All right, we got rid of the scalpers who bothered to read this far and now I'm here to explain what I see for the golden future.
Currently, USDT.D is forming a BEARISH impulsive wave for higher time frames. As long as you stick with 4H candles, you won't be able to see it.
USDT.D is trying to forming its bearish flag, by doing so it will be its second wave and will prepare its very own collapse.
Last summer, BTC has done the same thing (Check for daily time BTC).
There is more.
If we calculate the depth of this incoming flag pattern, breaking this flag would lead USDT to %3.75 which is the yearly support (Check in weekly, you'll see it).
If we calculate the time needed to past for this flag to work, it's the same amount of time needed for previous flag to break from last summer.
We also need to add fundementals in it. Currently people started to talk about a senario which will lead world to WW3. I don't think that will happen. But the problem in here is it will market throguh downside.
Furthermore, there is FED.
FED is insisting to leave interest rates on its own without a change. I believe that we won't be seeing any rate cuts till the end of this summer.
I believe that the FED will cute rates between Agust and September. This will be the fuel for our rocket to fly and ignite the wave 3.
I know it's a long script but you know it's necessary.
Thanks for reading.

USDT DOMINANACE ANALYSIS (12H)This analysis is an update of the analysis you see in the "Related publications" section
First of all you should know that "USDT Dominance" is always moving inverse of BTCUSDT .
I correctly identified the upward movement in Tether Dominance in the previous analysis, but with the news of war in the Middle East, there are now bullish triggers for this index.
It is expected that the price will at least surge upward toward TP1.
Avoid opening impulsive and emotional positions, especially without proper risk management and setting a stop-loss | this is a dangerous market.
For risk management, please don't forget stop loss and capital management
When we reach the first target, save some profit and then change the stop to entry
Comment if you have any questions
Thank You

USDT Dominance on the Verge of Breakout — Major Market Warning?The USDT Dominance chart is flashing early warning signs — a breakout above 4.97% resistance could spell trouble for the broader crypto market.
Key Observations:
Strong uptrend from 4.51% base, respecting the rising trendline
Testing multi-week resistance at 4.97%
RSI (1H): 74.3 — entering overbought zone
Higher highs with accelerating momentum
If USDT.D breaks and sustains above 4.97%, it suggests:
Risk-off sentiment increasing
Traders rotating from crypto into stablecoins
Potential dump across major altcoins & BTC
Conclusion:
Keep your guard up. A USDT.D breakout typically front-runs broader crypto weakness. We’re at a make-or-break level.
DYOR | Not Financial Advice

$BTCUSDT Eyes $120K After Key Support BounceBTCUSDT is holding strong above the ascending trendline and key support near $104K.
A fresh bounce suggests bullish momentum, with potential to break the $110K resistance.
If that happens, the next target could be around $120K. Trend remains bullish above support.
DYRO, NFA

USDT.D Original idea inspired by trader SpartaBTC — highly recommend checking out their page.
On the chart, we can clearly see a descending channel. Historically, every time the price touched the upper boundary and started moving down toward the lower one, it marked the beginning of a broader crypto market rally.
Potential targets are shown on the chart.
