Changes to the stablecoins USDT and USDCUSDC market share has fallen from 34.88% to 23.05%
Over the past 1 year, USDC market share has fallen from 34.88% to 23.05%, with market cap dropping from a peak of $55 billion to $29 billion. BUSD's market share has plummeted from 11.68% to 4.18%, while Dai has kept its participation rate at 3.66%, down from 4.05% in May 2022. USDT, on the other hand, moved in the opposite direction, with stablecoin market dominance rising to 65.89% from 47.04% a year ago. Its market cap soared to $83.1 billion, the
In a recent interview with Bloomberg, Circle CEO Jeremy Allaire blamed the decline in stablecoin market cap on the crackdown on cryptocurrencies by US regulators. The current environment in the US seems to be working in Tether's favour.
Usdtdominance

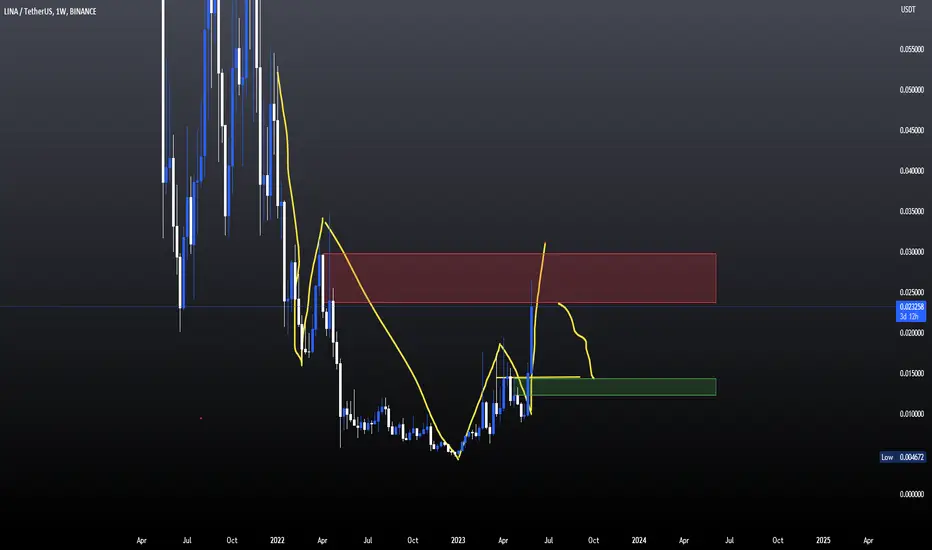
TETHER DOMINANCE brief gain 💣🚀Hello 🐋
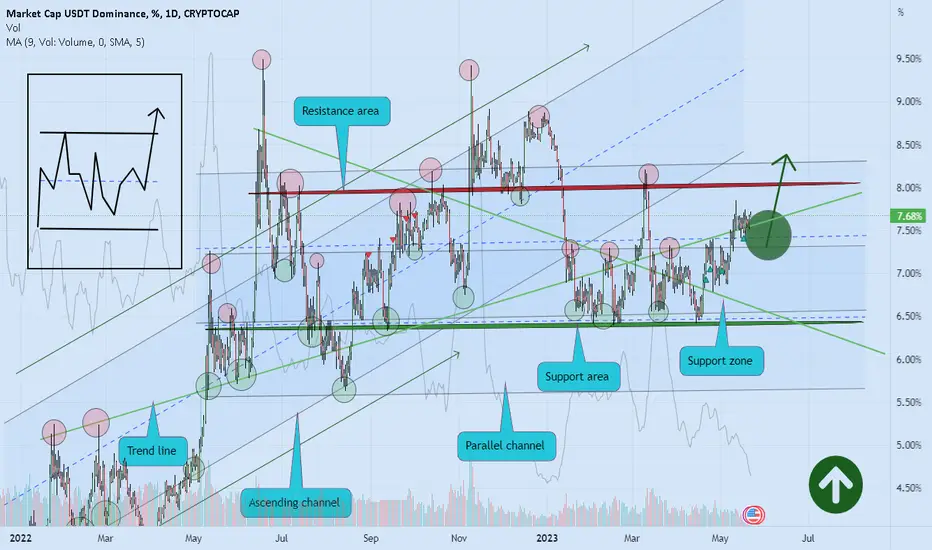
Based on the chart, the price is close to the support area and parallel channel support ✔️👌
if
the price doesn't break the support zone to the downside, we will see brief gain again 💣🚀
and
in long time more correction expected 💣🚀💣
👌 Notice: pay attention to the price on shortcut chart (located above the main chart with black colour) 📖💡
Please, feel free to share your point of view, write it in the comments below, thanks 🐋

Keep an eye on $LINA/USDTKeep an eye on $LINA/USDT
Making LL HH currently on LH region
Kindly wait for breakout of the structure and target region marked
Did you find this crypto market analysis helpful? Stay updated about the latest crypto market update.
Please continue to follow my analysis and feel free to ask any queries, you may have. I am here to assist you.
TradingView: @FarmanBangashh

Market Cap Chart: Money MovementHello?
Traders, welcome.
If you "Follow", you can always get new information quickly.
Please also click "Boost".
Have a good day.
-------------------------------------
(USDT chart)
(USDC chart)
Looking at the USDT chart, it can be seen that a lot of money is flowing into the coin market, rising above the previous high of 82.467B.
However, if you look at the USDC chart, you can see that there is a constant outflow of funds.
I think this movement can be interpreted as individual investors' funds are constantly flowing into the coin market, but institutional investors are leaving their funds out of the coin market.
The reason why USDT is interpreted as an individual investor is that it is used as a channel through which individual investors can easily move funds because USDT supports trading pairs on exchanges around the world.
In particular, the main power of this USDT is expected to be Chinese funds.
USDC is still a stablecoin that has limited support for trading pairs on exchanges around the world.
Therefore, I think it is highly likely that the forces that move funds through this USDC are American funds.
I think the leadership of the coin market has shifted from Chinese capital to American capital.
This move is expected to make the coin market a transparent investment market.
However, as the possibility of being affected by movements in the capital market increases, the volatility is expected to gradually decrease.
-------------------------------------------------- ------
(BTC.D chart)
Looking at the BTC dominance chart, a volume profile is formed in the 47.64-48.80 section and the 56.78-61.73 section.
So, if it rises above 48.80, I would expect it to rise around 56.78-61.73.
I think that the reason why it starts to be affected by the movements of the world economy is because, as explained in USDT and USDC, American capital is leading the coin market.
The variable for this movement is that funds from individual investors are continuously flowing into the coin market.
This influx of funds is expected to drive the upward trend of the explosive coin market at some point.
This explosive rise will drive the rise in BTC price, which is expected to increase BTC dominance.
Therefore, I think we should observe the flow under the premise that BTC dominance will rise around 56.78-61.73.
It is actually unknown whether the price of BTC will rise or fall due to the rise in BTC dominance.
This is because BTC dominance can tell whether funds are concentrated in BTC or altcoins.
This is because the concentration of funds is relative, so if a lot of funds are withdrawn from the altcoin, BTC dominance may rise.
Therefore, I do not think it is correct to interpret that BTC price will rise as BTC dominance rises.
-------------------------------------------------- --------------
(USDT chart)
I think the first chart you should come across to understand the Coin Market Cap chart is the USDT chart.
This is because USDT has the highest market cap among stablecoins and has become an important stablecoin that supports trading pairs on exchanges around the world.
Therefore, I think that the change in USDT dominance can be used to understand the overall trend of the coin market.
When USDT dominance declines, the coin market is likely to show an uptrend.
Thus, USDT dominance allows you to know how to proceed with a trade depending on whether it is a rising or falling candle.
Since these movements are likely to move against the BTC price chart, they can help interpret BTC price fluctuations.
If USDT dominance rises above the 7.86-8.25 range, the coin market is likely to plunge.
This is because the current section is an important section.
-------------------------------------------------- -------------------------------------------
** All descriptions are for reference only and do not guarantee profit or loss in investment.
** Even if you know other people's know-how, it takes a considerable period of time to make it your own.
** This is a chart created with my know-how.
---------------------------------

Keep an eye on $PHB/USDTKeep an eye on $PHB/USDT.
Falling wedge formation in 1hr timeframe.
Did you find this crypto market analysis helpful? Stay updated about the latest crypto market update.
Please continue to follow my analysis and feel free to ask any queries, you may have. I am here to assist you.
TradingView: @FarmanBangashh

USDT 2H SHORT 🔴The Tether chart enters the channel in the 2-hour time frame after the spike and completes its pullback to the previous trendline, and after that there is a high probability of falling.
Make money 💡✌️

CRYPTO TOTAL MARKET CAP DALILY HI Guys Hope you well,
On a daily basis, we are seeing a demand zone, but I am waiting to test the Green support level for the third time as well. And then we can see a rapid upward movement.
SecondChanceCrypto
⏰23/May/23
⛔️(DYOR)
always do your research.
If you have any questions, you can write them in the comments below, and I will answer them.
And please don't forget to support this idea with your likes and comment.

TETHER DOMINANCE brief gain 💣🚀Hello 🐋
Based on the chart, the price is close to the support area and parallel channel support ✔️👌
if
the price doesn't break the support zone to the downside, we will see brief gain again 💣🚀
and
in long time more correction expected 💣🚀💣
👌 Notice: pay attention to the price on shortcut chart (located above the main chart with black colour) 📖💡
Please, feel free to share your point of view, write it in the comments below, thanks 🐋
USDT Dominance Looking to Decline to 6% and BelowUSDT Dominance is trading within a Rising Wedge pattern and within said Wedge it has formed a Perfect Bearish ABCD leading to the Top of the Rising Wedge and the 78.6% Fibonacci Retrace of the Range.
In time we could see the falling wedge breakdown from here and continue the macro downtrend below 6%

USDT.DDominance Tether has been able to attack the downward trend line for the third time following the replicated analysis, which this time has stabilized in the same area, which can be expected to move up to the 8% area for this indicator and correction in the crypto market as a whole.

Keep an eye on $KNC/USDTTarget mentioned
Noted: Not a financial advisor.
It's always recommended to carefully consider all the factors and conduct thorough research before making any investment decisions. I suggest seeking advice from a licensed financial advisor.

Looking at the Market Cap chart, the coin market trendHello?
Traders, welcome.
If you "Follow", you can always get new information quickly.
Please also click "Boost".
Have a good day.
-------------------------------------
(USDT chart)
The new high (ATH) continues to rise, creating a gap.
(USDC chart)
Contrary to USDT, USDC remains in a downtrend, still gapping.
Therefore, it is necessary to countermeasures against this as it can limit the rise of the coin market or cause a sharp decline.
The countermeasure against this trend is not to find a time to split and sell, but to find a time to buy and sell.
Misunderstanding this and proceeding with split selling or selling 100% and then buying when it fell will increase your psychological anxiety, and you should be careful as you may proceed with a wrong transaction and continue to regret it in the future.
BTC 29K or less is a buy zone from a mid- to long-term perspective.
However, since BTC rose above 29K and then fell below 29K, it is recommended to confirm the trend reversal before proceeding with the purchase.
Otherwise, if you proceed to buy when it is down, this will also increase your psychological anxiety.
In the process of trading, if you focus only on profits without considering your own psychological changes, you will eventually increase the possibility of trading in an erroneous way due to psychological factors.
Therefore, trading to obtain more profits is important, but more importantly, it is important to establish a trading strategy that can minimize the psychological anxiety and burden caused by trading.
(BTC.D chart)
We should think with a focus on the fact that BTC dominance will maintain its upward trend.
The reason is that there is a BTC halving next year.
Therefore, as more people want to trade BTC, it is expected that BTC dominance will rise regardless of BTC price fluctuations.
This uptrend is expected to meet volatility as it rises around 56.78-61.73.
If this volatility turns BTC dominance into a downward trend, it is expected that the coin market will face a period of altcoin pumping cycle.
If that is not the case, and continues to rise, I expect to see volatility again around 70.03.
(USDT.D chart)
It sits near 7.52 as it moves through the May 15-17 volatility period.
Therefore, it is necessary to check whether there is a movement out of the 7.27-7.86 section.
Since the USDT dominus once rose in the 6.85-7.27 zone, the key is whether it can be resisted around 7.86-5.25.
If it does not and rises, it is expected to renew the new high (ATH).
A rise in USDT dominance means a fall in the coin market.
At this time, the important thing is to be careful when trading altcoins as the price destruction of altcoins can be serious according to changes in the BTC price.
-------------------------------------------------- -------------------------------------------
** All descriptions are for reference only and do not guarantee profit or loss in investment.
** Even if you know other people's know-how, it takes a considerable period of time to make it your own.
** This is a chart created with my know-how.
---------------------------------

TETHER DOMINANC even more gain expected 💣🚀Hello 🐋
as I mentioned in my previous analysis 💣🕶️💣
the price hit the target, and we saw more gain 💣🕶️💣
and
now we expect brief gain again 🚀
and
in long time more correction expected ❌🧨
👌 Notice: pay attention to the price on shortcut chart (located above the main chart with black colour) 📖💡
Please, feel free to share your point of view, write it in the comments below, thanks 🐋

The meaning of the sequence is...Hello?
Traders, welcome.
If you "Follow", you can always get new information quickly.
Please also click "Boost".
Have a good day.
** Analysis of the BTC chart publishes new ideas once a week.
** However, we publish new ideas when volatility occurs or when we show signs of diverging from our expectations.
** Excluding the above situation, BTC analysis is listed as a daily update.
-------------------------------------
(BTCUSDT.P chart)
(1D chart)
In order for the head and shoulders pattern drawn on the chart to be completed, resistance must be found below 26907.0-27486.4.
If not, it's just an incomplete pattern.
Therefore, it is necessary to check whether it rises along the uptrend line around May 10 (May 9-11) and finds support around 27486.4-27976.1.
It is necessary to check whether the M-Signal of the 1W chart and the M-Signal of the 1W chart can be crossed to make a regular arrangement.
This is because the regular alignment signals of these medium- and long-term indicators present important inflection points where new trends can be formed.
Therefore, if it falls below 26907.0 and completes the head and shoulders pattern, there is a possibility of a sharp drop, but from a mid- to long-term perspective, it is expected that the possibility will increase due to the large buying force.
Therefore, the mid- to long-term transition point is
1st: 24294.1-25882.9
2nd: 20853.8-23129.6
It is expected that a direction change will be made by touching the 1st and 2nd vicinity above.
When such a change in direction takes place, it is expected that the 3rd wave of the Elliott wave will proceed.
This move is expected to provide one last good buy point for the medium and long term.
I kept saying that altcoins are not the time to trade now.
In order to invest in altcoins from a mid- to long-term perspective, you should proceed with the first purchase and wait when the value is less than 29K.
Then, when the BTC price soars and rises to around 43K, the altcoins will show a cyclical upward trend, and the second purchase must be made according to the cyclical upward trend.
If not, investing in altcoins will be applied as an insecure factor that amplifies one's own psychological insecurities.
Then, the full-fledged buying period for altcoins is when they show support around 43K.
When the BTC price rises above 43K, the reason why you should proceed with buying altcoins in earnest is because now is the time to intensively buy BTC or ETH.
------------------------------------------
(BTCKRW chart)
The HA-High indicator on the 1W chart is about to be created at the 37821000 point.
Therefore, it is necessary to make sure that it can rise with support around 37821000.
If it falls below 37243000 and finds resistance, you should check for support around 35539000.
It is important whether the M-Signal of the 1W chart and the M-Signal of the 1M chart can create an orderly arrangement as they intersect, and whether the price can be maintained beyond the range created by the regular arrangement.
This is because these moves come at a critical time for medium and long-term trend reversal.
The next volatility period is around May 15th.
------------------------------
- big picture
A full-fledged uptrend is expected to start when it rises above 29K.
81K-95K is the range we expect to touch in the next bull market.
-------------------------------------------------- -------------------------------------------
** All descriptions are for reference only and do not guarantee profit or loss in investment.
** Even if you know other people's know-how, it takes a considerable period of time to make it your own.
** This is a chart created with my know-how.
---------------------------------

Money flooding the market, but...Hello?
Traders, welcome.
If you "Follow", you can always get new information quickly.
Please also click "Boost".
Have a good day.
-------------------------------------
(USDT chart)
The declared price (ATH) has been updated.
Therefore, more funds are being concentrated in the coin market.
This concentration of funds will eventually increase the coin market.
---------------------------------------------
(USDC chart)
However, the problem is that USDC has no power to start an uptrend due to the outflow of funds.
USDT believes that individual investors' funds and Chinese funds account for a large proportion.
I think USDC is likely to be funds from American institutional investors.
Therefore, I think that the current coin market is being influenced by American capital.
Therefore, it is expected that the coin market will start to rise only when USDC turns upward.
-------------------------------------------------- ---------
(BTC.D chart)
BTC dominance remains bullish.
This decline is starting to show that the Bollinger bands on the 1D chart are contracting.
Therefore, the trend is expected to be determined by whether it finds support or resistance around 47.64.
Since a lot of money is flowing into the coin market through USDT, the coin market is expected to rise.
That uptrend is expected to lead to an uptrend in BTC going forward.
Therefore, BTC dominance is expected to remain bullish.
Rising BTC dominance means funds are concentrated towards BTC, making altcoins more likely to move sideways or trend down.
Therefore, if you currently place a lot of weight on altcoins, you should think about countermeasures.
This phenomenon is expected to continue until BTC nears 43K.
-------------------------------------------------- ---------
(USDT.D chart)
Whether funds flow in or out of the coin market, whether the inflow is concentrated towards BTC or altcoins, what matters now is whether USDT dominance is rising or falling.
USDT is supported by all exchanges in the world and is a stablecoin.
Therefore, USDT trading pairs have a great influence because most coins (tokens) are traded in the market.
In this sense, we believe that the rise and fall of USDT dominance reflects the influence of the overall flow of the coin market.
An increase in USDT dominance means that it is likely to proceed with a decline in the coin market.
Conversely, a drop in USDT dominance means that it is likely to lead to an uptrend in the coin market.
This movement can be useful when trading in the coin market.
The question is whether the volatility between May 15th and 17th can lead to a move out of the 7.27-7.86 zone.
-------------------------------------------------- -------------------
Summarizing the above,
The coin market appears to be on an uptrend.
However, you are not waiting for the starting signal at the starting line.
Therefore, you need to warm up well so that you can make a proper start when you are waiting for the starting signal at the starting line.
A bullish start is the rise of BTC, which will lead the coin market to an uptrend, which will cause most altcoins to move sideways or downtrend.
However, when BTC rises and moves sideways, it is expected that there will be an increase in altcoins, but be careful when trading altcoins because this upward trend is to buy more BTC.
If BTC continues its uptrend, you will naturally look towards altcoins because you think the BTC price is too high.
This mentality leads to buying altcoins, which is likely to result in losses.
This is because it is thought that only the altcoin I bought will not rise.
Therefore, in order to proceed with buying altcoins, you must be able to continue buying over a long period of time.
If not, buying an altcoin now means incurring a potential loss.
Well, if you can buy it and hold it until next year, it will be different.
-------------------------------------------------- -------------------------------------------
** All descriptions are for reference only and do not guarantee profit or loss in investment.
** Even if you know other people's know-how, it takes a considerable period of time to make it your own.
** This is a chart created with my know-how.
---------------------------------

which way for USDT.D?"In the given scenario within the daily timeframe, I give a probability of movement 1 or higher. Because if movement 2 is to occur, we need to have trailing orders in place, as it may not seem evident when looking at lower timeframes. As depicted in the image, we can see the executed orders within the specified area. Essentially, we are looking for upward liquidity, and this movement causes a market decline. If the liquidity level is touched, we have a strong area above it, which, in my opinion, indicates a good potential for price growth."

USDT.D: Possible Trend. After breaking the 7.4 level, it seems to be retesting the range, getting ready for more upside.

USD.D dominance updateUSD.D dominance update
Now we are at crucial level of USDT.D dominance.
we need to get below 7.55% level as soon as possible. (to continue altcoin continuation)
if that didn't happen, we are probably doomed, other case scenario we would get back to 8.11%
which will decline the altcoin marketcap into further blackhole. this will nuke the marketcap

USDT.D dominance is not looking goodit looks like alt are about to bleed more, first resistance is around 8.11% and next one is around 8.50% if that happens alt will get rekt
becareful :) i will be updating this thread time to time
- SlaZ

Everything is going sidewaysHello?
Traders, welcome.
If you "Follow", you can always get new information quickly.
Please also click "Boost".
Have a good day.
-------------------------------------
(BTCUSDT chart)
(1M chart)
It is necessary to check whether it will be supported in the vicinity of the volume profile section 28465.36-28923.63.
Also, you need to hold the price above the MS-Signal indicator to see if the MS-Signal indicator turns into an uptrend sign, because if these conditions are met, an uptrend is expected.
With such an uptrend, we expect the Stoch indicator to be out of the oversold zone.
Since the StochRSI indicator is located in the overbought zone, we can see that the upside is high.
Therefore, we expect the StochRSI indicator to maintain its uptrend until it breaks out of the overbought zone.
-------------------------------------------------- ---
(1W chart)
The question is whether it can rise above the 1st uptrend channel and maintain its uptrend along the 2nd uptrend channel.
So, if the price holds above 26574.53-27590.60, we expect it to rise above 32259.90.
Since the HA-High indicator formed around 27590.60, finding support around 26574.53-27590.60 is significant.
This important implication is that the possibility of breaking the recent high is increasing.
The StochRSI indicator always makes waves.
It is not easy to predict the direction as the current StochRSI indicator has entered the 30-70 section, that is, the sideways section.
However, since the StochRSI indicator is showing a downtrend, we know that the downtrend is likely to continue.
Therefore, if it shows support around 26574.53-27590.60 mentioned above, it is expected that the direction of the StochRSI indicator will change.
Interpretation of the indicator can be useful when checking whether it is supported or resisted at an important point or section on the price chart.
Therefore, as in the interpretation of the StochRSI indicator, it was expected to lead to a large decline as it moved out of the overbought zone, but as it touches around 26574.53-27590.60 and shows an upward trend, it can be seen that the downtrend is weakening.
Therefore, rather than interpreting the indicators mainly, important support and resistance points on the price chart should be used to confirm movement in the interval.
--------------------------------------------------
(1D chart)
The key is whether you can climb with support in the 28465.36-28923.63 section.
This is because it is important that the 28465.36-28923.63 section is supported as a volume profile section.
if it goes down,
1st: 27496.02-27985.15
2nd: 26574.53
You need to make sure that it is supported in the vicinity of the 1st and 2nd order.
The reason is because it is an important support and resistance section in the mid- to long-term.
If supported in this section, there is a possibility that buying will increase as buying is possible in the mid- to long-term.
All indicators (StochRSI, Stoch, RSI, CCI) are positioned in the sideways section.
Therefore, rather than buying in the current range, it is better to wait for a decline around 27496.02-27985.15 or 26574.53 or for a rise above 30184.24 to show support.
This is because there is no need to worry about buying in advance.
Buying in advance because of the price that is not much different and continuing trading while feeling psychological anxiety should be oriented because it can make you unable to hold on when a big movement comes out.
------------------------------
- big picture
A full-fledged uptrend is expected to start when it rises above 29K.
81K-95K is the range we expect to touch in the next bull market.
-------------------------------------------------- -------------------------------------------
** All descriptions are for reference only and do not guarantee profit or loss in investment.
** Even if you know other people's know-how, it takes a considerable period of time to make it your own.
** This is a chart created with my know-how.
---------------------------------

USDT: Funds focused on individuals (groups), USDC: Funds focusedhello?
Traders, welcome.
If you "Follow", you can always get new information quickly.
Please also click "Boost".
Have a good day.
-------------------------------------
(USDT chart)
(USDC chart)
I think that USDT and USDC are used as a channel for the inflow and outflow of funds into the coin market.
Among them, USDT has a high market cap, so I think it has as much influence on the coin market.
Looking at the USDT chart, we can see that it has risen to near the previous high.
Therefore, it can be seen that the coin market is overflowing with funds.
However, if you look at the USDC chart, it has fallen a lot, making it look like the funds flowing into USDT are stagnant.
In other words, it can be interpreted that the money inflow through USDT is trying to lead the coin market to rise, but the outflow of money through USDC limits the rise or makes it fall.
Therefore, I think it is better to buy coins (tokens) that you intend to continue investing in until the BTC halving next year.
Otherwise, if you are going to trade in terms of day trading or short-term trading, I think you need to be very careful.
The inflow of new money is expressed as an increase creating a gap.
Therefore, the size of the candle does not matter.
-------------------------------------------------- ----
(BTC.D chart)
Looking at the BTC dominance chart, it is forming a rising channel.
However, the 1M chart has not yet created an upward channel and is showing an expansion.
Therefore, the possibility of a downtrend at any time still exists.
However, if it does not fall below 46.76-46.84, it is expected that it will lead to a move above 50.49 in the near future.
We believe this move is due to the BTC halving next year.
This is because the possibility that funds that are unable to find a place to go in the coin market will be concentrated toward BTC due to an event called BTC Halving next year is increasing.
However, what BTC dominance tells us is whether funds are concentrated in BTC or altcoins.
Any other interpretation can lead to confusion, so it's best not to think about it.
Concentration of funds towards BTC means that BTC is leading the coin market.
Since there is no guarantee that this lead will necessarily lead to a rise in the coin market, you should check the USDT.D chart to see if the coin market is rising.
-------------------------------------------------- -
(USDT.D chart)
The USDT Dominance Chart is a chart that allows you to see the flow of funds flowing into USDT.
Therefore, when USDT dominance declines, the coin market is likely to show an uptrend.
If USDT dominance is trending down and coins (tokens) with large market caps, such as BTC or ETH, show sideways movements, it is likely that coins (tokens) with lower market caps will pump in the short term. .
If you are not comfortable with day trading or short trading in these markets, we recommend that you do not trade.
Because you may miss a better buying opportunity than this.
USDT dominance is moving sideways in the 6.85-7.27 range.
This means that the direction has not yet been determined.
If you look at the 1M chart, it is in a state where a proper trend line or channel has not been formed.
Looking at the 1W chart, it shows a breakout from the downtrend line, downtrend channel.
Therefore, it can be seen that we have not yet found a direction in the mid- to long-term perspective.
When you can't find a direction like this, I think it's better not to trade or to proceed with a split purchase according to a trading strategy for coins (tokens) that will continue to invest in the mid- to long-term.
The basis for proceeding with the purchase is the movement of the USDT chart mentioned above.
In other words, since a lot of money is flowing into the coin market, it is not strange to see an upward trend at any time.
If you do not take any action when the unit price has risen by 30% or more from the unit price you purchased for mid- to long-term trading, you may end up selling at a lower price level because you keep feeling regretful when the stock fluctuates up and down.
Therefore, you need a strategy to sell a certain portion according to the rate of return or some standard according to your investment style.
This selling strategy is an important strategy because it can lead to a better buying strategy.
-------------------------------------------------- -------------------------------------------
** All descriptions are for reference only and do not guarantee profit or loss in investment.
** Even if you know other people's know-how, it takes a considerable period of time to make it your own.
** This is a chart created with my know-how.
---------------------------------

USDT.D up or down now ?Dominance Tether
In the daily time frame, it is placed behind a resistance of 114 days and it cannot be rejected, and the candle is closed below that resistance.
Now, according to the status of the RSI indicator and the Bollinger Band, the probability of correction can be considered higher than the probability of breaking the resistance line.
Don't forget capital management.
