#USDT DOMININCE BREAKS DOWN THIS RISING WEDGE PATTERN!!Hi guys, This is CryptoMojo, One of the most active trading view authors and fastest-growing communities.
Consider following me for the latest updates and Long /Short calls on almost every exchange.
I post short mid and long-term trade setups too.
Let’s get to the chart!
I have tried my best to bring the best possible outcome to this chart, Do not consider financial advice.
USDT DOMINANCE UPDATE
USDT DOMINANCE breaks down this rising wedge pattern so we can expect a drop up to 17% according to the pattern.
This chart is likely to help you make better trade decisions if it does consider upvoting it.
I would also love to know your charts and views in the comment section.
Thank you
Usdtdominance

USDC+USDT dominance.minor channel view of stables within the major price channel. Local resistances must be followed.

#USDT.DOMINANCE 4Hr UPDATE !!Hello dear traders, we here new so we ask you to support our ideas with your LIKE and COMMENT, also be free to ask any question in the comments, and we will try to answer for all, thank you, guys.
USDT.D UPDATE:-USDT.D if reject from 7.53% we can see 6.41% to 6.36% if dominance jumps from 7.53% to 7.70% and 7.81% then we reject to 6.38%
This is not a piece of financial advice. All investment made by me is at my own risk and I am held responsible for my own profit and losses. So, do your own research before investing in this trade.
Thanks for your time, we hope our work is good for you, and you are satisfied, we wish you a good day and big profits.
THANK YOU.

USDT.DOMINANCE 2HOUR UPDATE BY CRYPTUSANDERSHello dear traders, we here new so we ask you to support our ideas with your LIKE and COMMENT, also be free to ask any question in the comments, and we will try to answer for all, thank you, guys.
DOMINANCE UPDATE:-USDT.D is moving in a rectangular chart pattern and moving towards its horizontal resistance. If it breaks above horizontal resistance with a candle close above it, then that would indicate an upside move.
Another possible scenario is a rejection from horizontal resistance and that would be the indication of a downward move. We must keep in mind that USDT.D works opposite to the crypto market and as there is indecision in the market, so better to play level to level with tight stop losses.
Sorry for my English it is not my native language.
Hit the like button if you like it and share your charts in the comments section.
This is not a piece of financial advice. All investment made by me is at my own risk and I am held responsible for my own profit and losses. So, do your own research before investing in this trade.
Thanks for your time, we hope our work is good for you, and you are satisfied, we wish you a good day and big profits.
THANK YOU.

Bitcoin (BTC) - September 29Hello?
Welcome, traders.
By "following", you can always get new information quickly.
Please also click "Like".
Have a good day.
-------------------------------------
(USDT 1D Chart)
(USDT 1D Chart)
A gap in USDT and USDC charts indicates an inflow or outflow of funds.
Candles are drawn as funds are utilized in the coin market.
USDC's outflow of funds continues.
Therefore, you need to be careful in trading.
The reason that the coin (token) price rises as the funds flow out is because it may be a movement to outflow the funds again.
(USDT.D 1D Chart)
(USDC.D 1D Chart)
Dominance also indicates that when a gap occurs, funds will flow in or out.
Candles are drawn as funds are utilized in the coin market.
Therefore, when the candle shows a decline, it can be interpreted that the coin (token) is being bought in the coin market.
In the opposite case, it can be interpreted as selling coins (tokens).
However, it is highly likely that the charts related to the market cap for stablecoins will show a steady upward trend.
The reason is that funds are flowing into or out of the coin market.
Hope you don't confuse the benefits.
-----------------------------------------------------
(NASDAQ100 1D Chart)
After a period of volatility, it rose to around 11475.5.
The key is whether it can be supported near 11475.5.
If not supported, it is likely to move towards the 10666.6 area.
The next volatility period is around October 14th.
-----------------------------------------------------
(BTCUSDT 1D Chart)
The key is whether the price can hold above the uptrend channel (1) formed by the long-term uptrend line, above 19426.43.
The HA-Low indicator is passing near 19426.43, so if you can sustain the price above that, it is likely to turn into an uptrend.
However, in order to continue the upward trend, it must rise above the HA-High index, so it should rise to around 20798.16 at the current price point.
As mentioned in the description of the perpetual futures chart, the BTCUSDTPERP chart, the 19.4K-20.7K zone requires a quick response.
This means that the price range is large and can move quickly.
As the inflow and outflow of funds in the coin market is in progress, the volatility of the price is likely to increase.
As the price rises, the power of funds is needed to keep the price rising.
However, it seems that the funds in the current coin market are flowing out through USDC, so you need to be careful in trading.
This is because investment companies with strong financial power are likely to increase the price to get more money back if they sell when the price is falling, as the price is more likely to plummet.
Therefore, there is a possibility that the section 21475.02-21838.98 is a turning point.
If the price is maintained beyond this range, altcoins are also expected to show an upward trend.
Otherwise, even a small drop in BTC price is expected to cause altcoins to decline significantly compared to the BTC drop.
Currently, the coin market is forming a very difficult market for short-term and same-day trading in the spot market.
Accordingly, it is necessary to think about ways to increase the number of coins (tokens) by understanding the movement of the coins (tokens) you have.
If you are unfamiliar with same-day, short-term trading, it is better to just check the market flow.
------------------------------
- big picture
I think you need to be supported in the 13K-15K section to gain the strength to rise.
So, whether it rises or falls from its current position, both require a short-term response.
A full-fledged uptrend is expected to begin when it rises above 29K.
------------------------------------------------------------ -----------------------------------------------------
** All descriptions are for reference only and do not guarantee a profit or loss in investment.
** If you share this chart, you can use the indicators normally.
** The MRHAB-T indicator contains indicators that indicate support and resistance points.
** SR_R_C indicators are displayed as StochRSI(line), RSI(columns), CCI(bgcolor).
** CCI indicator is expressed as overbought range (CCI > +100) and oversold range (CCI < -100).
(Short-term Stop Loss can be said to be a point where profit and loss can be preserved or additional entry can be made through split trading. It is a short-term investment perspective.)
---------------------------------

USDT DOMINANCE ANOTHER BEARISH SCHNARIO!!Hi guys, This is CryptoMojo, One of the most active trading view authors and fastest-growing communities.
Consider following me for the latest updates and Long /Short calls on almost every exchange.
I post short mid and long-term trade setups too.
Let’s get to the chart!
I have tried my best to bring the best possible outcome to this chart, Do not consider financial advice.
USDT DOMINANCE UPDATE
USDT DOMINANCE is making this rising wedge pattern but to confirm this pattern dominance needs to break down this pattern confirmation.
After this conform break down of this pattern we can expect a drop up to 17% according to the pattern.
This chart is likely to help you make better trade decisions if it does consider upvoting it.
I would also love to know your charts and views in the comment section.
Thank you

USDT.D I like to use USDT.D to see when money is moving out of Btc/alts and into stables, gives a good edge on money flow in crypto.
Keeping an eye on this Rising Wedge.
Typically these breakout bearish,
if we get a bullish breakout expecting it to really run.
Hard to call a direction, will wait for one reaction on upper or lower trendline before I will enter any trades with confidence.

Bitcoin (BTC) - September 27Hello?
Welcome, traders.
By "following", you can always get new information quickly.
Please also click "Like".
Have a good day.
-------------------------------------
(USDT 1W chart)
(USDT 1W chart)
(USDT.D 1D Chart)
(USDC.D 1D Chart)
Money flows into or out of the coin market through stable coins such as USDT and USDC.
As proof of that, it can be seen that funds moved to create a gap in the charts of USDT and USDC.
In other words, when the gap rises, USDT and USDC are newly issued and funds flow into the coin market.
When the gap falls, the stablecoins issued by USDT and USDC are converted into fiat currencies, resulting in an outflow of funds from the coin market.
A gap has occurred on the USDT chart and moved higher to around 68.468B.
A gap has occurred on the USDC chart, dropping significantly below 52.246B.
Judging by these movements, we can see that funds from all over the world flowed into the coin market through USDT.
The majority of these funds are likely to be Chinese capital.
In addition, we can see that the funds have flowed out of the coin market in large numbers through USDC.
The majority of these funds are likely to be US capital.
Therefore, it can be seen that a large amount of funds were leaked to the coin market due to bad news from the United States.
It is also necessary to check whether these funds are flowing into the stock market.
US money is likely to come from investment companies.
This is due to the strong movement to link the coin market to the stock market, which is expected to increase the likelihood of significant volatility in the investment market in the future.
As funds flowed out into the coin market, the possibility of decoupling the coin market and the stock market increased, so when the stock market rose, the coin market was more likely to fall.
If it ends with this one transfer of funds, the volatility of the coin market will not cause a panic shell.
However, if more funds flow out of the coin market when additional money flows occur, the coin market is more likely to panic.
As always, we expect the same thing to happen this time around as the money moves first and then the charts are drawn accordingly.
-------------------------------------------
(BTCUSDTPERP 1D Chart)
- If it rises above 20794.4, the main position is 'LONG'.
- The 19424.9-20794.4 section is a quick response section.
- If it falls below 19424.9, the main position is 'SHORT'.
To convert into an uptrend, the price must rise above the minimum uptrend line (1) and hold it.
If not, you should be careful with the trade as it is likely a bearish rebound.
At this time, the key is whether it is supported in the 17670.0-18374.1 section.
If it is not supported, it is expected that it will move towards the 15908.2 level.
Even if BTC rises, as explained above, it is not expected that the uptrend will be large as long as there is a large amount of money outflow from the coin market.
However, if additional funds flow into the coin market through USDT and rise above 68.468B, there is a possibility that the uptrend of the coin market will be maintained.
However, since the funds were outflowed through USDC, the possibility of decoupling the coin market and the stock market has increased.
This outflow of funds further reduces the trading volume and increases the possibility of large volatility.
If the money doesn't come back, the end is most likely a big drop.
Therefore, in this market situation, what we can do is to preserve profit and loss.
If so, selling 100% of all holdings can lead to double losses in the large volatility that will occur in the future, so you should aim.
For large volatility, please refer to the BTCUSDT 1M chart () with the rising and falling rates.
The volatility of BTC is likely to be between -25% and +25%.
Accordingly, altcoins are likely to be between -50% and +50%.
However, the rise rate of altcoins is not expected to be very high, and the decline rate is likely to be even greater.
------------------------------
- big picture
I think you need to be supported in the 13K-15K section to gain the strength to rise.
So, whether it rises or falls from its current position, both require a short-term response.
A full-fledged uptrend is expected to begin when it rises above 29K.
------------------------------------------------------------ -------------------------------------------
** All descriptions are for reference only and do not guarantee a profit or loss in investment.
** If you share this chart, you can use the indicators normally.
** The MRHAB-T indicator contains indicators that indicate support and resistance points.
** SR_R_C indicators are displayed as StochRSI(line), RSI(columns), CCI(bgcolor).
** CCI indicator is expressed as overbought range (CCI > +100) and oversold range (CCI < -100).
(Short-term Stop Loss can be said to be a point where profit and loss can be preserved or additional entry can be made through split trading. It is a short-term investment perspective.)
---------------------------------


Bitcoin (BTC) - September 25Hello?
Welcome, traders.
By "following", you can always get new information quickly.
Please also click "Like".
Have a good day.
-------------------------------------
(BTCUSDTPERP 1D Chart)
- If it rises above 20794.4, the main position is 'LONG'.
- The 19424.9-20794.4 section is a quick response section.
- If it falls below 19424.9, the main position is 'SHORT'.
The question is whether the volatility around September 25 (September 24-26) can move above the uptrend line (1).
If it falls below the 17670.0-18374.1 section, it is expected to drop below 15908.2, so you need to think about how to respond.
The Stoch RSI indicator is rising, but the price is showing a downward trend.
Therefore, when the Stoch RSI indicator starts to show a decline and finds resistance near 19424.9, it is expected that it will lead to further declines.
(1h chart)
If it does not fall below the downtrend line (1), it is expected to rise.
Key points of support and resistance that require a quick response
- 20794.4
- 20122.5
- 19424.9
- 18769.1
- 18374.1
- 17670.0
support and resistance
19424.9-19607.9
19116.5-19226.9
18769.1-18895.1
------------------------------
- big picture
I think you need to be supported in the 13K-15K section to gain the strength to rise.
So, whether it rises or falls from its current position, both require a short-term response.
A full-fledged uptrend is expected to begin when it rises above 29K.
------------------------------------------------------------ -------------------------------------------
** All descriptions are for reference only and do not guarantee a profit or loss in investment.
** If you share this chart, you can use the indicators normally.
** The MRHAB-T indicator contains indicators that indicate support and resistance points.
** Background color of Long/Short-S indicator: RSI oversold and overbought sections
** Background color of CCI-C indicator: When the short-term CCI line is below -100 and above +100, oversold and overbought sections are displayed.
** The OBV indicator was re-created by applying a formula to the DepthHouse Trading indicator, an indicator disclosed by oh92. (Thanks for this.)
(Short-term Stop Loss can be said to be a point where profit and loss can be preserved or additional entry can be made through split trading. It is a short-term investment perspective.)
---------------------------------

Bitcoin (BTC) - September 21Hello?
Traders, nice to meet you.
If you follow "Follow", you can always get new information quickly.
Please also click "Like".
Have a good day.
-------------------------------------------
(BTCUSDTPERP 1D chart)
-When falling below 19424.9, the main position is 'Short'.
-19424.9-20794.4 section is a quick response section.
-When rising to 20794.4 or higher, the main position is 'Long'.
On June 18, we touched the 17670.0-18374.1 section and touched it on September 19.
Therefore, this time, if the price is maintained in the 17670.0-18374.1 section or more, it is expected to rise.
However, since the Stoch RSI indicators are entering the overbeage section, it is necessary to make sure that the price is maintained in the 17670.0-18374.1 section or more than that.
It is also necessary to check whether the CCI wire is maintained over the EMA line.
In order to switch to the upward trend, it is necessary to maintain the price above the HA-Low indicator.
Therefore, it is necessary to rise above the section of 19607.9-19930.6.
(To reduce fatigue in looking at the chart, we disabled indicators in the MRHAB-T indicators that inform the support and resistance point.)
------------------------------------
-The big picture
In order to gain the power of ascension, I think it must be supported in the 13k-15K section.
Therefore, both short -term response, whether rising from the current position or falling, is required.
The full -scale rise is expected to start by more than 29K.
------------------------------------------------------ ---------------------------------------------------
** All descriptions do not guarantee losses in investments for reference.
** If you share this chart, you can use the indicators normally.
** MRHAB-T indicators include indicators that display support and resistance points.
** Background color of Long/Short-S indicators: RSI overreagy, overlooked section mark
** Background color of CCI -C indicators: When the short -term CCI line is -100 or less, when it is +100 or more,
** OBV indicators have rewritten by applying the formula to the indicators of OH92. (Thank you for this.)
(Short -term STOP Loss is a point where you can preserve or enter additional gains and losses by split transactions. It is a short -term investment perspective.)
---------------------------------------

🔴 USDT.D - 1D (21.09.2022)🔴 USDT.D
TF: 1D
Side: Short
Pattern: Rising Wedge
SL: 8.03%
TP 1: 7.23%
TP 2: 6.92%
TP 3: 6.68%
TP 4: 6.43%
This is my idea on USDT.D over the next couple of weeks.
After so much growth, I think it will go down a bit to reset the RSIs.
This means Crypto can have a relief rally before continuing down.

Bitcoin (BTC) - September 20Hello?
Welcome, traders.
By "following", you can always get new information quickly.
Please also click "Like".
Have a good day.
-------------------------------------
(BTCUSDT 1W Chart)
Whether or not it can move higher than 22579.68 is the key.
To do so, it is necessary to check whether the price can rise above 19695.87 and be supported.
(1D chart)
It is necessary to check whether it can be supported in the section 19426.43-1995.87.
Primary resistance: 19946.21-20285.73
Secondary resistance: 20798.16-218383.98
- Conversion to an uptrend: Rise above 19695.58 (above the HA-Low indicator),
- To continue the upward trend: rise above 20798.16 (above the HA-High indicator)
When the Stoch RSI indicator moves out of the oversold zone, it is important to find support and resistance at the point.
If the CCI line remains above the EMA line, it is expected to maintain an uptrend.
The next volatility period is around September 25th.
------------------------------
- big picture
I think you need to be supported in the 13K-15K section to gain the strength to rise.
So, whether it rises or falls from its current position, both require a short-term response.
A full-fledged uptrend is expected to begin when it rises above 29K.
------------------------------------------------------------ -------------------------------------------
** All descriptions are for reference only and do not guarantee a profit or loss in investment.
** The MRHAB-T indicator, which is inactive on the chart, contains indicators that indicate support and resistance points.
** Background color of Long/Short-S indicator: RSI oversold and overbought sections
** Background color of CCI-C indicator: When the short-term CCI line is below -100 and above +100, oversold and overbought sections are displayed.
** The OBV indicator was re-created by applying a formula to the DepthHouse Trading indicator, an indicator disclosed by oh92. (Thanks for this.)
(Short-term Stop Loss can be said to be a point where profit and loss can be preserved or additional entry can be made through split trading. It is a short-term investment perspective.)
---------------------------------

USDT DOMINANCE ANOTHER BEARISH SCHNARIO!!Hi guys, This is CryptoMojo, One of the most active trading view authors and fastest-growing communities.
Consider following me for the latest updates and Long /Short calls on almost every exchange.
I post short mid and long-term trade setups too.
Let’s get to the chart!
I have tried my best to bring the best possible outcome to this chart, Do not consider financial advice.
USDT DOMINANCE UPDATE
USDT DOMINANCE is making this rising wedge pattern but to confirm this pattern dominance needs to break down this pattern confirmation.
After this conform break down of this pattern we can expect a drop up to 17% according to the pattern.
This chart is likely to help you make better trade decisions if it does consider upvoting it.
I would also love to know your charts and views in the comment section.
Thank you


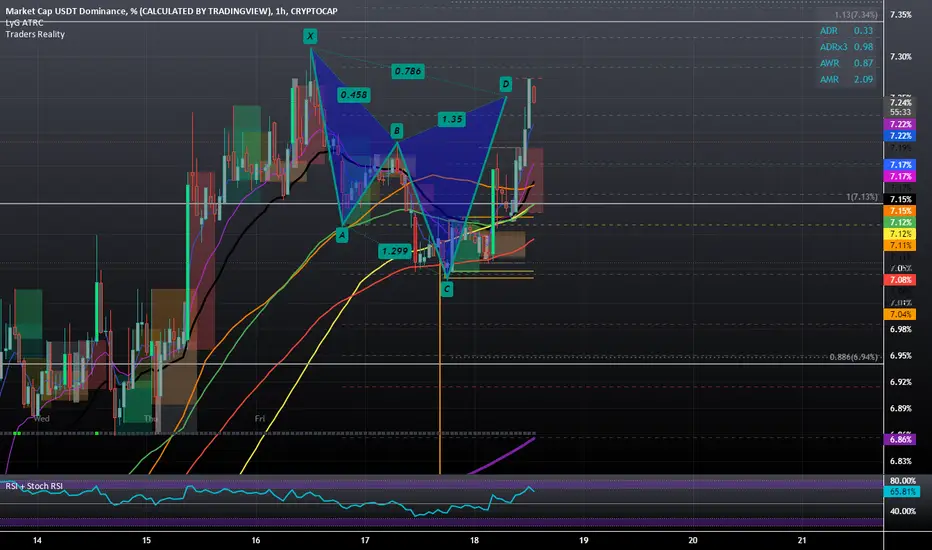
USDT Dominance Bearish Cypher on the 1 Hour TimeframeWe may see it spike up to the .886 Area but overall I think we are looking at some Bearish Cypher activity on the Dominance of the USDT today.
USDT.D CAN Move Upward HardlyBased on the Neowave wave theory, we have a completed triangle, the next waves are being completed and can go much higher up to the 8.16 level.

USDT.D AnalysisAs shown in the graphic, the (X) wave has ended and by breaking the level of 7.9%, its end is confirmed and we are already in the descending (Y) wave, to continue the decline until the bottom of the (W) wave is broken as shown, Let's follow through.

#BTC AND USDT DOMINANCE COMPARISON!!Hi guys, This is CryptoMojo, One of the most active trading view authors and fastest-growing communities.
Do consider following me for the latest updates and Long /Short calls on almost every exchange.
I post short mid and long-term trade setups too.
Let’s get to the chart!
I have tried my best to bring the best possible outcome in this chart, Do not consider it as FINANCIAL ADVICE.
I always emphasize that time in the market beats timing the market, but I want to share an interesting approach that you can consider taking when timing the cryptocurrency market, especially when it comes to Bitcoin's overall direction.
Tether Dominance
- Just as Bitcoin dominance refers to Bitcoin's market cap relative to that of the entire market cap, Tether dominance is no different.
- It refers to how much capital is parked in stablecoins, specifically Tether, at any point in time.
- Since Tether (USDT) is a stablecoin that tracks the USD, an increase in Tether's dominance suggests a pullback or correction in cryptocurrencies.
- A simple way to understand it is to think of USD flowing in and out of the market.
- On the other hand, if Tether's dominance drops, it means that more capital is being deployed to purchase cryptocurrencies, which is bullish overall for the market.
- If you look at the graph above, you'll clearly see the inverse correlation between Bitcoin (orange) and Tether dominance (black).
- Key support and resistance zones for Tether dominance are marked as well.
- As we're currently trading slightly above local support, marked in green, if we see Tether Dominance fall below those levels, we could expect Bitcoin to continue rallying upwards.
This chart is likely to help you in making better trade decisions if it did consider upvoting this chart.
Would also love to know your charts and views in the comment section.
Thank you

#USDT.DOMINANCE 30M UPDATE !!Hello dear traders, we here new so we ask you to support our ideas with your LIKE and COMMENT, also be free to ask any question in the comments, and we will try to answer for all, thank you, guys.
DOMINANCE UPDATE:-As we see the Bart pattern forming in the Dominance, the Dominance suddenly dumps and we see bearish RSI in the Dominance, so here we expect the Dominance to Dump. What do you think in the comment section? Tell me
This is not a piece of financial advice. All investment made by me is at my own risk and I am held responsible for my own profit and losses. So, do your own research before investing in this trade.
Thanks for your time, we hope our work is good for you, and you are satisfied, we wish you a good day and big profits.
THANK YOU.

USDT.D inverted head and shoulders#USDT.D
The dominance of USDT is inside a descending channel, and below the upper line of this channel.
also as you can see it shaped an inverted head and shoulders.
🐮 the neckline of H&S pattern is the same with upper line of channel, so breaking out from this resistance can increase dominance toward resistance zone around 8.5%, that will cause more fall in crypto market.
🐻 rejection from upper line of channel can reverse the short-term trend and possible to drop to lower line, and as you know this move will cause reversal in crypto market and crypto will move upward.

It's time for a USDT correctionNot financial advice and no guarantee, but I see a potential Quasimodo pattern

SECRETS the USDT.D chart can reveal - Crypto Bullish or Bearish?Hi Traders, Investors and Speculators 📈📉
Ev here. Been trading crypto since 2017 and later got into stocks. I have 3 board exams on financial markets and studied economics from a top tier university for a year. Daytime job - Math Teacher. 👩🏫
In today's video analysis, I share with you the SECRET of the USDT.D chart, that otherwise seems irrelevant in predicting the ENTIRE crypto market direction... right? Watch this video to find out what the USDT chart can reveal about the general trend of Bitcoin and altcoins / TOTAL cryptocurrency market cap. I also use one of my favorite technical indicators, the correlation coefficient.
Now , you might wonder, why are market caps relevant? In general, the higher the market cap of a cryptocurrency, the more dominant it is considered to be in the market. For this reason, market cap is often regarded as the single most important indicator for ranking cryptocurrencies. The market cap of a cryptocurrency is determined by the current price multiplied by the circulating supply.
The market cap of a cryptocurrency more or less reflects the popularity of a coin over a longer term and can reveal how much market participation there is in a specific asset.
Large-cap cryptocurrencies are generally considered to be safer crypto investments. These are companies with a market cap of more than $10 billion. Investing in coins with large market capitalization is usually a conservative strategy. These coins are likely to be less volatile than other cryptocurrencies but still more volatile than traditional assets like stocks. Mid-cap cryptos (think top 20ish altcoins) are more volatile but also have a lot more growth potential than large-cap cryptocurrencies.
Micro-cap cryptocurrencies are extremely volatile and considered a highly risky investment, even though they may sometimes have a lot of potential (short-term) growth. However, be aware that they may also crash, literally from one minute to the next. They are also popular for pump and dump schemes, and liquidity rug-pulls.
_________________
📢Follow us here on TradingView for daily updates and trade ideas on crypto , stocks and commodities 💎Hit like & Follow
We thank you for your support !
CryptoCheck
