USDT DOMINANCE is tranding above this support!!Hi guys, This is CryptoMojo, One of the most active trading view authors and fastest-growing communities.
Consider following me for the latest updates and Long /Short calls on almost every exchange.
I post short mid and long-term trade setups too.
Let’s get to the chart!
I have tried my best to bring the best possible outcome to this chart, Do not consider it as financial advice.
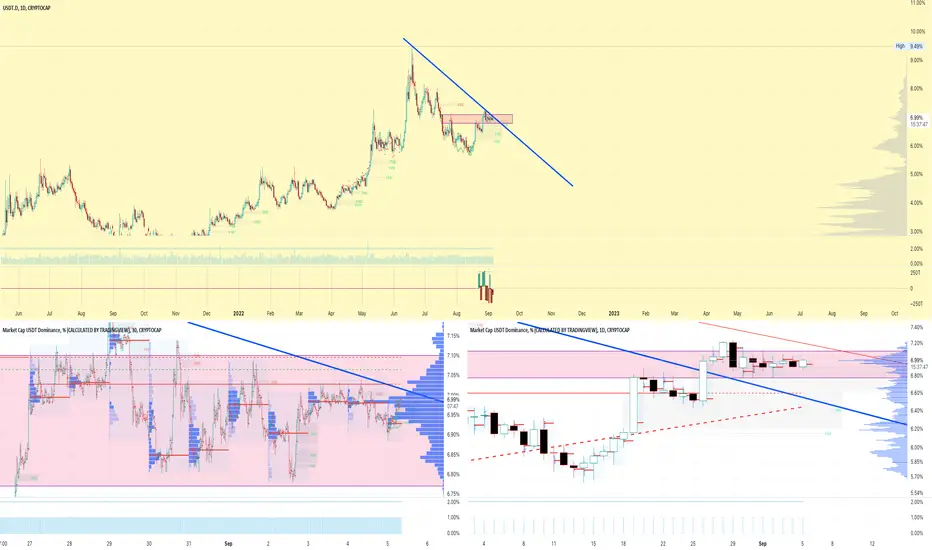
USDT DOMINANCE
USDT DOMINANCE makes this rising wedge pattern and drops currently it is trading at the support of this horizontal support which is 6.40%.
we need a conform breakout of this support in case it bounced then we have 6.77% as resistance.
This chart is likely to help you make better trade decisions if it does consider upvoting it.
I would also love to know your charts and views in the comment section.
Thank you
Usdtdominance

usdt.dThere is a possibility of correction in the four-hour period, although the trend is upward in higher periods.

USDT DOMINANCE UPDATE! A BULLISH RETEST!!Hello everyone, if you like the idea, do not forget to support with a like and follow.
Welcome to this USDT Dominance update. USDT Dominance works opposite to the BTC and Alts. It means when USDT Dominance pumps, BTC, and Alts dumps, and vice versa.
Now let's get to the chart.
According to this daily time frame chart, USDT dominance breaks out from the descending triangle and currently looks like it is retesting the triangle. After this successful retest, we can expect a bounce in dominance and a dump in the crypto market.
Invalidation:- Daily candle close below the 6.30 level will invalidate this chart.
If you like this idea then do support it with like and follow.
Also, share your views in the comment section.
Thank You!

USDT.DIf the price engulf S1 i can say probably we are gonna see 28000 at S2 !
TIP : BTCUSDT and USDT.D have advers conection !

Is bullishness comming back? Hello everone,
In today's video we are going to talk about USDT dominance and how BTC and some altcoins are looking like.
Have a good trading week.


ENJUSDTIn a period of several months, we will see a further fall in the price in the form of wave 5
Just a personal analysis and opinion that can easily be wrong

USDT dominance continues to grow!Hello trader Today I prepared a new idea for you. Like and subscribe to the channel there is a lot of useful information✅
Two weeks ago, I already published this chart, my expectations were for the breaking of the trend line, well, as we can see, we have successfully rebounded from it, which does not affect Bitcoin in the best way.
This chart shows that most players in the market hold their assets in Usdt and are not going to buy yet, or they are just selling and looking for the best moment to buy, most say that the bottom of bitcoin has not yet been found! And what do you think?

USDT Dominance Breakout! After an accumulation zone, USDT dominance started pumping and broke out from its previous channel. It also affected BTC and altcoins with big downfalls.
Important Fibonacci levels:
5,67%
6,56%
7,11%
7,56%
8,00%
8,63%
9,50%

USDT DOMINANCEHere we look on the levels acting as resistance and support on USDT. Break of trendline either way, should give more strength on the movement it takes to break. I am leaning more on the bullish side of USDT, but playing level by level.

USDT.D at decision point... Hey.. up or down for USDT?! This is the big questions for now... very interesting point at the moment.. what is ur view?
#USDT DOMINANCE ALERT!!Hi guys, This is CryptoMojo, One of the most active trading view authors and fastest-growing communities.
Consider following me for the latest updates and Long /Short calls on almost every exchange.
I post short mid and long-term trade setups too.
Let’s get to the chart!
I have tried my best to bring the best possible outcome to this chart, Do not consider financial advice.
#USDT DOMINANCE UPDATE
USDT DOMINANCE does not look good, DOMINANCE makes this bullish flag pattern in 4 hours time frame but it does not conform yet but in case it breakout this pattern with confirmation then it can bounce up 12%.
In case it got rejected then it can drop up to the lower level of this pattern.
This chart is likely to help you make better trade decisions if it does consider upvoting it.
I would also love to know your charts and views in the comment section.
Thank you

USDT.D - I found fractal. Bitcoin will be 14 000$
to create the idea, I used my custom finobachi, degree system and cycles. The most important thing you can see here is the fractal. It clearly shows what can happen with bitcoin with a high degree of probability and with a small degree of probability this may not happen. Accept that there will be a bull trap soon and after that we will fall heavily to $12-14000 and possibly even lower. I have identified fractal bottoms, accumulations, highs and patterns that are similar to each other. The result is the same after the transition of Ethereum to proof stakes and a strong increase in the FRS rate, we are in for the strongest collapse in the history of BTC.
For those who do not know, the rise of tether dominance means the fall of bitcoin and vice versa
BTC WILL BE PUMP 27 December (week candle)

USDT DOMINANCEAs expected out the Price action successfully Bounced back from the MSB level marked at 6.80% level and we got to see the Decrease in the price of ALTs

🤖 #SENTIMENT- 30.08 🤖TLDR
In essence everything is pointing towards short term bear movement for the next 2-4 days and then potentially bull rally
USDT DOMINANCE
Hitting key resistance, overbought a bearish divergence and descending trendline. Equally a break out here would be huge but it is looking quite bearish which means money flow into BTC and Alts
ALT CAP EXCL. BTC & ETH
Playing out the last of a Head and shoulders pattern with the possible bottom in the next few days then could result in a big rally from there driving Alts up
BTC
Finishing off the last of a descending wedge over the next few days then possibel breakout on the cards
BTC DOMINANCE
We will likely see a bounce at the bottom of this channel now as a result of BTC pumping - this may leave Alts a little stagnant but they will follow.

#USDT DOMINANCE is forming this bearish rising wedge pattern!!Hi guys, This is CryptoMojo, One of the most active trading view authors and fastest-growing communities.
Consider following me for the latest updates and Long /Short calls on almost every exchange.
I post short mid and long-term trade setups too.
Let’s get to the chart!
I have tried my best to bring the best possible outcome to this chart, Do not consider it as financial advice.
USDT DOMINANCE
If we look at the 4hour timeframe USDT DOMINANCE is making this falling wedge pattern if it breakdown this pattern with confirmation then according to the pattern it can drop up to 16%.
( About rising wedge
A rising wedge is generally a bearish signal as it indicates a possible reversal during an uptrend. Rising wedge patterns indicate the likelihood of falling prices after a breakout through the lower trend line
This chart is likely to help you make better trade decisions if it does consider upvoting it.
I would also love to know your charts and views in the comment section.
