TradeCityPro | Bitcoin Daily Analysis #51👋 Welcome to TradeCity Pro
Let's move on to the fiftieth analysis of Bitcoin and key crypto indices. In this analysis, as usual, I want to review the New York futures session triggers for you.
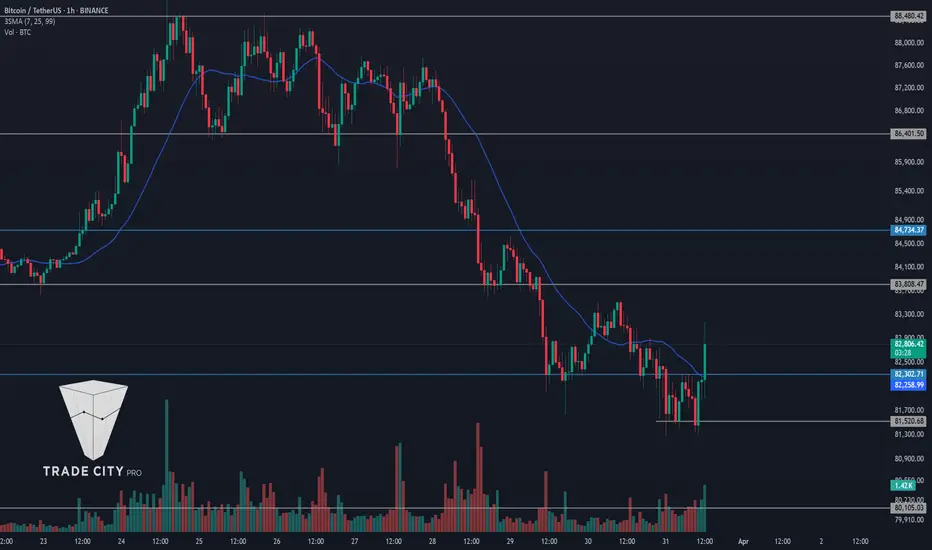
⏳ 1-hour timeframe.
As you can see in the 1-hour timeframe, after the news of US tariffs, the market experienced a drop to the support zone, and now, for the second time, it has penetrated this area.
🔍 If this range between 81520 and 82302 is broken, the price could start the next bearish leg, but another important support is located at 80105, which might prevent further decline.
🔽 For a short position, breaking this range is suitable. For a long position, it's better to wait until a new structure forms.
👑 BTC.D Analysis
Moving on to Bitcoin dominance, the 62.64 zone has also been broken, and dominance has pulled back to it and is now moving upward.
💫 I cannot determine a resistance level at the moment, and we need to wait until the price structure forms new resistance levels.
⚡️ For now, I see Bitcoin dominance as bullish, so it's better to choose Bitcoin for long positions and altcoins for short positions.
📅 Total2 Analysis
Moving on to the Total2 analysis, yesterday the price pulled back to 990 and has now reached 953.
✔️ If this zone is broken, the price could experience a sharp bearish movement and start the next leg. For a long position, like Bitcoin, we need to wait for a new structure to form.
📅 USDT.D Analysis
Moving on to USDT dominance, a very sharp upward move with strong momentum has occurred, and a higher low compared to 5.05 has been formed.
🧩 Currently, there is an important resistance at 5.56, and the price has reached this level. If this zone is broken, dominance will turn bullish.
💥 For a bearish move in dominance, like other indices, we need to wait for a new structure to form.
❌ Disclaimer ❌
Trading futures is highly risky and dangerous. If you're not an expert, these triggers may not be suitable for you. You should first learn risk and capital management. You can also use the educational content from this channel.
Finally, these triggers reflect my personal opinions on price action, and the market may move completely against this analysis. So, do your own research before opening any position.
Usdtdominance

usdt.d(based on Neo wave)This is the final branch of corrective wave and with breaking down 5.15 the bullish wave of crypto begins . for more information follow every counting of charts.

Altcoin Recovery Depends on This USDT Dominance BreakAltcoins have taken a heavy hit — many are down 60–80% from their highs.
As seen in the USDT Dominance chart, we're still respecting the rising trendline. Until this trend breaks to the downside, pressure on altcoins may continue.
Key Zone to Watch:
Once USDT.D breaks below that rising support line and sustains a move lower, we could witness a strong recovery phase across the altcoin market. That shift will likely signal renewed confidence and capital rotation into risk-on assets.
Stay patient: The breakout is brewing. When that trendline cracks, altseason could ignite fast.
Keep your watchlists ready. The reversal will reward the prepared. 🚀
Like and drop a comment if you found our analysis helpful — your support keeps us going!

TradeCityPro | Bitcoin Daily Analysis #50👋 Welcome to TradeCity Pro
Let's move on to the 50th analysis of Bitcoin and key crypto indices in this analysis as usual I want to review the New York futures session triggers for you
🫶 Before starting the analysis I want to thank you for all the support you have given us along the way so that we could reach the 50th analysis I hope that the number of these analyses increases much more and that we are always with you and that you also benefit from the analyses❤️
⏳ 1-hour timeframe
Yesterday Bitcoin rose from the 82302 zone and moved upward finally forming a base after the sharp and deep decline it had and even managed to go above the 83808 zone
⚡️ I slightly adjusted this zone and moved it to 83510 because the price reacted better to this zone
💫 Currently, we are witnessing a rejection from the 84486 zone which has pushed the price back towards 83510 if selling volume increases the price may drop further
✔️ If the price goes below the 83510 zone again in lower timeframes and with the activation of the fake breakout trigger we can open a short-term short position the main trigger is in the 82302 zone
🔼 For a long position breaking 84486 is suitable and with this breakout, the price can start the next bullish leg the entry of RSI into Overbuy will also be a momentum confirmation and can cause us to see large bullish candles
👑 BTC.D Analysis
Moving on to Bitcoin dominance today dominance faced a rejection from 62.35 which could cause dominance to decline
💥 The trigger for confirming this rejection and the downtrend is in the 62.06 zone and breaking this zone could move the price towards the 61.81 and 61.63 zones
📈 Stabilization of dominance above 62.35 will also confirm the uptrend again
📅 Total2 Analysis
Moving on to the Total2 analysis yesterday the 1.01 trigger was activated and the price has also pulled back to it but today we have a trigger for both long and short positions
🔽 For a short position breaking 990 and for a long position breaking 1.02 can confirm opening positions on altcoins
📅 USDT.D Analysis
Moving on to USDT dominance a Head and Shoulders pattern has formed where the neckline in the 5.41 zone has also been broken and the price is pulling back to it
📉 If the price is rejected from the 5.41 zone we will confirm the activation of this pattern and with the break of 5.33 we can confirm the downtrend of dominance
⭐ For an uptrend in dominance breaking 5.41 and invalidating the pattern can be a suitable trigger
❌ Disclaimer ❌
Trading futures is highly risky and dangerous. If you're not an expert, these triggers may not be suitable for you. You should first learn risk and capital management. You can also use the educational content from this channel.
Finally, these triggers reflect my personal opinions on price action, and the market may move completely against this analysis. So, do your own research before opening any position.

USDT Dominance New UpdateIn short time frames, USDT.D has formed an Head and Shoulders pattern. If the neckline is broken, we expect a little dump in here which will make some of alts recover for a short while.
Due to BTC dominance is a lot higher than a week ago, I consider to long Bitcoin only.

TradeCityPro | Bitcoin Daily Analysis #49👋 Welcome to TradeCity Pro!
Let's dive into the analysis of Bitcoin and key crypto indices. As usual, I will review the futures session triggers for the New York market.
⌛️ 1-Hour Timeframe
In the 1-hour timeframe, as you can see, the downtrend continues, and yesterday the price dropped below 82,302, now reaching 81,520.
📊 Selling volume has increased in the market, and the SMA 25 has been tracking the price movement effectively in this cycle. Currently, as the price pulls back to 82,302, it is also testing the SMA 25, placing it in a critical zone.
🔽 For a short position, considering this pullback to the SMA 25, you can enter a trade if 81,520 breaks. The next support level in case of a further decline is 80,105.
📈 For a long position, we still need to wait for a proper trend reversal structure to form. There is no valid trigger for a long entry at this moment.
👑 BTC.D Analysis
Now, let’s analyze Bitcoin dominance. Yesterday, the ascending trendline was broken, but the trigger at 62.06 was not activated, leading to a bullish move instead.
⚡️ Currently, 62.30 has broken, and if this breakout holds, dominance could rise to 62.66.
💥 However, if the 62.30 breakout turns out to be a fakeout, a break below 62.06 would confirm a bearish trend reversal.
📅 Total2 Analysis
Moving on to Total2, yesterday the 0.984 support broke, but it now appears to be a fakeout, as the price is stabilizing back above this level.
💫 For a short position, confirmation will come if the price closes below 0.984. If that happens, the next downside target would be 0.953.
🔼 For a long position, a break above 1.01 would confirm the trend reversal, given the fakeout at 0.984.
📅 USDT.D Analysis
Now, let’s analyze USDT dominance. A range has formed between 5.41 and 5.56, and dominance has rejected from 5.41, now moving downward again.
✔️ If 5.41 breaks, it would be the first confirmation of a trend change.
✨ For a bullish continuation, a break above 5.56 would confirm the next bullish leg.
❌ Disclaimer ❌
Trading futures is highly risky and dangerous. If you're not an expert, these triggers may not be suitable for you. You should first learn risk and capital management. You can also use the educational content from this channel.
Finally, these triggers reflect my personal opinions on price action, and the market may move completely against this analysis. So, do your own research before opening any position.
TradeCityPro | Bitcoin Daily Analysis #48👋 Welcome to TradeCity Pro!
Let's dive into the analysis of Bitcoin and key crypto indices. As usual, in this analysis, I will review the futures session triggers for the New York market.
⌛️ 1-Hour Timeframe
In the 1-hour timeframe, as you can see, yesterday the price made a pullback and a correction, briefly moving above the SMA 25, but now it has dropped back below this level.
🔍 This correction has reinforced the 82,302 level as a stronger support, making a break below this area even more significant.
💫 If 82,302 breaks, I strongly recommend having a short position, as breaking this level could initiate the next bearish leg.
🔼 For a long position, our current trigger is 83,808, but this is a risky trigger, and I believe it's better to wait for the market to establish a new structure.
👑 BTC.D Analysis
Now, let’s analyze Bitcoin dominance. The dominance remains bullish and is currently stabilizing above 62.30.
✔️ If this level holds, the next resistance will be 62.66, and dominance could initiate another bullish leg toward this zone.
🔽 For a bearish move, we need to wait for the ascending trendline to break and then confirm the downtrend with Dow Theory before considering short positions.
📅 Total2 Analysis
Moving on to Total2, yesterday the price closed below 1.01, and now it has pulled back to retest this level. It seems ready to initiate the next bearish leg.
📉 For a short position, breaking 0.984 remains the key trigger. If this level breaks, you can enter a position.
🔼 For a long position, we need to wait until the strong bearish momentum fades and buyers start entering the market.
📅 USDT.D Analysis
Now, let’s analyze USDT dominance. As you can see, dominance has completed a bullish leg, followed by a slight correction, and now it has regained bullish momentum and is moving upward again.
💥 For further upside, breaking 5.49 is the key trigger to enter a long position.
⚡️ For a bearish move, we need to wait for a new bearish structure to form before considering short positions.
❌ Disclaimer ❌
Trading futures is highly risky and dangerous. If you're not an expert, these triggers may not be suitable for you. You should first learn risk and capital management. You can also use the educational content from this channel.
Finally, these triggers reflect my personal opinions on price action, and the market may move completely against this analysis. So, do your own research before opening any position.

TradeCityPro | Bitcoin Daily Analysis #47👋 Welcome to TradeCity Pro!
Let's dive into the analysis of Bitcoin and key crypto indices. As usual, in this analysis, I will review the futures session triggers for the New York market.
⌛️ 1-Hour Timeframe
In the 1-hour timeframe, as you can see, yesterday the 83,808 trigger was activated, and the price moved down to the next support at 82,302.
⚡️ The 19.70 level in the RSI is a crucial area, as the price has reacted to this level in the last two bearish legs, leading to slight corrections.
✔️ Today, it might be a bit late to open new positions, as the price is slightly oversold, suggesting that the move has already extended sufficiently.
🔽 This situation means we should enter positions with lower risk today. The short trigger for today is 82,302, and if this level breaks, the price could decline even further.
📈 For a long position, we need to wait for confirmation of a trend reversal. First, the SMA 25 must reach the price, and then a Dow Theory confirmation should establish a new bullish trend.
👑 BTC.D Analysis
Now, let’s analyze Bitcoin dominance. As you can see, this index increased yesterday as the market dropped. It briefly faked out above 62.14 before reversing downward again.
🎲 At the moment, 62.14 remains a key trigger for bullish dominance, while the main support level is 61.81.
📅 Total2 Analysis
Moving on to Total2, this index is in bad shape. It has broken its key support at 1.01 and is now moving toward 0.984.
💥 I can't provide any specific trigger for this chart today because it has dropped significantly without any corrections. For now, we need to wait for a new structure to form.
📅 USDT.D Analysis
Now, let’s look at USDT dominance. Yesterday, dominance finally stabilized above 5.34, which triggered a market drop.
🔍 Currently, USDT dominance has reached the next resistance at 5.48 and has shown a reaction to this level. To confirm further upside, we need a break above 5.48. If a correction starts and we see more red candles, the price could retrace back down to 5.34.
❌ Disclaimer ❌
Trading futures is highly risky and dangerous. If you're not an expert, these triggers may not be suitable for you. You should first learn risk and capital management. You can also use the educational content from this channel.
Finally, these triggers reflect my personal opinions on price action, and the market may move completely against this analysis. So, do your own research before opening any position.

USDT Dominance 4 HourThe chart is self explanatory.. The next candle will conform the short term trend.
Place your entries in ALTS having RSI breakout or divergence i:e WIFUSDT
Manage your risk.
Not a Financial Advice

TradeCityPro | Bitcoin Daily Analysis #46👋 Welcome to TradeCity Pro!
Let's dive into the analysis of Bitcoin and key crypto indices. As usual, in this analysis, I will review the futures session triggers for the New York market.
⌛️ 1-Hour Timeframe
In the 1-hour timeframe, as you can see, yesterday the 86,401 trigger was activated, and the price moved downward. Since the price was making lower highs, I anticipated this move yesterday, and now the price is near 83,808, approaching this support level.
✔️ At this point, I believe the price has declined sufficiently, and it may start forming a base around 83,808. However, for a short position, this same 83,808 level is key, and we can enter a position if it breaks below this area.
🔼 For a long position, we need to wait until at least the SMA 25 reaches the price and the price stabilizes above this zone. Once the trend turns bullish, we can consider opening a long position.
👑 BTC.D Analysis
Moving on to Bitcoin dominance, as the market declined and Bitcoin broke support, dominance increased. This helped Bitcoin hold up better than other coins, which experienced heavier losses.
📊 Currently, dominance has reached 62.14 and faced a strong rejection from this level. If a corrective phase begins, the key support area for price is 61.81, and the price could retrace to this level.
✨ For a bullish move in dominance, a break above 62.14 is required, with the next resistance at 62.30.
📅 Total2 Analysis
Now let’s analyze Total2. As I mentioned, altcoins have experienced a much sharper decline than Bitcoin, and after breaking 1.06, Total2 started a strong downtrend, even breaking through 1.04.
🎲 Currently, the price is fluctuating between 1.01 and 1.04, and it seems that the trend is showing signs of weakness, indicating that this bearish leg may be ending. If a correction begins, the price could move up to 1.04. However, for the next short position, the trigger level to watch is 1.01.
📅 USDT.D Analysis
Now let’s analyze USDT dominance. This index broke through the key 5.19 level and has risen to 5.34.
🌩 If a candle closes above this level, the next major resistance is at 5.45. In case of a pullback, the key support to watch is 5.25.
❌ Disclaimer ❌
Trading futures is highly risky and dangerous. If you're not an expert, these triggers may not be suitable for you. You should first learn risk and capital management. You can also use the educational content from this channel.
Finally, these triggers reflect my personal opinions on price action, and the market may move completely against this analysis. So, do your own research before opening any position.

$ZIL is sitting on a strong!GETTEX:ZIL is sitting on a strong long-term support line
Every touch in the past led to a solid move up.
Now back at the same zone — eyes on a potential bounce toward $0.02–$0.03.
Retweet if you're bullish!
#Altcoins #Crypto

USDT.D update (1H)USDT.D has vioalated the previous analysis. It's breaking out the parallel channel which may engage a bullish flag pattern to activate.
As an extra, there will be PCE reports coming soon. If you see green candles on assest, don't dive in to long positions blindly.
Many of the parameters and signals are showing that prices about to go cheapher.
Market might be about getting close to another crash!

USDT.DOMINANCE 4HOUR CHART UPDATE !!A downward trend in USDT dominance typically signals growing confidence in riskier assets (such as Bitcoin and altcoins), as traders move funds out of stablecoins and into crypto investments.
Breakout Attempt
The latest price action shows a breakout from the descending channel.
This signals a potential reversal, during which traders may return funds to USDT due to market uncertainty or a correction in crypto prices.
The black line forecasts a strong upward move in USDT dominance.
If this happens, it could indicate that investors are selling crypto holdings and moving funds into stablecoins in anticipation of a market decline.
If you found this analysis helpful, hit the Like button and share your thoughts or questions in the comments below. Your feedback matters!
Thanks for your support!
DYOR. NFA

TradeCityPro | Bitcoin Daily Analysis #45👋 Welcome to TradeCity Pro!
Let's dive into the analysis of Bitcoin and key crypto indices. In this analysis, as usual, I want to review the futures session triggers for the New York market.
⌛️ 1-Hour Timeframe
In the 1-hour timeframe, as you can see, the price is still within a ranging box between 86,401 and 88,480.
🔍 The price is making lower highs, and it seems that the bullish momentum has faded. However, valid triggers for both short and long positions can still be found.
✨ For a short position, you can enter if the price breaks below 86,401. In this case, the price could extend its corrective leg down to 84,734.
🔽 For a long position, you can enter if the price breaks above 88,480. This is a very important trigger and could start the next bullish leg up to 91,588.
👑 BTC.D Analysis
Let's move on to Bitcoin dominance. This dominance has formed a bit more structure, and its triggers are also close.
⚡️ If 61.63 breaks, we confirm a bearish trend, and if 61.81 breaks, we confirm a bullish trend.
📅 Total2 Analysis
Let's analyze Total2. This index also has a ranging box between 1.06 and 1.08, which can provide good trading opportunities.
💫 If 1.08 breaks, we confirm a long position for altcoins. For a short position, a break of 1.06 is suitable.
📅 USDT.D Analysis
Now, let’s analyze USDT dominance. As you can see, we are witnessing a downtrend, and now a box has formed between 5.19 and 5.05.
🧩 To confirm a bullish move in dominance, we need a break above 5.19. The bearish triggers for USDT dominance are 5.11 and 5.05.
❌ Disclaimer ❌
Trading futures is highly risky and dangerous. If you're not an expert, these triggers may not be suitable for you. You should first learn risk and capital management. You can also use the educational content from this channel.
Finally, these triggers reflect my personal opinions on price action, and the market may move completely against this analysis. So, do your own research before opening any position.

TradeCityPro | Bitcoin Daily Analysis #44👋 Welcome to TradeCity Pro!
Let's dive into the analysis of Bitcoin and other important crypto indices. As usual, I want to review the futures triggers for the New York session for you.
⏳ 1-Hour Timeframe
In the 1-hour timeframe, as you can see, yesterday Bitcoin managed to stabilize above 86876 and moved up to 88480.
⚡️ Currently, the area that the price has reacted to is 86401, so I moved the 86401 line from 86876.
💥 As I mentioned yesterday, if the RSI had stayed above 70, the movement could have continued, which it did, but the RSI did not stabilize above 78.58 and we did not witness a pump.
💫 With the break of the 70 area in the RSI, the upward momentum disappeared and the corrective phase of the price began. The market volume is currently in favor of the buyers and has decreased during the correction.
🔽 Today, for a short position, you can enter a risky position with a break of 86401 because the market trend is currently upward and all short positions are considered risky for now.
📈 For a long position, we currently don't have any specific triggers sooner than 88480, and if you want to open a position sooner, you need to wait for more structure to be created and catch triggers in lower timeframes.
👑 BTC.D Analysis
Let's move on to the analysis of Bitcoin dominance, yesterday the dominance made a lower peak than 61.80 and was rejected from 61.76.
✨ Currently, a box has formed between 61.35 to 61.76, and breaking any of these areas could confirm and start the next leg.
📅 Total2 Analysis
As for Total2, as you can see, this index is doing much better than Bitcoin and has made less correction because dominance was rejected from 61.76 yesterday.
🔑 Today, I don't have a short trigger for Total2 because it's very bullish, but for a long, the trigger of 1.09 is very suitable and with a break of this area, we can witness the next bullish leg up to 1.12.
📅 USDT.D Analysis
Let's look at the USDT.D, it seems a range box is forming between 5.15 and 5.05, and breaking either of these areas could be important.
🎲 A break of 5.05 for a short, especially if it coincides with a break of 1.09 in Total2, would be very appropriate.
❌ Disclaimer ❌
Trading futures is highly risky and dangerous. If you're not an expert, these triggers may not be suitable for you. You should first learn risk and capital management. You can also use the educational content from this channel.
Finally, these triggers reflect my personal opinions on price action, and the market may move completely against this analysis. So, do your own research before opening any position.

Bullish! On usdt.d that is Gotta love a good bull trap! Pump it to dump it, bearish scenarios are invalidated at 93k BTC. Targets remain @ 72k, 70k and 68k with a slight possibility of 62k

TradeCityPro | Bitcoin Daily Analysis #43👋 Welcome to TradeCity Pro!
Let's dive into the analysis of Bitcoin and other key crypto indices. As usual, I want to discuss the futures triggers for the New York session.
⏳ 1-Hour Timeframe
In the 1-hour timeframe, as you can see, Bitcoin finally moved, activating our trigger, and it reached its target. Now, let's analyze today's triggers.
🔄 Yesterday, the breakout of the 84734 range box was activated, and the price made an upward move.
✔️ Currently, the price has reached 86876 and has been rejected from this area but is still above it. If it can stabilize above this area, the next price leg could start.
💥 The RSI oscillator has significant resistance at 78.58, and breaking this area could introduce a lot of momentum into the market, potentially starting a robust upward leg.
⚡️ Additionally, this oscillator has important support at 70, and if it can maintain above this area, the likelihood of breaking 86876 increases.
🔽 For short positions, we need to wait for the price momentum to turn bearish before entering in line with the trend direction.
🧩 If the price does not stabilize above 86876 and moves downward, with confirmation from Dow Theory or the activation of a fake breakout trigger, you can enter a short position.
👑 BTC.D Analysis
Let's move on to the analysis of Bitcoin dominance. Yesterday, dominance was supported at 61.35 and moved up to 61.80, which helped Bitcoin rise more than altcoins.
🧲 Currently, dominance has been rejected from 61.80 and is moving downwards. I believe a range has formed between 61.35 and 61.80, and breaking this box in either direction could determine the next leg of dominance.
📅 Total2 Analysis
Moving on to Total2, yesterday the price broke the 1.05 area and moved upwards, even surpassing 1.07. Currently, I have moved the 1.05 area to 1.06 because it is more accurate, and the price has moved away from it.
⭐ The next resistance for the price is at 1.09, and it seems that Total2 could move up to this area.
📅 USDT.D Analysis
Finally, let's look at the Tether dominance analysis. Yesterday, the 5.25 trigger in dominance was activated, and we observed a clean pullback in dominance that brought it down to 5.13.
✨ The next support for dominance is at 5.08, and we need to see if it can stabilize below this area or not.
❌ Disclaimer ❌
Trading futures is highly risky and dangerous. If you're not an expert, these triggers may not be suitable for you. You should first learn risk and capital management. You can also use the educational content from this channel.
Finally, these triggers reflect my personal opinions on price action, and the market may move completely against this analysis. So, do your own research before opening any position.

Market Shift Incoming! USDT Dominance Nears Critical Turning PoiThe USDT Dominance (USDT.D) chart is currently testing a strong resistance zone, where price action is showing signs of exhaustion. A bearish RSI divergence has formed, indicating potential weakness and a possible correction. The rising support line has provided multiple bounces, but a breakdown from this structure could trigger a larger downside move.
If USDT dominance falls, liquidity will likely shift into altcoins, potentially fueling a bullish rally in the altcoin market. Conversely, if USDT dominance continues to rise, it could signal increased market fear, leading to further weakness in altcoins.

TradeCityPro | Bitcoin Daily Analysis #42👋 Welcome to TradeCity Pro!
Let's delve into the analysis of Bitcoin and other key crypto indices. As usual, I will review the futures triggers for the New York session for you.
⏳ 1-Hour Timeframe
In the 1-hour timeframe, as you can see, the price still maintains a range box between 83808 and 84734, and the market volume has decreased even more from yesterday.
📊 The less the volume, the closer we are to a price movement, so again, keep an eye on the market to ensure you don't miss any active triggers.
⚡️ For a short position, you can enter with a break of 83808, and for a long position, with a break of 84734.
👑 BTC.D Analysis
Let's move to the analysis of Bitcoin dominance. Yesterday, the support at 61.43 was broken, and it's moving towards 61.08.
✔️ Currently, I don’t have any specific triggers for confirmation in dominance, but as long as the dominance stays below 61.43, I see it continuing its downward trend.
📅 Total2 Analysis
On to the analysis of Total2, the trigger at 1.05 is about to be activated, and the price could move towards 1.07 with a break of this area.
🔽 The short trigger remains at 1.04 for now.
📅 USDT.D Analysis
Finally, looking at the Tether dominance, this index is still ranging between 5.25 and 5.34.
💫 A break of either of these areas could determine the next leg of the price movement.
❌ Disclaimer ❌
Trading futures is highly risky and dangerous. If you're not an expert, these triggers may not be suitable for you. You should first learn risk and capital management. You can also use the educational content from this channel.
Finally, these triggers reflect my personal opinions on price action, and the market may move completely against this analysis. So, do your own research before opening any position.

USDT.D(based on NEo wave)The first bearish wave is a complex ( symmetrical and diametrical) which I consider this as A wave and the bullish wave is also a diametrical that I consider this as B wave which is ending and after this we can see a heavy bearish wave which can make ETH above 5000$.

TradeCityPro | Bitcoin Daily Analysis #41👋 Welcome to TradeCity Pro!
Let's delve into the analysis of Bitcoin and important crypto indices. Today, as usual, I aim to review the New York session futures triggers for you.
⏳ 1-Hour Timeframe
In the 1-hour timeframe, as you can see, Bitcoin is still in a range box between 83808 and 84734, and the market volume is continuously decreasing.
📊 The market volume has reached its lowest possible level, indicating that a move is imminent, so be alert today as the likelihood of our triggers activating is very high.
🔼 For a long position, entering at a break of 84734 could be beneficial, as breaking this area could start a bullish leg up to 86876.
📉 For short positions, a break of 83808 remains suitable. Yesterday, the price briefly breached this area but seemed to rebound, making it still appropriate for positioning.
👑 BTC.D Analysis
Moving on to Bitcoin dominance analysis, as you can see, dominance was rejected from the high of 61.63 yesterday, then set a lower high compared to this area, and now the floor of 61.43 has been broken.
💫 Currently, with the break of 61.43, dominance could move down to 61.08. However, if the break of 61.43 proves to be a fake-out, the likelihood of breaking 61.63 increases.
📅 Total2 Analysis
Let’s talk about Total2; this index doesn't have a very reliable trigger right now, and you can still enter a position with a break of 1.07, but if the price reacts to 1.05, on a second contact, entering on a break of this area might be viable.
🔽 For short positions, a break of 1.04 is suitable, and you can enter a position with the break of this area.
📅 USDT.D Analysis
Lastly, analyzing Tether dominance, it is still ranging and has formed a box between 5.25 and 5.34.
✔️ For a downward trend in dominance, you can confirm with a break of 5.25, and for an upward trend, a break of 5.34 will serve as your confirmation.
❌ Disclaimer ❌
Trading futures is highly risky and dangerous. If you're not an expert, these triggers may not be suitable for you. You should first learn risk and capital management. You can also use the educational content from this channel.
Finally, these triggers reflect my personal opinions on price action, and the market may move completely against this analysis. So, do your own research before opening any position.

TradeCityPro | Bitcoin Daily Analysis #40👋 Welcome to TradeCity Pro!
Let's delve into the analysis of Bitcoin and important crypto indices. Today, as usual, I aim to review the New York session futures triggers for you.
⏳ 1-Hour Timeframe
In the 1-hour timeframe, as you can see, the price has pulled back to below the 84734 area again today.
🔽 The short trigger we have for today is the break of 83808. With the break of this area, the price could move downwards.
✅ The important supports are at 82459 and 80105, which we can use as targets.
📈 For a long position, entering at a break of 84734 could be beneficial, with a target at 86876.
👑 BTC.D Analysis
Moving on to the Bitcoin dominance analysis, a support was established yesterday at 61.43, creating a price box between 61.43 and 61.63.
💫 To confirm an upward trend in dominance, watch for a break of 61.63, and for a downward trend, a break of 61.43 will serve as a confirmation.
📅 Total2 Analysis
Let’s talk about Total2; this index has broken its support at 1.04, and if Bitcoin also loses its support, it could move down to 1.01 again.
🎲 If you don't have positions open, you might consider looking for altcoins that have not yet lost their support, or wait for Bitcoin.
🔼 For long positions, the trigger for Total2 remains at 1.07.
📅 USDT.D Analysis
Lastly, analyzing Tether dominance, it has come back above 5.26, pulled back to this area, and is poised to potentially initiate an upward leg to 5.46.
✔️ The upward dominance trigger for Tether is a break of 5.31. With the break of this area, we can expect dominance to potentially rise again to 5.46.
📉 For downward dominance, a break of 5.26 is a suitable trigger.
❌ Disclaimer ❌
Trading futures is highly risky and dangerous. If you're not an expert, these triggers may not be suitable for you. You should first learn risk and capital management. You can also use the educational content from this channel.
Finally, these triggers reflect my personal opinions on price action, and the market may move completely against this analysis. So, do your own research before opening any position.

USDT.DOMINANCE WEEKLY CHART UPDATE. Current Market Structure:
Breakout Confirmation: USDT Dominance has broken out of its descending trendline and is now in a retest phase.
50MA as Support: The 50-week moving average now acts as dynamic support, reinforcing the bullish outlook.
Rejection or Breakout? The price is currently testing resistance. If it gets rejected, a temporary pullback is likely before further gains.
If you found this analysis helpful, hit the Like button and share your thoughts or questions in the comments below. Your feedback matters!
Thanks for your support!
DYOR. NFA
