USDTHB fomred bullish butterfly | Upto 4.5% bull move.Priceline of US Dollar / Thai Baht forex pair has formed a bullish butterfly pattern and entered in potential reversal zone to hit the sell target soon insha Allah.
This PRZ area is also a stop loss point, in case of complete candle stick closes below this area.
MACD is turning bullish, it was strong bearish now turned weak bearish.
RSI is oversold.
Stochastic is oversold.
Volume profile of complete pattern is showing less interest of traders at this area.
I have used Fibonacci sequence to set the targets:
Buy between: 30.772 to 30.397
Sell between: 31.064 to 31.770
Enjoy your profits and regards,
Atif Akbar (moon333)
USDTHB
USDTHB hits the support of channel | a good long opportunityThe priceline of USDTHB is moving within an Up channel and hits at the channel's support.
The MACD is turning bullish.
RSI is oversold.
Stochastic is oversold and gave bull cross.
The sell targets are as below:
Short between: 30.912 to 30.966
Regards,
Atif Akbar (moon333)
USDTHB Downward Trend Continues The Thai baht over the past week started out the week sideways, but like the Singapore dollar ended the week up. This pair is a bit more impacted recently from political risk surrounding its election and because of this we may see more volatility not related to technical or fundamental components. Nonetheless, its important to keep in mind the overall trend remains downward sloping and a continued weakening of the US dollar. Moreover, price action remained in theshort-term trend line resistance range at the week's end reinforcing the notion that linear downward resistance is difficult to break. Additionally, the technical picture for USDTHB over the next week looks like it could revert back to the mean where RSI points towards overbought and the bull bear indicator suggests USDTHB long is overcrowded. Meanwhile, exponential moving averages also suggest continuation of our downward trend. In sum, USDTHB is still short.
For more of my analysis, please check out www.anthonylaurence.wordpress.com
USDTHB Stalled Momentum, Still Trends DownOrdinary least squares method suggests we are still trending down in this pair even as many other Southeast Asian currencies are trending much further down such as USDSGD as can be seen here: In that respect, Thailand is an under-performer, but momentum has stalled even though some of the technicals are pointing towards a bit of an upward rebound. However, I am of the view that we still need to trend down a bit more before this sentiment can be achieved.
If you are interested in any more of my analysis that focuses on foreign exchange and equities, please check it out here anthonylaurence.wordpress.com
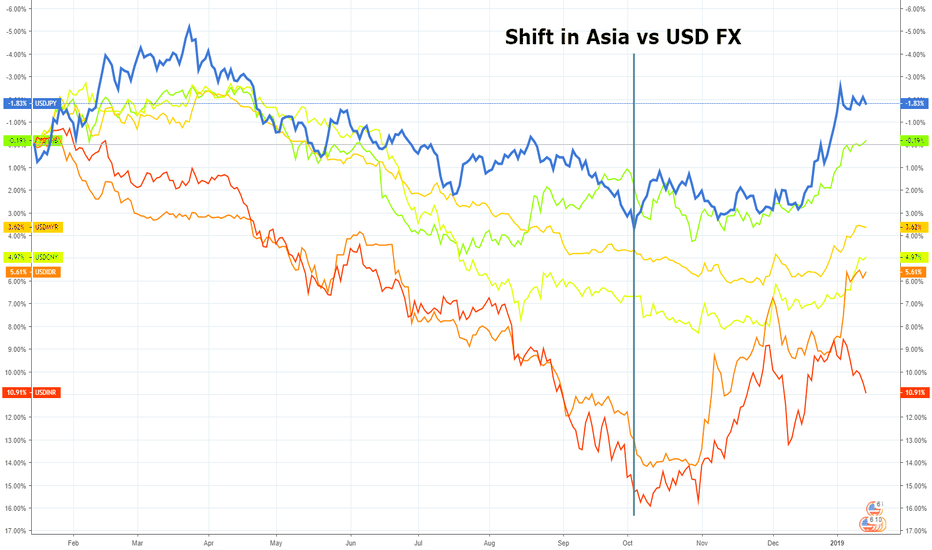
Asia Forex: Comparison chart vs USDFor the purposes of taking a broader view of movements in forex markets...
Chart: 1-year performance of JPY, THB, MYR, CNY, IDR, INR vs the USD (inverted)
Since October, there has been a marked improvement in the performance of Asian currencies. The change means Asian currencies have paired losses over the last 12 months, with the yen and Tai bot entering the black.
A relief rally or turning point for Asia FX?
Short USD/THB: Downtrend to ContinueUSD/THB is in a down-down trend, as evidenced by the 3-6-20 MACD signal line and 12-26-9 MACD signal line. It is also trading within a relatively wide channel (two parallel green lines). I have included the 7-day Moving Average as well, because since the middle of December, the MA has served as a reliable resistance level that the pair has yet to meaningfully break through in the new year.
As some background, the pair began a long up trend in April, peaking in July at 33.525. Since then, has been a gradual down trend, with some potential reversals, but not enough to break the down trend. On the way up, the pair found support around 31.858 (horizontal green line), and that is the next major support line that the pair is moving towards. I think that the slight bounce that the pair has had over the last two sessions are within reason of the down-down trend, and I expect it to continue downwards.
Trade: Sell USD/THB @ 32.023
Stop Loss @ 32.106 (previous day's high) - if it breaks above here, then the channel trend is also broken, implying a potential reversal in the down-down trend
Take Profit @ 31.858 (level of significant support back in May and June)
I've also included some previous resistances that the pair hit since it began its down trend in July. Notably, the blue horizontal line is the level of resistance back in early September that the pair failed to break through. You will see that more recently, this level of resistance was tested again in early December, and when that failed to break through, the pair continued downwards. The red horizontal line is another resistance level that was tested at the end of September. The pair initially failed to break through, but regained momentum in October to begin a short bounce upwards. However, at the end of the year, the pair began testing that resistance level again, this time as a support, and when it failed to find support, it broke through downwards, rather dramatically. This leads us to where we are today, in a down-down trend, and within a downwards channel.
USD/THB 1H Chart: Descending triangle in sightThe USD/THB currency pair has been trading in a descending triangle since the end of October.
From a theoretical point of view, a breakout north from the pattern occurs in the nearest future. A potential upside target is the upper boundary of the medium-term descending channel located circa 3.24. Technical indicators for the 1W time frame support bullish scenario.
However, important resistance level to surpass is a combination of the 55-, 100– and 200-hour SMAs in the 32.96 area. If given level holds, it is likely that the pair goes downside to the Fibonacci 38.20% retracement at 32.58.
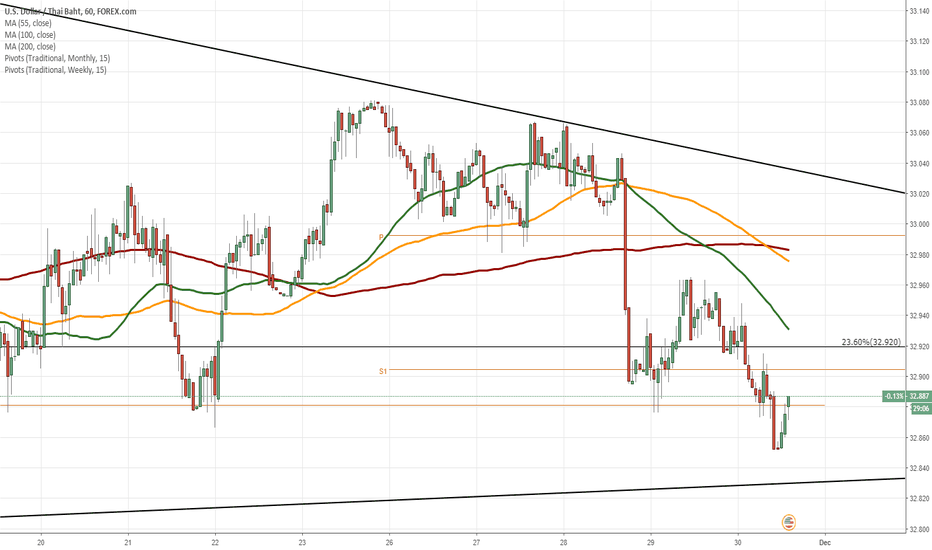
USD/THB 1H Chart: Bearish momentumThe US Dollar has been depreciating against the Thai Baht in a short-term descending channel after the exchange rate reversed from the upper boundary of a long-term descending channel at 33.05.
As apparent on the chart, the currency pair has breached the support level formed by a combination of the 100– and 200-period SMAs (4H). Given this fact, it is likely that the downside momentum still prevails in the nearest time. The most probable downside target during the following trading sessions is the Fibonacci 50.00% retracement at 32.31.
In the unlikely event that some bullish pressure still prevails in the market, the US Dollar should not exceed the Fibonacci 23.60% retracement at 32.94.
Target hit. Now reversing on a Channel Down. Short.TP = 33.600 hit as the previous 1D Channel Up aggressively broke to the upside (as indicated by the 4H consolidation mentioned on the previous post) and peaked at 34.650. Now a new 1D Channel Down has emerged (RSI = 30.614, MACD = -0.139, Highs/Lows = -0.2244, B/BP = -0.4740) aiming at a Lower Low near the 31.850 support. We are short with TP = 32.000.
USD/THB 1H Chart: Potential reversalThe Thai Baht has been appreciating against the US Dollar since the end of August. This movement is bounded by a descending channel.
Currently, the currency pair is trading near the lower channel line at 32.43. From the theoretical point of view, the pair could reverse from the lower boundary of given channel and aim for the resistance cluster formed by a combination of the 55-, 100– and 200-hour SMAs in the 32.60/32.73 range. An important resistance level to look out for is the Fibonacci 38.20% retracement at 32.59.
Technical indicators for the 1W time-frame also support bullish scenario.
USD/THB 1H Chart: Reveal of dominant patternThe previous review of the USD/THB currency exchange rate concentrated on the newly formed less steep bullish pattern. On Tuesday, the pattern was still in force, as the currency exchange rate was declining in the borders of it.
However, something else attracted the attention of Dukascopy Analytics. Namely, a long term, large scale channel up pattern was spotted on the larger time frame charts. It might be possible that in the near future the bounce off from this trend line forces the rate lower and gives it enough strength to break the medium scale ascending pattern.
However, in the short term watch the support of the 55-hour simple moving average, which clearly provided support on Tuesday.
Consolidation before Channel Up continuation. Long.USDTHB should enter a consolidation phase on 4H (as seen on the Rectangle with high volatility, ATR = 0.0861) in order to bring down the overbought values on the most recent bullish run on the 1D Channel Up (RSI = 72.893, Williams = -12.000). The suggested course of action is to buy on every dip within the Rectangle, TP = 33.600.
USDTHB. Triangular consolidation is possible.This pair broke above the long term resistance (yellow) last month.
EM currencies suffer a lot these days amid strong dollar and rising yields.
USDTHB could finish triangular consolidation soon.
The target for the further rise of USDTHB is set within the orange box at the 0.382-0.618 Fibonacci.
Wait if price could break above the triangle's upside.
USD/THB 1H Chart: Bears expected to prevailThe US Dollar has been trading in an ascending channel against the Thai Baht for the last two months. This has guided the pair from its 2014/2018 low of 31.10 towards the 61.80% Fibonacci retracement at 32.20.
From theoretical point of view, the pair has failed to form a new high this week which might be an early indication of a new wave down. In case the senior channel and the 200-hour SMA are breached at 31.97, the Greenback is likely to depreciate even further down to the 38.20% Fibo.
Given that these retracement lines have worked effectively at reversing the pair during the last week, it is likely that the pair continues respecting this junior channel and therefore reverses back to the upside. The general direction should nevertheless remain south.
Meanwhile, there is still some upside potential in the market that could result in a test of the monthly R3 at 32.30 within the remaining part of this week.
Short opportunity on the Thai.Price has tested Weekly supply, Over exceeded demand, Producing Daily supply,
Price coming up to Daily supply, I'm looking to short here.
Limit order placed based on 3 timeframe analysis. If it hits my SL, I can always re entry as long as there is sign of sellers.
If you are applying Supply & Demand methodology in your trading plan, or mere interest,
Be sure to follow me on Tradingview and share your views.
USD/THB 4H Chart: Breakout form triangle USD/THB 4H Chart: Breakout form triangle
The American Dollar was trading against the Thai Baht in a two-week long symmetrical triangle. In result of the previous trading session the currency rate made a breakout to the bottom. The bearish movement is not evident yet. Nevertheless, the slipping 55- and 100-period SMAs together with the weekly PP suggest that sudden surge is unlikely.
However, in larger perspective the soar is expected to continue, as in the end of November the pair made a rebound from the lower trend-line of a four-month long descending channel. An upcoming decision on the US interest rate hike as well as growing economy also point out in favour of further appreciation of the buck.
To certain extent, market sentiment confirms this assumption, as 72% of traders are bullish on pair. However, such common view might be also a signal of the upcoming turnaround.


