Fed manipulates dollar and euroAfter FED started buying American stocks (including junk American corporate bonds) SP500 became a zombie and so USD and EUR since Dollar Index / EURUSD are strongly correlated with SP500. You can see the artificial zombious SP500 build up, and the same replicated bricks in Euro. This is not "trading". Wherever FED decides to drive the stocks market, so euro and dollar will go. The entire forex lags after SP500 - www.researchgate.net
Usdx

Dollar rally coming...Fractal pattern from 1990s in play again. Though this pattern seems to be of bigger scale, so the move might be bigger.
We should see a vertical rally for several weeks to the last swing high with continuation.

Dollar index: dragon patternI have been posting this gap breakout earlier but now, after adding half yearly opening range and A up pivot breakout, things become more clear.
Dragon pattern. Dragon head, 2 humps and now a long tail started to form. It will go up to the target and will draw waving dragon's tail-end there.
Look up for dragon pattern on google to understand.
For educational purposes.
Dollar might flyAfter applying half yearly ACD to Dollar Index a breakout becomes clearly visible..
In cases of of A pivot breakout on half yearly ACD , moves are often massive.
Triangle or pennant continuation pattern is visible at the A-pivot breakout level.
Price is likely to move the size of a pennant pole at least.

The US dollar 💵 has been taken over by bears.In a couple of days we will see the dollar decline as all price action signals in the past couple days has shown weakness in the **strength** of the dollar.

USDX - Gap breakoutUS dollar index. 4 hrs. Breakout OK. DM projection suggests it will end at monthly R1. Retest is possible but not guaranteed. The global demand for dollar seems to be high as it gaps above supply.
Top Absolute Correlation
1 USDX - USDCHF 85.0%
2 USDX - GBPUSD -81.4%
3 USDX - EURUSD -80.0%
4 USDX - AUDUSD -73.2%
5 USDX - USDRUB 72.3%
6 USDX - USDCZK 72.2%
7 USDX - XAGUSD -71.9%
8 USDX - EURCZK 70.9%
9 USDX - GER30 -69.9%
10 USDX - USDSGD 68.7%

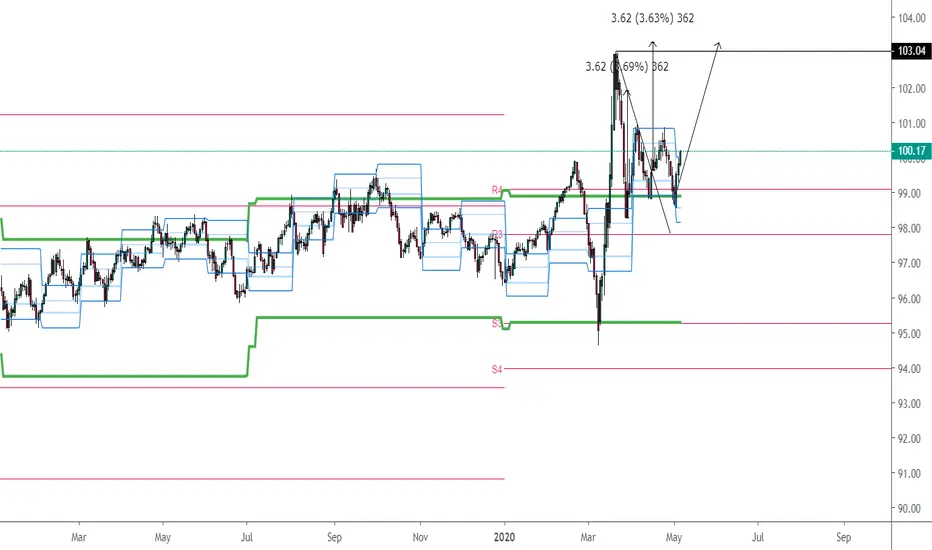
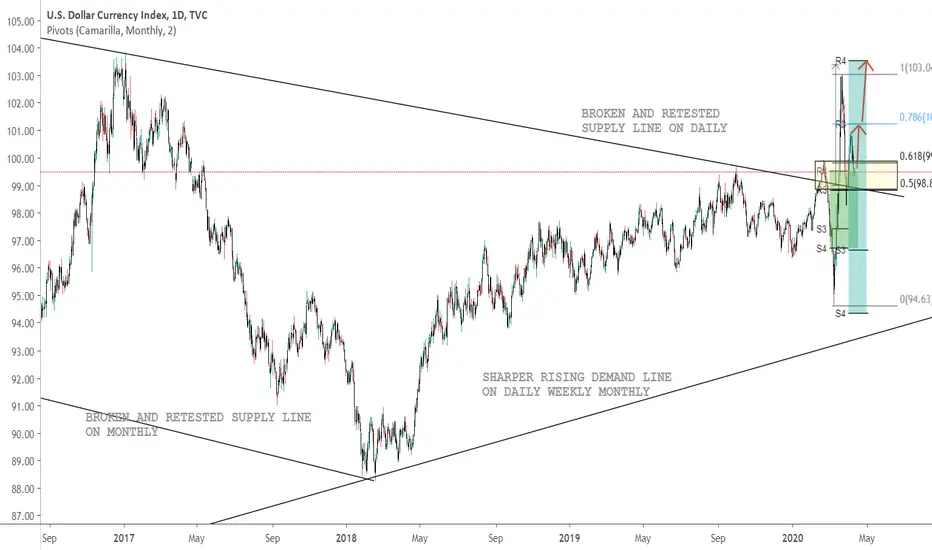
Post-breakout pullback into FIB zoneI have been taking a look into dollar index and a strong push up is very likely next 2 weeks,
considering all the conditions of what happened:
1. Breakout of descending daily supply trendline (breakout candle - strong bullish, second post breakout candle strong bullish)
2. Trendline breakout retested (important factor: price stayed above the trendline after the retest - uptrending confirmed)
3. Classic pullback into Fib zone (50-61) and retest of last month roof R4 (March breakout level).
4. Demark breakout slingshot projection gives target near April R4 confirming the breakout and April camarilla levels. Also, April resistance CAMR3 coincides with 78 fib level.
In the Fib zone we do have untested missed monthly pivot - the question is if price is gonna test it? But then again - missed pivots mark the starts of strong trends.
At any case, push back under the trendline does not make much sense.
DXY Will Keep Melting Below 95.14DXY is on a huge crash over last week after two consecutive weekly growing. And still DXY is highly bearish biased so I expect the price would go below 95.14. Price has declined by 4.52% for the last week. The price is moving inside the two parallel lines as I have marked up on the chart.


TIME TO GO LONG FOR USD. DXY AT LAST LEG FOR TRIPLE CORRECTION?USDX might already start forming C of Z if B already completed.

DXY Elliott Wave View: Pullback An Opportunity For BullsShort term Elliott Wave view in DXY suggests that the rally from March 09, 2020 low is unfolding as an Elliott wave impulse structure. And shows a higher high sequence in higher time frame charts favoring more upside. While the initial rally to $98.81 high ended wave (1) in lesser degree 5 wave structure. Down from there, wave (2) pullback ended at $97.45 low. The internals of that pullback unfolded as Elliott wave zigzag structure where wave A ended at $97.64 low. Wave B bounce ended at $98.38 high and wave C ended at $97.45 low.
Up from there, the index rallied higher in another 5 waves impulse structure within wave (3). Whereas wave 1 ended at $98.44 high, wave 2 ended at $97.95, wave 3 ended in another lesser degree 5 waves at $102.37 high. Wave 4 ended at $101.54 and wave 5 ended at $102.99 high. Below from there, the index is doing a short term pullback against March 16, 2020 low ($97.45) in 3 or 7 swings before last push higher in wave (5) within the rally from March 09, 2020, can be seen. Afterward, the index is expected to do a pullback against March 09, 2020, low & should provide an opportunity to buy the index again in 3 or 7 swings. Near-term, as far as the pivot from $97.45 low stays intact expect the index to extend higher. We don’t like selling it.

USDJPY Almost broke the Monthly Structure. Will it Continue?Look at the monthly trend line the current candle hammered the trend line so hard. But only thing we need to confirm is where this remain broken or will reject back into the structure. USD getting stronger in this COVID tensions. Earlier today got something related to "Cash is King" money becomes powerful than all assets at the moment. Which means demand for Dollar increases. USD held as the common currency in many countries on all major transactions, debts, payouts etc. So at the moment money circulation is high ( Demand is High ). Understand the market properly and get the things work well. Thank you!

1W) DXY.. POSSIBLE COLLAPSEnote that this is not my usual forecast which yields 100% success rate. Just a sketch!
!!!No harmonic pattern, no Elliott wave!!!

EURUSD ShortPrice broke 1.1110 level support level,
It will continue to fall in the future.
Investors are advised to remain short,
TP1 1.0950
TP2 1.0870
Follow Me !
Make More Money!
--------------------------- 2019.08.01 uk

EURUSD ShortPrice broke 1.1110 level support level,
It will continue to fall in the future.
Investors are advised to remain short,
TP1 1.0950
TP2 1.0870
Follow Me !
Make More Money!
--------------------------- 2019.08.01

USDCAD - Short Opportunity Identified on RetestHello Traders I wish you for a very good day! Here I update all my trade plans and setups based on technicals while nothing in here shared as a trading signal. So take them at your own risk. All these remains as just a prediction until we meet with the required criteria. Best regards!
This is a very clear structure that price failed since August to break the resistance I have marked up. So with the retest the price has made by now signals me another potential down side which supports for a good profit potential. So trade is active in my portfolio towards shorts
Leave me a message on TradingView for other trade related services. Thank You!

Falling DXY Indicating a Long Buy for the GBP and EUR vs the USDThere is a clear and obvious Head and Shoulders Pattern developing in the DXY or the US Dollar Index, (also referred to as the USDX).
This H&S Pattern was first evident in Nov 2016 when Trump won the US Elections and it is, currently, again making another appearance.
The Lower Arrow indicates 88, which is where the DXY fell to from the first occurrence of the H&S.
The Rising Trendline (marked in Green between the Upper and Lower Bounds) has been broken and I feel that it will fall substantially, after rising a bit from its current value.
All this implies a good run for the GBP and the EUR vs the USD, (in the case of the GBPUSD; a long trade till 1.3700 or even 1.4000 seems a fairly safe trade).
There is also an interesting side-effect of a falling DXY, and that is, a potential weak rise in US Equities based off the back of a weak US Dollar.
2nd Feb 2020

The ultimate gold price predictions: the bull consensus is clearGold and silver prices are moderately down in midday U.S. futures trading Tuesday. Some upbeat remarks on the U.S. economy by Federal Reserve Chairman Jerome Powell helped to sink the safe-haven metals today. And on this day the global marketplace decided to brush off the coronavirus outbreak that continues to spread, which in turn rallied global stock markets, a competing asset class for the precious metals.
Powell laid out a generally upbeat theme for the U.S. economy. He said the U.S. economy is in a good place at present and hinted the Fed will not be lowering interest rates this year. Powell did say the Fed is closely monitoring the coronavirus situation and said it is likely to slightly impact the U.S. economy.
While the coronavirus outbreak continues to spread, it is now spreading at a lower rate of growth of new cases, which has again somewhat assuaged the marketplace Tuesday. There are now over 1,000 reported dead in China and over 42,500 afflicted. On this day the marketplace reckons the spread of the illness is getting under control and that the Chinese government, working with the U.S. and other countries, will keep the outbreak from becoming a pandemic. Traders and investors have been calmed down before on this matter, only to become anxious again. Once again, traders are markets are fickle.
The safe-haven metal is in a bullish longer-term technical posture, amid an accelerating price uptrend seen on the monthly chart. More price gains for gold are likely in 2020 and in the coming years, including new record highs coming at some point down the road. In the Short term, Gold prices could drop however and in order to take advantage of the move We are Shorting the gold at the moment hence hedging our existing silver trade.

What should we do next with USDxHello Trader around the world, how about your last friday, did you trade?
Last friday I've trade the USDCAD and AUDUSD currency
For AUDUSD I Long and lost already
But USDCAD still at the big resistance and I have short already and put a stop loss at 500pip
I really want Monday to come fast as I can
Today I want to sharing all of you
learn about How the currency connect
Sometime maybe someone Long and Short position in the same time with same currency
It was no good
Long EURUSD and also Long USDCAD is wrong
But Long EURUSD and Short USDCAD is great
Cause if we look at USDx or Dollar index
And try to compare with any currency you will see something connect
First you shoud know that USDx will move same with USDXXX currency and XXXUSD will move converse in the same time
Example
Now USDx move up
USDCAD should move upward
EURUSD should move downward
For now about USDx you will see a price have break already
so if the price will continue to move up
Price should comback and rest at the old Resistance or new support
If you see a price move downward to support
Is mean that USDx move downward
Is mean that USDXXX move downward too
Is mean that XXXUSD will move up
Did you get it?
I hope that the things that I have learned around 3 years can help you and you will be a great trader if you can
Trade is a lot of things you have to learn
And we always have to update a strategy
Is didn't mean you know something and you will rich from it
You have learn a lot of things and use it at the right time, timing is so important
Just it, that's all for today
About how there r connect
Sorry for my bad English
Hope this week you will get a lot of money
Goodluck

WE ARE EXECUTING THE TRADE NOWSignificant rebound in the U.S dollar index, U.S stock indices, and the latest ISM reading have pressured the precious metal sector moderately down.No significant major chart damage has been done. Analyzing the current situation within the sector we believe moderate price decline In Gold near the $1500- $1530 Range could be a bargain to enter long. The solid technical resistance For Gold resides at the January high of $1,619 however breakout over the recent high could open a new wave of buying. We are witnessing less safe heaven demand in silver and on “risk-off” days silver prices are breaking lower with significant volume however we have kept a close eye to this metal as it seems an opportunity To execute the trading position has come. we believe from risk to reward perspective Silver appeal among best opportunities at the moment As the silver price at the moment is 171.96% away from its all-time high made in 2011 whereas The yellow metal is only 17.28% away from its an all-time high.
Please Note-All active trading positions could be executed within your portfolio if they have maintained a 1:2 risk and reward ratio. In other words, you shouldn’t be concerned about imitating our exact entry-level instead Initiate the trade if they have maintained a 1:2 risk and reward ratio.

How high will gold go? Don't Mind The CorrectionFundamentals: As we are publishing this report Gold is trading at $1565 per ounce however the white metal is hovering around $17.60.Gold prices are moderately down after reaching three weeks high at $1590.Significant rebound in the U.S dollar index, U.S stock indices, and the latest ISM reading has pressured the precious metal sector down. The Institute for Supply Management (ISM) said on Monday its index of national factory activity increased to a reading of 50.9 last month, the highest level since July, from an upwardly revised 47.8 in December. A reading above 50 indicates expansion in the manufacturing sector, which accounts for 11% of the U.S. economy.silver prices were sharply down and the white metal has been weak since late December. We are witnessing less safe heaven demand in silver and on “risk-off” days silver prices are breaking lower with significant volume however we are keeping a close eye to this metal as it seems an opportunity is also building. we believe from risk to reward perspective Silver appeal among best opportunities at the moment. The coronavirus that has spread from China to other parts of the world remains in focus for the market. The latest counts show 17,500 Chinese citizens afflicted with over 350 dead. The global and domestic business has been significantly impacted there. The coronavirus outbreak has now reached more than 17,000 confirmed cases and killed more than 360 people in China alone. Outside of China, there are 150 confirmed cases and one death in the Philippines. On Monday $393 billion Got wiped from the Chinese stock market. Chinese economy has already been facing the downturn due to the trade war but now due to the coronavirus outbreak more severe downturn could be witnessed. Due to china's strong position in Global supply chains we could witness the severe downturn spread to other countries' stock index if factory closures are extended further and the market sell-off deepens. Due to China being the second-largest economy in the world, a broader economic impact couldn't be ruled out.
Summary: Significant rebound in the U.S dollar index, U.S stock indices, and the latest ISM reading have pressured the precious metal sector moderately down.No significant major chart damage has been done. Analyzing the current situation within the sector we believe moderate price decline In Gold near the $1500- $1530 Range could be a bargain to enter long. The solid technical resistance For Gold resides at the January high of $1,619 however breakout over the recent high could open a new wave of buying. We are witnessing less safe heaven demand in silver and on “risk-off” days silver prices are breaking lower with significant volume however we are keeping a close eye to this metal as it seems an opportunity is also building. we believe from risk to reward perspective Silver appeal among best opportunities at the moment.
Please note-We are not holding any position in our trading portfolio at the moment.


LONG - USDCADUSDCAD breakout and reset. I think this is an opportunity to take a short trade. USDx index is moving higher. But wait for the support and setup on the lower timeframe.
