Usdx

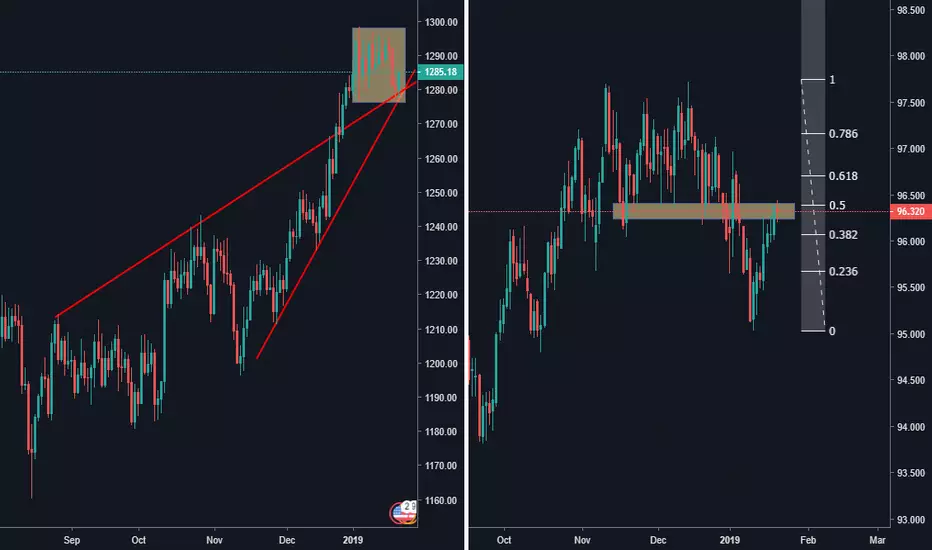
Trading Gold? Don't Neglect the USD Index.Gold has tried to break above the $1,300 handle several times in the last few days. Ultimately, gold bulls have failed to break above that level, and the price retraced to $1,276 early this week. If you're trading gold, always pay close attention to the US dollar index. Notice today's Spinning Top pattern on the USD index, combined with the horizontal resistance. On the Gold chart, notice the trendline support and the newly-formed rectangle consolidation pattern. A falling US dollar causes the price of gold to rise, and vice-versa.
Just like the US dollar, gold tends to appreciate in times of political uncertainty and economic slowdown. Those assets are called safe-havens, and also include the Japanese yen and Swiss franc from the group of major currencies. However, the dynamics behind the demand for the US dollar and gold in times of a risk-off market environment are quite different, which can lead to an actual inverse relationship between those two assets.
While the US dollar usually appreciates as a store of value when the stock and bond market doesn’t generate adequate returns for investors, leading to a conversion of their stock and bond investments back into the US dollar and pushing its demand, gold exhibits a different pattern. The yellow metal serves as a safe place of last instance until investors are ready to take on riskier investments again.
This pattern of collective market psychology can be identified during the economic slowdown from 2008 to 2011. The US dollar Index – which reflects the value of the US dollar against a basket of other major currencies – rose sharply over the course of 2008 while the S&P 500 Index lost almost half of its value during the same period of time. Stock investors were selling their stock portfolio in exchange for US dollars, which in turn pushed the currency higher.
Interestingly, gold lost almost 30% of its value during 2008, only to skyrocket from 2009 to 2011 to an all-time record high of $1,895 in September 2011. Worries over the US debt and the European Greek-crisis saw hordes of investors selling the US dollar and euro and fleeing to the safe-haven of gold. Consequently, the US dollar Index reached a three-year record-low in 2011.
With the majority of gold still traded in US dollars, it’s no wonder that the exchange rates between US dollars and other currencies have a great impact on the price of gold, creating an inverse relationship between them.
Most of the time, all commodities that are denominated in US dollars (including oil, silver, copper etc.) move in the opposite direction than the US currency. The reason behind this is rather simple. Beside the market dynamics of an economic slowdown mentioned above, a stronger US dollar leads to weaker currencies in the rest of the world, decreasing the demand for gold and its price in dollar terms. Similarly, a weakening dollar leads to relatively stronger foreign currencies, which pushes the demand for gold and increases its price in dollar terms. A stronger US dollar lowers the price of gold on foreign markets, and vice-versa.
Another reason for the inverse correlation between the US dollar and gold is closely related to gold’s role as a safe-haven of last instance. Basically, in times of a weakening dollar, investors are leaving dollar-denominated securities and the dollar itself, and start buying gold as an alternative investment to store value and preserve the purchasing power of their investments. As the supply of gold is naturally limited, the increased demand can lead to large price fluctuations to the upside.
THE ULTIMATE SHORT BUT WHERE IS THE DECLINE?At the moment of publishing this report gold is trading at around $1230 while white metal is trading at $14.38, from weeks we were informing you that U.S-China trade-war would impact the precious metal prices either in a positive or negative way and as the agreement reached between the two countries to a temporary halt,hence we have witnessed a correction in the precious metal sector,we also informed you that it's a possibility that any ease off in the trade-war would shoot up the gold and silver prices in a significant manner but what happened? Gold and silver made short-term price correction even after the news which was bullish for the P.Ms including U.S-China temporary suspension of fighting which came out today and last week’s surprisingly dovish comments coming from Federal Reserve Chairman Jay Powell. Prices unable to surge in a dramatic manner even after this bullish news are a very bearish development for the precious metal sector, however at the same time Large speculators increased their net bearish positioning in gold during the most recent reporting week for data compiled by the Commodity Trading Commission.
we also witnessed modest gains in crude oil prices on hopes for better world economic growth if the U.S and China stop there trade war, however, most experts are not expecting trade war to be resolved over a long-term however in short-term this temporary halt also drove the Asian and europian stock market higher. The statement from the Russian and Saudi Arabian officials that they want to extend production cuts was also a factor which drove the oil prices higher today.
Technicals-Our two position are in gold and silver and silver position is already running in profit, however, we believe buyers should be very cautious at this point as we believe 1200 level will be easily broken and there is not much support until 1180. Gold -0.73% -0.07% -0.37% 0.17% 0.69% likely will not be able to support around its psychological level if the U.S Dollar keeps rising and there are numerous factors which are suggesting the future dollar strength-
overall it seems that position in gold -0.73% -0.07% -0.37% 0.17% 0.69% and silver -0.14% -0.14% -0.35% 0.49% 0.57% will be highly profitable in coming weeks-we are very bearish for the precious metal sector and we think the downfall has just been started.
existing positions
Currency Pair: XAUUSD -0.61% ( Gold -0.74% )
Sell Stop Entry Price:1220
Take Profit: 1180
Stop Loss:1240
Capital Risk:2000USD(amount may vary depending on your account size and risk tolerance)
Potential Reward: 4000USD
Risk/Reward: 1:2
(we can adjust (limit, close or even reverse) the position before this price level is reached)
Should you require any more information don't hesitate to contact us.
Many regards,
Short term Trades
Currency Pair: XAG -0.83% .USD( silver -0.21% )
Sell Entry Price: 14.500
Take Profit: 14.000
Stop Loss: 15.00
Capital Risk: 2000USD-(amount may vary depending on your account size and risk tolerance)
Potential Reward: 2000USD
Risk/Reward: 1:1
(we can adjust (limit, close or even reverse) the position before this price level is reached)

Is Gold Forming a Bottom, or a Bear Flag?At the time of publishing this report gold is trading at around $1220(our entry price) whereas white metal is Trading lower at $14.16 which implies that our position in silver is already running in profits and we believe it' going to hit the target very soon along with the sharp downside fall in yellow metal prices.
we witnessed a sharp downside fall in silver and moderate fall in gold prices as The U.S. dollar hit a new daily high while crude oil prices broke below further and reached a fresh daily low. Oil prices dropped below $50 a barrel Today. we already informed you that falling prices in oil is deflationary and most analysts try to predict the upcoming cycle of inflation or deflation based upon the current oil prices Trend, however, weak oil prices mean inflation expectations will remain low-.U.S. President Trump and Chinese President Xi are scheduled to meet face-to-face in Argentina This Saturday-
The important thing to understand here is that the U.S CHINA Trade war is very bearish for the gold and silver and as Trump has already made negative comments on this matter on Monday market is not expecting any improvement in the situation-the U.S CHINA Trade war is also a factor which is contributing to The U.S dollar bullish movement, However, any easing in the ongoing trade war will shoot up the prices of gold and silver-
we need to see the fed cutting or pausing the interest rates hike which will ultimately drive the precious metals prices higher but as we already know fed rate hike seems not to stop very soon-Markets are expecting fed to raise rates in December and two another rates hikes next year, however, this expectation has been cut in half as previously market expectation was four rate hikes in the next year,Negative sentiment can also be seen in futures markets as bearish speculative positioning continues to dominate the precious metals
Technicals-Our two position are in gold and silver and silver position is already running in profit, however, we believe buyers should be very cautious at this point as we believe 1200 level will be easily broken and there is not much support until 1180. Gold -0.73% -0.07% -0.37% 0.17% 0.69% likely will not be able to support around its psychological level if the U.S Dollar keeps rising and there are numerous factors which are suggesting the future dollar strenth-The declined started in Asia-pacific trade after it went below the 100 days moving average at last week
overall it seems that position in gold -0.73% -0.07% -0.37% 0.17% 0.69% and silver -0.14% -0.14% -0.35% 0.49% 0.57% will be highly profitable in coming weeks-we are very bearish for the precious metal sector and we think the downfall has just been started.
existing positions
Currency Pair: XAUUSD -0.61% ( Gold -0.74% )
Sell Stop Entry Price:1220
Take Profit: 1180
Stop Loss:1240
Capital Risk:2000USD(amount may vary depending on your account size and risk tolerance)
Potential Reward: 4000USD
Risk/Reward: 1:2
(we can adjust (limit, close or even reverse) the position before this price level is reached)
Should you require any more information don't hesitate to contact us.
Many regards,
Short term Trades
Currency Pair: XAG -0.83% .USD( silver -0.21% )
Sell Entry Price: 14.500
Take Profit: 14.000
Stop Loss: 15.00
Capital Risk: 2000USD-(amount may vary depending on your account size and risk tolerance)
Potential Reward: 2000USD
Risk/Reward: 1:1
(we can adjust (limit, close or even reverse) the position before this price level is reached)


YOU IGNORED US NOW FACE THE CONSEQUENCES we witnessed the equity market correction in previous months where analysts were fearful of coming next financial crisis as we saw in 2008 or even bigger than that but our study suggests that despite the equity market correction investors and long-term traders aren't interested in the precious metal sector because they aren't afraid of a bear equity market. The non- fear factor can be seen in the financial market stress index published by the St Louis Federal Reserve and the CBOE Volatility Index ($VIX), also known as the fear gauge-as of now we are seeing the USD Dollar index has jumped to its highest level since June 2017 which is making immense pressure on both gold and silver and our short-term analysis suggest that once yellow metal will broke below $1190 level(our take profit) more selling pressure will start from this point-we as a gold and silver analyst are focusing more on the U.S. dollar, positioning analysis and global macro data these are the factors that could affect gold and silver prices in the long term-some other important factors which are making pressure on P.Ms are WTI crude oil significant decline along with weak CNY and rising yields-
Please note-Russia and Saudi are about to cut their oil export and we believe at this moment of time investors should monitor any outcoming global macro data very carefully
Our previous comment
1-we believe after the US mid-term election when the dust will be settled, the recent news events and relatively strong earning data will push the US stock market and economy to upside in a significant manner
2-If US-CHINA Trade war will be eased through the losing the policy by trump in the near future, we expect the equity market to surge 5-10% over a few weeks or even in few days on that news alone, hence a significant downfall in the precious metals sector.
3-we strongly believe experienced money managers and strategic professional trader should tight their seat belts and should start taking trades in gold 0.18% -0.31% and silver -0.21% 0.00% as we are expecting a sharp move as the price could move in a very aggressive manner soon-However we are very bearish for the mid and long-term in the precious metals sector.

LET'S MAKE IT VERY SIMPLESometimes it feels like this consolidation period in gold and silver is not going to over for months but trust me we have seen this kind of range bound movement in precious metal sector numerous times and then we witness an explosive breakout or breakdown in both of the precious metals? but there is no denying that we are in the middle of the boring times but we are expecting it to end very soon but the question is will this time we'll see an explosive breakout or breakdown in PMs?
However, Every analyst have their own idea about the same market while most of the analyst are either neutral or significantly bullish for the current market condition in precious metals sector but for us market is saying only one thing- Don’t get tricked by a false move
we witnessed gold to drop below $1214 level on Oct 31 which we believe was caused by the fund selling to take some profits for client statement purposes to recover some losses in the stock market-
Gold price tested 1227.00 level without managing to break it, waiting to surpass this level to reinforce the expectations of continuing the decline towards our main waited target at 1208.40, to keep our bearish trend scenario valid for today
USDX has also formed inverse head and shoulder pattern about which we informed you already-The breakout is already confirmed by numbers of daily closing candles and there are numerous sign pinpointing to the upcoming US dollar rally which is negatively correlated to the PMs sector but what's interesting is even the good economic numbers on Friday which helped to strengthen the dollar, didn't push gold and silver prices above,The market is likely to quiet ahead of the U.S midterm election and people are waiting to see how it's going to play out after tomorrow however opinion polls show strong chances that the democratic may win this midterm election by which we can expect a pressure in dollar and a slight move higher PM sector However we believe once this matter of election between Democrats and Republican will over this inverse correlation be back to normal which will help drive gold and silver prices to fall in a significant manner-
patience will reward us
please note- Hedge funds and money managers raised their net short position in gold to a three-week high in the week ended Oct. 30, according to U.S. Commodity Futures Trading Commission data.

Short Dolar IndexIn my opinion we can now expect price to move down.
Ofcourse dolar is now under big fundaments (Trump, China, Stock) - these are thing we can not predict and it can goes against our positions. Don't forget to have stoploss.

YOU DON'T KNOW WHAT YOU ARE MISSINGHaving a good idea, beforehand, where the buy and sell stops are located can give an active trader a better idea regarding at what price level buying or selling pressure will become intensified in that market.
Buy Stops -15.050(buying pressure)
Sell Stops- 14.450(selling pressure)
Our Active position
ASSET--Silver
Sell Limit Price: 14.700
Take Profit: 14.000
Stop Loss: 15.300

USDX approaching resistance, potential drop! USDX is approaching our first resistance at 96.14 (horizontal swing high resistance, 61.8% Fibonacci extension, 76.4% Fibonacci retracement) where a strong drop might occur below this level pushing price down to our first support at 95.06 (horizontal swing low support, 50% Fibonacci retracement, 100% Fibonacci extension). Stochastic (55,5,3) is also approaching resistance and we might see a corresponding drop in price should it react off this level.

US Dollar Index could terminate at 95.50/96.00 levels.The US Dollar Index was seen accelerating into its final corrective leg, within the expanded flat and has made an interim high close to 95.40 levels on Friday. Looking into the wave structure, the index could find resistance around 95.50 or it could push through 96.00 levels before resuming lower again. The expanded flat structure could be a traders nightmare if not identified at the right time. We have now changed our trading strategy from neutral to short, until prices remain below 97.00 levels going further. Please note that the medium term wave structure remains unchanged and the US Dollar Index could drop towards 91.50 levels, going forward.
Disclaimer:
This written/visual material is comprised of personal opinions and ideas. The content should not be construed as containing any type of investment advice and/or a solicitation for any transactions. It does not imply an obligation to purchase investment services, nor does it guarantee or predict future performance. FXTM, its affiliates, agents, directors, officers or employees do not guarantee the accuracy, validity, timeliness or completeness of any information or data made available and assume no liability for any loss arising from any investment based on the same.


US Dollar Index clears line of resistanceThe US Dollar Index has broken above its line of immediate resistance depicted on hourly chart here. The index is seen to be trading around 94.50 levels at this point in writing and could be targeting 94.80/95.00 resistance zone immediately. Structurally, the US Dollar Index could be well under its way to carve an expanded flat a-b-c (not highlighted here), eventually forming Wave B of a larger degree. If the above count holds well, we could see Wave B termination point towards 95.70 or 96.00 levels going forward. Please note that the medium term structure still remains bearish , but a short term rally could complete Wave B. We remain neutral for now.
Disclaimer:
This written/visual material is comprised of personal opinions and ideas. The content should not be construed as containing any type of investment advice and/or a solicitation for any transactions. It does not imply an obligation to purchase investment services, nor does it guarantee or predict future performance. FXTM, its affiliates, agents, directors, officers or employees do not guarantee the accuracy, validity, timeliness or completeness of any information or data made available and assume no liability for any loss arising from any investment based on the same.

USDX approaching resistance, potential drop!USDX is approaching our first resistance at 94.37 (horizontal overlap resistance, 50% Fibonacci retracement, 100% Fibonacci extension) and a strong drop might occur below this level pushing price down to our major support at 94.00 (horizontal swing low support, 76.4% Fibonacci retracement).
Stochastic (55,5,3) is approaching resistance and we might see a corresponding drop in price should it react off this level.
Trading CFDs on margin carries high risk.
Losses can exceed the initial investment so please ensure you fully understand the risks.

US Dollar Index could produce a surprise rally towards 95.70 ?The US Dollar Index has tested lows at 93.80 twice now without much success and is back higher, trading around 94.30/40 levels at this point in writing. Please note that a short term resistance line is passing just through the price and a break here could push the index higher towards initial resistance at 94.80 levels. Looking at the wave structure, medium term bearish outlook still remain intact, but the US Dollar Index could produce a rally towards 95.50/96.00 levels before reversing lower again. We have changed our stand from bearish to neutral for now and would be looking for intraday rallies through 95.50 levels at least, to initiate probable shorts.
Disclaimer:
This written/visual material is comprised of personal opinions and ideas. The content should not be construed as containing any type of investment advice and/or a solicitation for any transactions. It does not imply an obligation to purchase investment services, nor does it guarantee or predict future performance. FXTM, its affiliates, agents, directors, officers or employees do not guarantee the accuracy, validity, timeliness or completeness of any information or data made available and assume no liability for any loss arising from any investment based on the same.

US Dollar Index at potential support around 93.70/94.00 ?The US Dollar Index broke lower from its consolidation, dropping to fresh lows at 93.83 levels. Please be aware of a potential bear trap around 93.70 and 94.00 levels since the entire region is fibonacci 0.382 support of the previous rally between 88.00 through 97.00 levels respectively. Looking at the wave structure, it could still remain probable for the index to carve out an expanded flat as wave B. If the count holds, we would not be surprised to witness a rally towards 95.50/96.00 levels going forward. At the moment, we are changing our stand from bearish to neutral.
Disclaimer:
This written/visual material is comprised of personal opinions and ideas. The content should not be construed as containing any type of investment advice and/or a solicitation for any transactions. It does not imply an obligation to purchase investment services, nor does it guarantee or predict future performance. FXTM, its affiliates, agents, directors, officers or employees do not guarantee the accuracy, validity, timeliness or completeness of any information or data made available and assume no liability for any loss arising from any investment based on the same.

US Dollar Index Wave B as Expanded Flat ?The US Dollar Index is also consolidating within the rectangle region highlighted on chart here. Looking at the wave structure, Wave B could be still unfolding as an expanded flat a-b-c, before Wave C decline could resume. If this count holds true, we could witness a sharp rally towards 95.70 or probably 96.00 levels as Wave B termination point. Also note that a break above 95.00 levels would instill further confidence for the above count. As an alternate though, a break below 94.00/20 consistently, would be further bearish for the US Dollar Index. Overall bearish structure remains intact towards potential 91.50 and 92.00 levels going forward.
Disclaimer:
This written/visual material is comprised of personal opinions and ideas. The content should not be construed as containing any type of investment advice and/or a solicitation for any transactions. It does not imply an obligation to purchase investment services, nor does it guarantee or predict future performance. FXTM, its affiliates, agents, directors, officers or employees do not guarantee the accuracy, validity, timeliness or completeness of any information or data made available and assume no liability for any loss arising from any investment based on the same.

US Dollar Index could test 95.70 levels again ?The US Dollar Index short term picture could still remain encouraging to bulls if prices stay above 94.40 levels. The index is probably carving an expanded flat corrective wave structure as potential Wave B. If this structure holds well, we could see prices rally back towards 95.70 levels at least or even push through 96.00 mark. The rally on Friday from 94.38 lows through 95.00 could retrace lower before resuming again. Overall the medium term wave structure (several weeks), could remain bearish towards 92.00 and 91.50 levels respectively.
Disclaimer:
This written/visual material is comprised of personal opinions and ideas. The content should not be construed as containing any type of investment advice and/or a solicitation for any transactions. It does not imply an obligation to purchase investment services, nor does it guarantee or predict future performance. FXTM, its affiliates, agents, directors, officers or employees do not guarantee the accuracy, validity, timeliness or completeness of any information or data made available and assume no liability for any loss arising from any investment based on the same.

USDX approaching resistance, potential drop! USDX is approaching our first resistance at 94.91 (horizontal overlap resistance, 23.6% Fibonacci retracement) and a strong drop might occur below this level pushing price down to our major support at 94.40 (horizontal swing low support, 78.6% Fibonacci retracement). Ichimoku cloud is also showing signs of bearish pressure in line with our bearish bias.
Trading CFDs on margin carries high risk.
Losses can exceed the initial investment so please ensure you fully understand the risks.

US Dollar Index potential top could be at 96.00 ?The US Dollar Index hourly chart is suggesting that the index might still be unfolding Wave B (potential remains to either test 95.70 levels or print higher towards 96.00), before resuming its journey lower again. The corrective wave seems to be taking mire time to carve a potential top for Wave B termination and it might be unfolding into a zigzag . Overall, the structure is looking bearish and it is just a matter of time when wave C could resume lower; from 95.70 or 96.00 levels again. Please note that 94.80 remains the line in sand for bulls to stay in control for now.
Disclaimer:
This written/visual material is comprised of personal opinions and ideas. The content should not be construed as containing any type of investment advice and/or a solicitation for any transactions. It does not imply an obligation to purchase investment services, nor does it guarantee or predict future performance. FXTM, its affiliates, agents, directors, officers or employees do not guarantee the accuracy, validity, timeliness or completeness of any information or data made available and assume no liability for any loss arising from any investment based on the same.

US Dollar Index remains vulnerable around 95.70/96.00 levelsThe US Dollar Index 0.02% hourly story is suggesting that the recent rally on Friday may push it higher towards 96.00 levels before finding strong resistance again. There is no certainty of the above though, but a possibility cannot be ruled out. Please note that fibonacci 0.618 resistance is also seen at 96.00 levels and we can expect a bearish reaction if prices manage to reach there. Overall, the US Dollar Index 0.02% remains a chart to be probably sold upon intraday rallies through 95.0/96.00 levels. Yet another round of sell off could be on its way towards 92.00 levels.
Disclaimer:
This written/visual material is comprised of personal opinions and ideas. The content should not be construed as containing any type of investment advice and/or a solicitation for any transactions. It does not imply an obligation to purchase investment services, nor does it guarantee or predict future performance. FXTM, its affiliates, agents, directors, officers or employees do not guarantee the accuracy, validity, timeliness or completeness of any information or data made available and assume no liability for any loss arising from any investment based on the same.

Dow Still Need To Break 25600 Levels To Confirm A Potential TopWe are bringing the daily chart view after a long time for Dow Jones. Still, the indice is holding its potential A-B-C flat wave structure discussed earlier and prices have also managed to reverse from near about 26200 levels as seen here. A potential evening star candlestick bearish pattern seems to have appeared, indicating a potential reversal, though prices still need to break below 25600 levels (immediate support on the daily chart view), before we could confirm the above scenario. We shall be watching the wave structure for the next couple trading sessions and how the price action confirms.
Disclaimer:
This written/visual material is comprised of personal opinions and ideas. The content should not be construed as containing any type of investment advice and/or a solicitation for any transactions. It does not imply an obligation to purchase investment services, nor does it guarantee or predict future performance. FXTM, its affiliates, agents, directors, officers or employees do not guarantee the accuracy, validity, timeliness or completeness of any information or data made available and assume no liability for any loss arising from any investment based on the same.

EURUSD bounces sharply past 1.1650 levels. Wave C begins?The EURUSD hourly chart suggests, that a meaningful low could be in place at 1.1530 levels and that a probable direction from here could be on the north side. Please note that the confluence of a previous wave 4 and a nearly 50% retracement at 1.1530 remains a valid point to assume that Wave B could be in place. If the above wave count and structure holds, we could witness higher highs from here. As an alternate count, please be prepared for a potential drop towards 1.1450/70 levels before Wave C picks up. We shall bring up this scenario again if price patterns support. Overall EURUSD remains a candidate to remain long.
Disclaimer:
This written/visual material is comprised of personal opinions and ideas. The content should not be construed as containing any type of investment advice and/or a solicitation for any transactions. It does not imply an obligation to purchase investment services, nor does it guarantee or predict future performance. FXTM, its affiliates, agents, directors, officers or employees do not guarantee the accuracy, validity, timeliness or completeness of any information or data made available and assume no liability for any loss arising from any investment based on the same.
