The dance between the USDZAR and (ZA10Y - US10Y)The chart shows the relationship between the USDZAR and the yield differential between the SA 10-year and the US 10-year (ZA10Y – US10Y).
2025 has been a wild ride for the rand and it has managed to put up a remarkable recovery in the 2Q2025 but where to now for the pair? The pair has not traded below the 200-week MA currently at 17.62, since the March 2022 just before the global rate hiking cycle. The only previous times the pair traded below this moving average was briefly in 2021 before the June/July riots in SA and during the “Ramaphoria” period in 2018.
The 200-week MA also coincides with the 38.2% Fibo retracement from the low in 2021. A brief break below these two support levels will allow the pair to fall onto the 50% Fibo retracement level at 16.62. The yield differential is however suggesting that the rand may not have much room to pull the pair too far below the 200-week MA. The brief break below the 5.00% during December 2024 and January 2025 was a bit of an anomaly given the volatility in the US bond market and I still believe 5.00% is a hard support for the yield differential. A bottom out of the yield differential could see it rise higher towards 7.50% which will be rand negative should the positive correlation hold.
To summarise, the yield differential is suggesting that the rand’s 2Q2025 recovery may be on its last legs but a break below the 200-week MA will allow the rand to pull the pair towards 16.50. I don't see the rand maintaining levels below 16.50 and this level seems like a long-term floor for the pair before another 5-wave impulse to the topside.
Historical trend analysis:
The SA rand is one of the most attractive emerging market currencies due to the carry trade appeal of the currency coupled with SA’s deep and liquid bond market. During periods when there is significant buying pressure on SA bonds, the SA yields will decrease meaning that the yield differential (ZA10Y-US10Y) decreases while in periods when SA bonds are selling off, yields on SA bonds will increase which increases the yield differential, citrus paribus. The USDZAR pair is thus positively correlated with this yield differential.
The chart goes back to 2018 when the USDZAR hit a low of 11.50 following the period dubbed the “Ramaphoria” period. Investor sentiment swinged aggressively positive in this period and the flow of international funds into the SA bond market saw the yield differential drop to a low around 5.00%. The yeld differential has never dropped below this level until early 2025 as indicated on the chart.
The yield differential and the USDZAR pair moved in tandem all the way through to the 1Q2022, maintaining its strong positive correlation. The next period marked the start of the global hiking cycle which saw the US 10-year yield rise from a low of 1.65% in March 2022 to a high of 5.00% in October 2023. This aggressive rise in US 10-year yields marked a period of extensive risk off sentiment and even caused a US banking crises in March 2023. The Fed stepped in and briefly paused their QT to add liquidity to system and provided the US banking system with the bank term funding program to patch up the cracks. The rand sold off due to risk off investor sentiment while the US 10-year yield rose due to the start of the rate hiking cycle which reduced the yield differential. The USDZAR climbed to a high of 19.90 in May 2023 while the yield differential dropped to a low of 7.50%. The yield differential continued to fall until the US 10-year yield topped out at 5.00% in October 2023, after which the positive correlation between the USDZAR and the yield differential was restored.
The next period marked positive sentiment towards SA following the election results and the formation on the government on national unity (GNU). Coupled with the end to the rate hiking cycle, the rand had the wind and risk on investor sentiment in its sails which allowed the rand to pull the pair to a low of 17.03. The optimism of the GNU and the realisation on another Trump presidency however saw the pair bottom out in September 2024. During the last quarter of 2024 the rand experienced sustained selling pressure while the yield differential continued to fall. The break in correlation was largely due to the US10-year yield climbing from 3.60% in September 2024 to a high of 4.80% in January 2025.
USDZAR

USDZAR Bullish ideaAs we can see this is our USDZAR quarterly shift idea were we are anticipating price to rally to the upside toward our draw on liquidity objectives. We had a weekly volume imbalance and monthly mean threshold order block show us support after we took out major liquidity points. We also showed more support on our daily FVG and a market shift taking place after a displacement. We are anticipating a rally for USDZAR and will be looking to see how price plays out.
USDZAR is an exotic pair that is part of the emerging markets and emerging markets/exotic pairs can usually lead ahead of major forex pair or lag between major forex pairs so this can also help us with our intermarket analysis of forex pairs when determining our dollar strength against other basket currencies.

Rand Pressured but Potential Recovery on the HorizonThe U.S. Dollar Index (DXY) strengthened to 97.80 following President Trump’s announcement of sweeping new trade tariffs, including a 35% levy on Canadian imports set to begin August 1, and additional blanket duties on several other nations. This added to bullish dollar sentiment already supported by yesterday’s labour market data showing a seven-week low in U.S. unemployment claims.
With no immediate pressure on the Federal Reserve to cut interest rates, the greenback remains the currency of choice for risk-off flows. This renewed strength is placing emerging market currencies under strain, particularly the South African rand.
USD/ZAR climbed sharply, touching the 17.80 handle as investors reacted to the potential for South Africa to be included in the next wave of U.S. tariffs, possibly as high as 40%. However, local fundamentals suggest a possible reversal.
Recent South African manufacturing data beat expectations, and diplomatic engagements between President Cyril Ramaphosa and U.S. officials are providing a counterweight to the tariff headlines.
Technical View (USD/ZAR):
The currency pair is currently range-bound in a sideways channel. A breakout above resistance at 18.05 would likely extend dollar gains, while a move below 17.60 could open the door to a short-term rand recovery. Traders should be cautious and watch for clear directional confirmation.

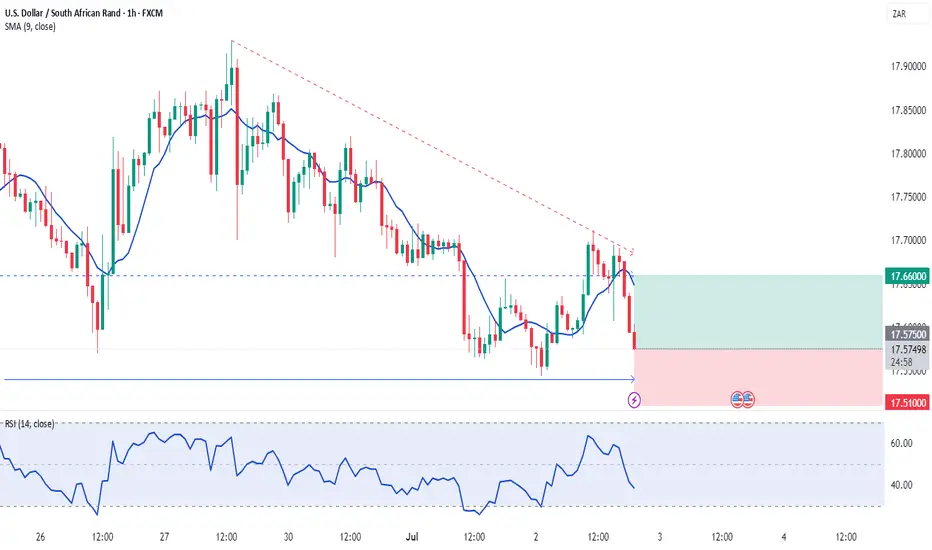
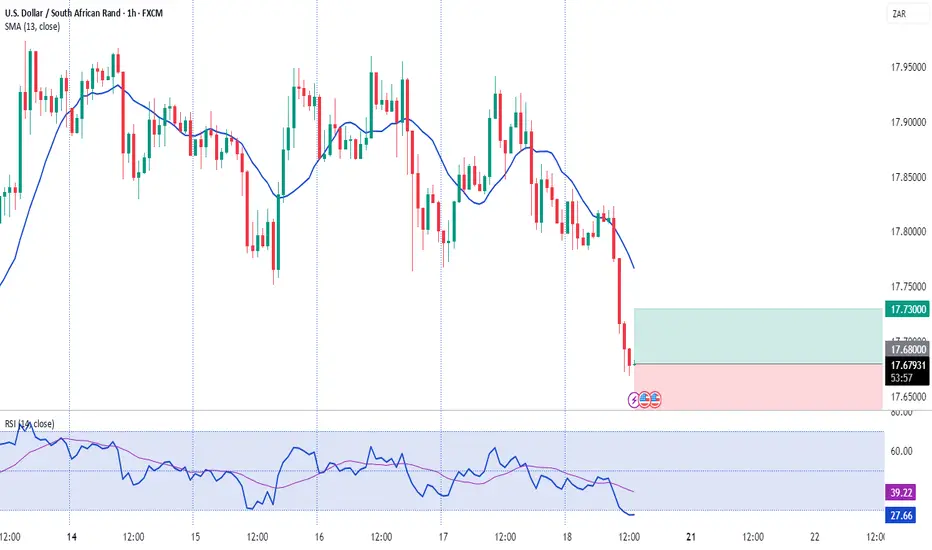
USDZAR | 24.06.2025BUY 17.7400 | STOP 17.64000 | TAKE 17.8700 | Corrective upward price movement from stong support level.

USDZAR Bull ideaWe have a dollar that is potentially looking to have a long term bull run and USDZAR is an exotic pair that is part on the immerging markets and it can sometimes lead the move before the Major pairs.

USDZAR | 27.05.2025BUY 17.8600 | STOP 17.7500 | TAKE 18.0000 | On the daily chart the price approached the medium-term support level. We expect the price to rebound to the important level of 18 0000 on the background of developed divergence.

USDZAR | 19.05.2025BUY 18.0000 | STOP 17.7800 | TAKE 18.2800 | Price movement is in the descending medium-term channel. We expect an upward correction in the local range from the important level of 18.0000.

LONG USDZARThere seems to be huge demand for USD especially on the USDZAR pair.
The pair has printed the lowest prices it will reach during the month of May 2025, and probably June 2025 as well.
As such, we will be trading upwards from hereon.

USDZAR | 09.05.2025BUY 18.1600 | STOP 17.9500 | TAKE 18.5100 | The price has been declining smoothly and evenly for the previous 2 weeks towards the medium-term strong support range. At these levels we consider buying of this pair and corrective price reversal towards the nearest values of local resistance 18.5100 - 18.6800.

USDZAR | 02.05.2025BUY 18.4400 | STOP 18.3300 | TAKE 18.5900 | Technically, the picture of the price movement disposes to a slight growth to the levels of previous resistances inside the medium-term descending channel. We also expect today data on the US labour market and the possible impact of indicators on the dollar. A slight growth is likely.

USDZAR 15MIN BUY(1) A bullish rising wedge pattern expected to give a BUY at : 18.69855 (2) StopLoss : 18.57438 (5) TakeProfit : 18.80105

Bullish bounce?USD/ZAR is falling towards the pivot and could bounce to the 1st resistance.
Pivot: 18.42633
1st Support: 18.12402
1st Resistance: 18.77859
Risk Warning:
Trading Forex and CFDs carries a high level of risk to your capital and you should only trade with money you can afford to lose. Trading Forex and CFDs may not be suitable for all investors, so please ensure that you fully understand the risks involved and seek independent advice if necessary.
Disclaimer:
The above opinions given constitute general market commentary, and do not constitute the opinion or advice of IC Markets or any form of personal or investment advice.
Any opinions, news, research, analyses, prices, other information, or links to third-party sites contained on this website are provided on an "as-is" basis, are intended only to be informative, is not an advice nor a recommendation, nor research, or a record of our trading prices, or an offer of, or solicitation for a transaction in any financial instrument and thus should not be treated as such. The information provided does not involve any specific investment objectives, financial situation and needs of any specific person who may receive it. Please be aware, that past performance is not a reliable indicator of future performance and/or results. Past Performance or Forward-looking scenarios based upon the reasonable beliefs of the third-party provider are not a guarantee of future performance. Actual results may differ materially from those anticipated in forward-looking or past performance statements. IC Markets makes no representation or warranty and assumes no liability as to the accuracy or completeness of the information provided, nor any loss arising from any investment based on a recommendation, forecast or any information supplied by any third-party.

Bullish bounce?USD/ZAR is reacting off the pivot and could bounce to the 1st resistance.
Pivot: 18.71637
1st Support: 18.44436
1st Resistance: 19.07855
Risk Warning:
Trading Forex and CFDs carries a high level of risk to your capital and you should only trade with money you can afford to lose. Trading Forex and CFDs may not be suitable for all investors, so please ensure that you fully understand the risks involved and seek independent advice if necessary.
Disclaimer:
The above opinions given constitute general market commentary, and do not constitute the opinion or advice of IC Markets or any form of personal or investment advice.
Any opinions, news, research, analyses, prices, other information, or links to third-party sites contained on this website are provided on an "as-is" basis, are intended only to be informative, is not an advice nor a recommendation, nor research, or a record of our trading prices, or an offer of, or solicitation for a transaction in any financial instrument and thus should not be treated as such. The information provided does not involve any specific investment objectives, financial situation and needs of any specific person who may receive it. Please be aware, that past performance is not a reliable indicator of future performance and/or results. Past Performance or Forward-looking scenarios based upon the reasonable beliefs of the third-party provider are not a guarantee of future performance. Actual results may differ materially from those anticipated in forward-looking or past performance statements. IC Markets makes no representation or warranty and assumes no liability as to the accuracy or completeness of the information provided, nor any loss arising from any investment based on a recommendation, forecast or any information supplied by any third-party.

USDZAR | 15.04.2025BUY 18.8200 | STOP 18.6400 | TAKE 19.0600 | The price has approached an important support level and is consolidating. today we expect a slight rise to the level of 19.0600.

Bullish bounce?USD/ZAR is falling towards the pivot and could bounce to the 1st resistance.
Pivot: 18.71637
1st Support: 18.44436
1st Resistance: 19.26038
Risk Warning:
Trading Forex and CFDs carries a high level of risk to your capital and you should only trade with money you can afford to lose. Trading Forex and CFDs may not be suitable for all investors, so please ensure that you fully understand the risks involved and seek independent advice if necessary.
Disclaimer:
The above opinions given constitute general market commentary, and do not constitute the opinion or advice of IC Markets or any form of personal or investment advice.
Any opinions, news, research, analyses, prices, other information, or links to third-party sites contained on this website are provided on an "as-is" basis, are intended only to be informative, is not an advice nor a recommendation, nor research, or a record of our trading prices, or an offer of, or solicitation for a transaction in any financial instrument and thus should not be treated as such. The information provided does not involve any specific investment objectives, financial situation and needs of any specific person who may receive it. Please be aware, that past performance is not a reliable indicator of future performance and/or results. Past Performance or Forward-looking scenarios based upon the reasonable beliefs of the third-party provider are not a guarantee of future performance. Actual results may differ materially from those anticipated in forward-looking or past performance statements. IC Markets makes no representation or warranty and assumes no liability as to the accuracy or completeness of the information provided, nor any loss arising from any investment based on a recommendation, forecast or any information supplied by any third-party.

UPDATE I was wrong with USD/ZAR - Now it's undecidedWith trading it's not about certainties but probabilities.
And in this case I was soo optimistic about the rand breaking its Inverse Cup and Handle and heading to R16.50.
But instead the USD/ZAR rallied to R19.74.
Apart from the negativity kicking in with the US, there is one thing I didn't really consider. And that is the US Dollar is going to hurt - no doubt.
But the rand and emerging economies will more likely hurt even worse. Because despite it all we still follow the big boys (DOw, SP500, UK100)
Hence when the US sneezes, the world catches a cold.
But then we have other reasons for the rand weakening
1. 🗳️ Political Uncertainty in SA
Coalition tensions and governance concerns are making investors nervous, pushing money out of SA.
2. 📉 Lower SARB Interest Rates
South Africa cut rates again, making the rand less attractive to yield-seeking investors.
3. 🌍 Global Risk-Off Mode
Traders are fleeing emerging markets amid global tensions—hurting the rand, boosting the dollar.
4. 💼 Weak SA Economic Outlook
Low growth, high unemployment, and power issues reduce confidence in South Africa’s economy.
5. 🇺🇸 Stronger Dollar Demand
U.S. dollar gaining strength globally due to safe-haven demand and higher relative rates
So, yes - We are seeing some rand strength now and we are back to R18.88.
We will need to wait for the next formation before we make any deductions on where it is likely to go.
It could break up with the Falling Flag and run up to R20.00.
Or it could stabilise and form an Inverse Cup and Handle again and drop to R17.50.
We need to wait and see. I can't always post my winners - or else I wouldn't be an actual trader.
Disclosure: I am part of Trade Nation's Influencer program and receive a monthly fee for using their TradingView charts in my analysis.

ALL THE TARGET REACHED ON USDZARCheck Out All My Previous Post About USDZAR.
God is good all the time,My analysis was successfully.
Let chill and enjoy the profits,Non Farm Payroll is coming up on Friday.
Let be ready to prepare it.

FIRST PROFIT BOOKED,USDZAR FINALLY BROKE 18:45I am now looking forward to hit 1863 as my main Target for these week.

USDZAR | 28.03.2025BUY 18.1500 | STOP 18.0000 | TAKE 18.3300 | Movement in the main ascending channel.

Bullish bounce?USD/ZAR is reacting of the pivot and could bounce to the 1st resistance.
Pivot: 18.06195
1st Support: 17.90904
1st Resistance: 18.21062
Risk Warning:
Trading Forex and CFDs carries a high level of risk to your capital and you should only trade with money you can afford to lose. Trading Forex and CFDs may not be suitable for all investors, so please ensure that you fully understand the risks involved and seek independent advice if necessary.
Disclaimer:
The above opinions given constitute general market commentary, and do not constitute the opinion or advice of IC Markets or any form of personal or investment advice.
Any opinions, news, research, analyses, prices, other information, or links to third-party sites contained on this website are provided on an "as-is" basis, are intended only to be informative, is not an advice nor a recommendation, nor research, or a record of our trading prices, or an offer of, or solicitation for a transaction in any financial instrument and thus should not be treated as such. The information provided does not involve any specific investment objectives, financial situation and needs of any specific person who may receive it. Please be aware, that past performance is not a reliable indicator of future performance and/or results. Past Performance or Forward-looking scenarios based upon the reasonable beliefs of the third-party provider are not a guarantee of future performance. Actual results may differ materially from those anticipated in forward-looking or past performance statements. IC Markets makes no representation or warranty and assumes no liability as to the accuracy or completeness of the information provided, nor any loss arising from any investment based on a recommendation, forecast or any information supplied by any third-party.

Bearish drop?USD/ZAR is rising towards the pivot and could drop to the 1st support.
Pivot: 18.32616
1st Support: 18.05807
1st Resistance: 18.46573
Risk Warning:
Trading Forex and CFDs carries a high level of risk to your capital and you should only trade with money you can afford to lose. Trading Forex and CFDs may not be suitable for all investors, so please ensure that you fully understand the risks involved and seek independent advice if necessary.
Disclaimer:
The above opinions given constitute general market commentary, and do not constitute the opinion or advice of IC Markets or any form of personal or investment advice.
Any opinions, news, research, analyses, prices, other information, or links to third-party sites contained on this website are provided on an "as-is" basis, are intended only to be informative, is not an advice nor a recommendation, nor research, or a record of our trading prices, or an offer of, or solicitation for a transaction in any financial instrument and thus should not be treated as such. The information provided does not involve any specific investment objectives, financial situation and needs of any specific person who may receive it. Please be aware, that past performance is not a reliable indicator of future performance and/or results. Past Performance or Forward-looking scenarios based upon the reasonable beliefs of the third-party provider are not a guarantee of future performance. Actual results may differ materially from those anticipated in forward-looking or past performance statements. IC Markets makes no representation or warranty and assumes no liability as to the accuracy or completeness of the information provided, nor any loss arising from any investment based on a recommendation, forecast or any information supplied by any third-party.
