USDZAR Expected Outcome: 1.22% IncreasePrice pulled back to the horizontal support level, EMA 10 support level, and EMA 20 support level. Enter a market execution order and buy limit order.
USDZAR

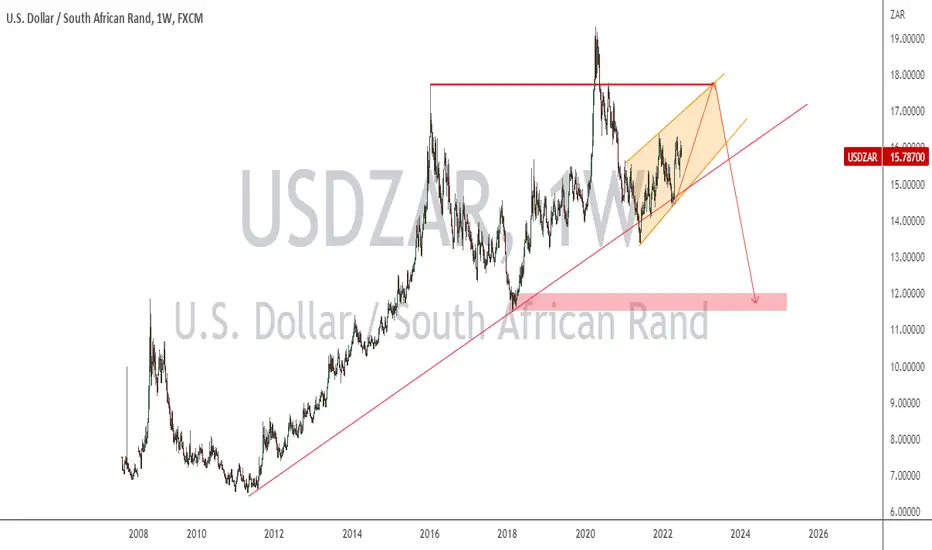
USDZARCurrently compressing within the bigger support line, however this may be broken sooner as my analysis says it time to camp for a sell signal at support breakout so we wait for the flag compression to be complete and we drop as far as the previous leg.
USDZAR 24th JUNE 2022South Africa inflation rises more than expected, The South African Reserve Bank (SARB) has raised rates for the first time it had hiked rates by 50 basis points since 2016.
Core inflation rose to 4.1% year on year in May, from 3.9% previously.
Basis core inflation was at 0.2% from 0.4%.
Consumer inflation was at 0.7% from 0.6% the previous month.
USDZAR H4

Market Overview USD/ZAR Market Overview USD/ZAR
We are currently at a very significant resistance level and which could push the market lower toward 11.76002 - 9.68326 area in the long term .
Monthly Take Profit 1 : 11.76002
Monthly Take Profit 2 : 9.68326

usdzar Easy Shorts coming upHi Traders
As expected, The fed has hiked the Interest rate which has resulted in the dollar getting weak. My interest then falls upon USD/ZAR as we see price has now come all the way back to broken support which is now resistance.
The biggest eye-catcher is the clean range to the left which has the potential of being filled. Price could smoothly make its way down to 15.50 with ease if it respects the technicals, I will be waiting for the current H4 candle to close below 15.95 Before taking short positions on this exotic pair.
Renaldo Philander

USDZAR $USDZAR Initial LongUSDZAR $USDZAR Initial Long. TP and SL on chart. Move SL on TP. After TP2, trail with 0.5ATR step and 1.5ATR offset.

strategy for small accounts Trading USDZAR strategy for those looking to grow their small account into a reasonable size account with risk management being applied at all times then transforming it into a bigger account while trailing your stop losses to minimize your losses close 55

USDCHF,USDZAR and USDCNH top-down analysis Hello traders, this is the full breakdown of this pair. We will take this trade if all the conditions are satisfied as discussed in the analysis. Smash the like button if you find value in this analysis and drop a comment if you have any questions or let me know which pair to cover in my next analysis.

USDZAR ForecastCurrently on Peak Formation Low. So will start o look for buying opportunities this coming week .

USDZAR – bullish PA expected .. the week of 06 June.The recent price action is corrective and within a channel structure. Many call this PA as a flag pattern (seen better on the H4 chart). Either way, price is now at support and I expect this 15.4240 region to hold. It has been tested a few times already and I am ready to take a long here. Additional factors in favor of a long are:
the preceding trend was bullish and
price is above the 200dma.
Even with a generous stop we still have the potential to get 2.7R and these odds make it a worthwhile risk. Bear in mind however, the wide spreads and negative swap in going long on this pair.
If you like my analysis, please give it a “thumbs up” and follow me to get immediate notifications.
Always use sound money and risk management and stay patient in all your trades.

USD/ZAR AnalysisThe South African Economy continues to find itself up against increasing challenges with forecasts on unemployment figures to increase after today's data release. Along with extended fuel price increases, putting even more pressure on the ZAR (Rand)
looking at our technicals, we find that a strong demand zone has been broken after a liquidity grab has taken place at the 15.463 area. A break of the 50-day moving average may indicate additional confidence in a weaker move for the ZAR.
We look to find a re-test of this demand level or a strong enough pullback to enter into a long position.

USDZAR ForecastExpecting a 3rd bearish push to complete the cycle on USDZAR. At first there might be a stophunt high before the drop.

Is the South African Rand forging its own path against the USD?The exotic pair of the U.S. Dollar to South African Rand (USD/ZAR) has not correlated strongly with other USD pairs since this year.
In fact, the USD is down 1.3% against the ZAR since the beginning of the year, all the while, the USD index has been super bullish, up 6.1% YTD.
While performing better than the GBP, EUR, and other major partners, the USD is still trading just under last November’s high. With the seasonal tendency of the USD to weaken over the Northern hemisphere’s summer months in combination with the strong trend-bucking Rand, Is it looking unlikely that the USD will take out those highs over the coming months?
A main reason for the ZAR’s strength is the interest rate hikes emanating from the South African Reserve Bank (SARB). Just last Thursday the SARB raised rates to 4.75% with a 50 basis point hike, which is the highest single increase South Africa has seen since 2016. It appears that the announcement was already priced in to the USDZAR since there was little volatility that followed. Several more aggressive rate hikes are expected from the SARB with at least another 50 basis point rise over 2022, and 100 basis points over 2023.
USDZAR technical perspective
On the charts, we can see the pair is floating just below the high created in November 2021. Just this month we've seen a new range created, to which the Fibonacci tool is anchored. There is also an Elder's Force Index (EFI) indicator on the bottom window. This indicator is concerned with the previous day’s opening and closing prices in relation to volume. Overbought and oversold conditions can be ascertained when the indicator moves above or below the zero line.
At the time of this writing, the USDZAR is sitting above on the 78.6% retracement level, with the EFI below the zero line. If the price is going to take out last November’s high, then we will need to see a sustained support at this level. Ever the contrarian, the USDZAR may disregard the oversold EFI confluence and continue on its path below the 78.6% level..

USDZAR possible sell zone!USDZAR has been rejected from the weekly level of resistance and creating a bearish price action.
It looks like USDZAR may drop from this level of resistance to the possible support at 15.42698


USDZAR OutlookWe currently have a price consolidation on possible (Level 1) zone after what looks like a reset on USDZAR. Price likely to breakout on the upside since the "RESET" seems to be a confirmed one.

USDZAR SHORTWe are waiting for a long term short on the ZAR but a short term sell is also the cards, We still believe that price must still go to 12.0000 before we can see a new high on this pair.

USDZAR Pull-back in Summer but bullish end-of-yearThe USDZAR pair is replicating the previous Cycle of 2016-2019 and right now is at the final Accumulation Phase before the rally to a blow-off top. What the comparison suggests, based also on the 1W RSI (attention the price action is on the 1D time-frame though), is that we may soon see a pull-back towards roughly 15.100 to September and then a strong finish to the year above 17.000.
--------------------------------------------------------------------------------------------------------
** Please support this idea with your likes and comments, it is the best way to keep it relevant and support me. **
--------------------------------------------------------------------------------------------------------

USDZAR SHORTHelloooooo traders....USDZAR showing signs of a drop coming most probably during NY session. Keep a lookout for a reaction at price 16.3000 for a fall. Risk small....happy trading.

USDZAR OutlookUSDZAR likely to continue rising because we had a reset and more potential on he upside. If it breaks the previous resistance we look forward to be taking longs. Also, retail sentiment states that there are more traders going short on USDZAR.

DXY (DOLLAR CURRENCY INDEX)Hello traders! For my opinion this pair in short term is in these level :
Target one: Buy 107.400
Target two: Sell 93.400
Don`t forget to look the economic calendar!
MAKE MONEY AND ENJOY LIFE 💰
THANK YOU!
GOOD LUCK!
🙏🏻🙏🏻🙏🏻

USDZAR - Approaching Yearly Support AreaI'm looking for USDZAR to bounce off the yearly support area. I've included two entries in case one fails. As always manage your risk. This is just what I'm seeing and is not financial advice.

USDZAR | BULLS CONTINUEUSDZAR has strong bullish momentum. Price has hit the high of 16.136 and took a major correction of a bullish rally. We saw the support come exactly at 23.6% of fib levels and candlesticks shows bulls are strong.
We are bullish as the momentum likely to continue and book profit recent high.
