Russell 2000 - C wave to complete correction?I have been bearish on the Russell for a long time. nothing has changed. the wave count is getting clearer... at least for now.
price action as of late has been like watching paint dry on the wall, still waiting for a catalyst... coming soon, i believe.
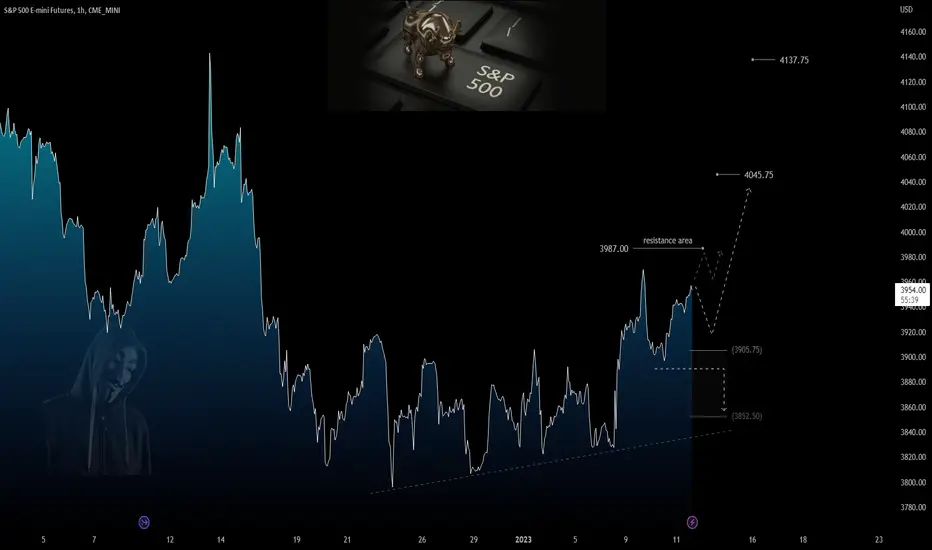
this count would only be invalidated with a sustained break above resistance zone.
**minor change from my previous charts - i have simplified the wave counts from a (WXYZ) to (ABC).
Usindices

Russell 2000 - Sell till late May & Buy in Early June?
Wave (ii) is still in progress. Slight update to the primary wave count from the previous one below.
200 & 100 SMA's are sloping firmly to the downside therefore I will continue to keep selling at technical levels. Late May or early June would be a good time to go long...
Support levels are shown in green.

Russell 2000 - one more drop to complete the correction?Looking for the double zig zag correction to complete (Y) leg in the blue zone. Will be looking for five waves to the downside for the target.
Updated the wave count from my previous chart below...
This drop from the 25th November 2024 to the expected target zone would be more or less similar to the Covid drop in terms of percentage.

Russell 2000 - time to Buy pullbacks...Shorts were good while it lasted... looks like a good time to buy pullbacks.
It would be wise to wait for a clear 3 wave correction though.
Elliot Wave Analysis shows a larger degree wave IV was completed in March 2020.
Since then, the Russell 2000 has been nesting within a bullish rectangle chart pattern, possibly working its way up to the larger degree wave V.
Seasonality Chart shows a bullish April with a possible correction in May.
Nevertheless, I will not commit to long trades till the chart clearly shows that we are out of the woods. A clear 3 waves move down closer to 1800 in the hourly/4 hourly time frame would be a good setup.

The Nasdaq 100 nears a big breaking pointThe Nasdaq 100 has continued declining, attempting to find some support after breaking below the August 2024 lows on 4 April. The next obvious support levels lie around the late 2021 and 2022 highs, which, for now at least, are offering some stability. It would not be surprising to see the index test that region during the trading session.
However, a break below support at 16,700 could be a negative signal for the Nasdaq, suggesting the index may head even lower. The next level of technical support would not appear until the July 2023 highs at 15,750. If that level breaks, the next area of support lies at the October 2023 low of 14,100, effectively erasing all gains made over the past 18 months.
The problem for the Nasdaq is that several areas on the chart will likely offer little to no support should it break under its 2021 highs, with numerous lower gaps remaining unfilled. This suggests the potential for further declines, which could extend to the 1.618% level around 14,510, especially as we’ve only seen a full extension of the initial bear flag so far.
If the Nasdaq can find support at the November 2021 highs, there is room for a rally back to 17,265, which marks the August lows, and potentially further to 18,360. However, a complete reversal back to the previous highs seems highly unlikely, given that the market may now reprice risk and reassess how much it is willing to pay for it.
Written by Michael J Kramer, founder of Mott Capital Management
Disclaimer: CMC Markets is an execution-only service provider. The material (whether or not it states any opinions) is for general information purposes only and does not take into account your personal circumstances or objectives. Nothing in this material is (or should considered to be) financial, investment or other advice on which reliance should be placed.
No opinion given in the material constitutes a recommendation by CMC Markets or the author that any particular investment, security, transaction, or investment strategy is suitable for any specific person. The material has not been prepared in accordance with legal requirements designed to promote the independence of investment research. Although we are not specifically prevented from dealing before providing this material, we do not seek to take advantage of the material prior to its dissemination.

S&P500 - Possible Short Term Top in. OANDA:SPX500USD is looking like its in the end of the move higher. Thursday/Friday were very slow after the early week rally even with NFPs giving things a spike.
now we look for Monday to give us some clues for the next move.
Option 1 - We get a move down to 5320 before one more high up to 5400 area.
Option 2 - The top is in on this run from the April low and we get a deeper PB down towards 5200 followed by another ATH around 5500.
Option 3 - But less likely, it holds Fridays lows and we get one more run up to 5400 then a deeper correction.
Things to watch going into this week with Inflation data Wednesday/Thursday and the next Interest rate decision out of the US Wednesday were they are expected to keep things at the same level.
I will also post expected intra-day movements throughout the week.
Enjoy the week, watch for Monday clues.

DOW JONES - Completed Pattern. OANDA:US30USD While the OANDA:SPX500USD & OANDA:NAS100USD have been hitting new highs the DOW has struggled and has completed a Double ABCD Gartley pattern on friday and sold off into the close.
Setting up potential downside targets of 38300, 37800 & to complete the bigger pattern @ around 37k.
If we start heading lower on Monday then that could put the wheels in motion for the bigger correction.
Big data out mid week will send it one way or the other.
Enjoy the week.
I will post shorter time frame areas to watch with potential intraday turns points.

Dow Jones Industrial Averages Weekly Technical Analysis(1) We have witnessed a sharp fall from 29,500 level in Feb’20. This was almost 38% fall from the top. Market had gone in a oversold zone.
(2) Around 18,300 level, price found a support and bounced back from this level.
(3) With an upside rally, price managed to breakout its previous resistance.
(4) After the breakout, we have seen a sharp upside rally further and the price reached at 36,950 level.
(5) A corrective decline has been seen from there and the price started making lower highs and lower lows at reached to 28,800 level.
(6) Price again bounced back from there and gave a upside move.
(7) In this entire consolidation phase, a Cup & Handle chart pattern has been formed, which gave us positive indication.
(8) With a strong breakout of the Cup & Handle pattern, price started its journey upside.
(9) Currently the price is standing near its All Time High. More upside move is expected from here.

Whats Next for NAS?NAS makes a balanced range on the 4H chart, we are now at the extreme boundary of it, we are now either going to see mean reversion back to 17800 or a break higher towards 19k! will post an update into next week.

S&P 500 H4 / Bearish Market Structure Idea ✅Hello Traders!
This is my idea related to S&P 500 H4. I would like to see another ATH set, and after that, I will look for a short entry. I expect that the S&P 500 will reach the resistance level, and if confirmed, I will execute a short trade. I will look for a short entry in the smaller time frame. The target is the FVG at the price of 5000-4980.
Traders, if my proposal resonates with you or if you hold a divergent viewpoint regarding this trade, feel free to share your thoughts in the comments. I welcome the opportunity to hear your perspectives.
____________________________________
Follow, like, and comment to see my content:
www.tradingview.com

US500 M15 / Expecting a rise until the price of 5000 💲Hello traders!
This is my idea related to the US500 M15. The sellers' sentiment is still strong, and I expect a new ATH until the price of 5000 after that, I will look for a shot trade entry.
It represents a good opportunity to look for a long trade entry.
Traders, if you liked my idea or if you have a different vision related to this trade, write in the comments. I will be glad to see your perspective.
____________________________________
Follow, like, and comment to see my content:
www.tradingview.com

US100 M30 / Short Trade Opportunity on US indices ✅ Hello Traders!
This is my Idea related to UA100. I expect a bearish move if confirms the breakout of the mentioned BOSS. It also will be a sign of a bearish market structure.
I expect that FVG H1 will be closed, this area represents also my target.
Traders, if you liked my idea or if you have a different vision related to this trade, write in the comments. I will be glad to see your perspective.
____________________________________
Follow, like, and comment to see my content:
www.tradingview.com

US30 H1 / TWO POINTS OF INTEREST / POSSIBLE SCENARIOS FOR LONG✅Hello Traders!
This is my idea related to US30 H1. I see two possible scenarios where I will look for a long entry in case of confirmation of retracement.
You can see two resistance zones from where I expect US30 will go bearish. In case of confirmation of retracement from the resistance zones, I will execute long trades until the price of 37760.
Traders, if you liked my idea or if you have a different vision related to this trade, write in the comments. I will be glad to see your perspective.
____________________________________
Follow, like, and comment to see my content:
www.tradingview.com

US Indices: Possible Short AreasI'm looking for a short across the US stock market. Possible market alignment on marked s/r zones. Not a bad idea to check DXY too before opening a position.

Wave 3 in S&P500 materials indexThe S&P 500 Materials index set out an impulse move(1) in October last year and completed the up move move by Jan 2023.
The index thereon was in a corrective phase throughout most of the current year until recent oct. low.
The correction according to Elliot wave model can be categorized as a "flat". The constantly rising dollar index can also be linked to the underperformance of this sector throughout 2023.
The projected wave 3 target for the index should be(min.) close to 600 zone(20% from current levels).
Note*- This is not a buy/sell advice. The chart is for educational purpose only.

Weekend Update on Nasdaq Futures Here i am discussing my take on the today's price action and also my game plan on tomorrow.
I am also discussing the current scenarios and the probabilities for what is going to happen on intraday basis. I try analyze the markets with the most unbiased way possible. Here is my complete analysis for today's session and for tomorrow's outlook. Please feel free to comment and share your views and feedback.
Thanks

SP500: Consolidation in Short Term?Hi Traders!
Medium and Long-Term Trends are bullish, but in short term SP500 could remain bearish even after a pullback. If we look at daily chart, the Price Action is approaching an important support area around 4,305, if from here it triggers a bullish leg, it's possible a harmonic structure formation (for us, bearish). Having said that, we have a first Target Area around 4,275 and subsequently 4,220.
Trade with care
Like | Share | Comment

SNP likely heading for ATH again!Before it heading to ATH could have something it needs to do before that.
To find out what is it, do check out my stream!
Thank you!
***************************************************************************************
Hello there!
If you like my analysis and it helped you ,do give me a thumbs ups on tradingview! 🙏
And if you would like to show further support for me, you can gift me some coins on tradingview! 😁
Thank you!
Disclaimers:
The analysis shared through this channel are purely for educational and entertainment purposes only. They are by no means professional advice for individual/s to enter trades for investment or trading purposes.
The author/producer of these content shall not and will not be responsible for any form of financial/physical/assets losses incurred from trades executed from the derived conclusion of the individual from these content shared.
Thank you, and please do your due diligence before any putting on any trades!

SNP500 more downside to come could be seeing 4300 or 41xx
**Find out more from my Tradingview Stream this week**
***************************************************************************************
Hello there!
If you like my analysis and it helped you ,do give me a thumbs ups on tradingview! 🙏
And if you would like to show further support for me, you can gift me some coins on tradingview! 😁
Thank you!
Disclaimers:
The analysis shared through this channel are purely for educational and entertainment purposes only. They are by no means professional advice for individual/s to enter trades for investment or trading purposes.
The author/producer of these content shall not and will not be responsible for any form of financial/physical/assets losses incurred from trades executed from the derived conclusion of the individual from these content shared.
Thank you, and please do your due diligence before any putting on any trades!

Us30 possible longWith the dollar index dropping in price
There might be a rise in the price of all us indexes
If us30 breaks 33204 then we might see a rise to 33800 or possibly 34000

Combined US indexes suggest a spike upThe Combined US indexes chart ended the week with a bearish candlestick that had a little bullish indication with a longer tail and closing above the support line (aka Fake Out Line #2).
This is slightly bullish and represents a chance for the earlier projected target of 668 to be achieved in the coming week or two. Yes, technical indicators appear to suggest that it is a bit stretched but it does look as if it would like to spike up, maybe in a blow off top fashion.
This is aligned to the USD drop described earlier.

S&P 500: Intraday SessionHi everyone!
The short-term technical structure remains bullish, but to confirm it, it is forced to follow one of the movements shown on the chart (1h), having said that, let's try to follow today's session together...
If this idea will be supported by your "Likes" we will continue to follow the crypto with updates below.
thanks for your attention and please... trade with care! 💖
SPX - We are still within the range!SPX - We are still within the range!
SPX - For most indices we've had bullish momentum especially in Europe side cac, ftse, dax amazing moves but we are still struggling when it comes to US Indices. We've had great bullish momentum at the end of the week now let's not get too excited we are still within the ranges things to keep in mind this week going forward CPI, Q4 earnings, Unemployment claims coming out of US.
Key tip: Ignore the noise and focus on the chart in front of you. Everyone has opinions, they'll even comment on your career choice but most importantly only YOU can learn and earn by the execution of your own trades.
A break to either direction.
Trade Journal
