Corrective Dip or New Downtrend on the S&P 500 Futures?🟣 1. Impulses vs. Corrections – The Classical View
When price trends, it doesn't move in a straight line. Instead, it alternates between directional movements called impulses and counter-directional pauses or retracements known as corrections. Most analysts define an impulse as a sharp, dominant move in the direction of the trend—typically accompanied by rising volume and momentum indicators. Corrections, on the other hand, tend to be slower, overlapping, and often occur with declining volume.
Common methods to identify impulses vs. corrections include:
Swing structure: Higher highs and higher lows suggest impulse; overlapping lows suggest correction.
Fibonacci retracements: Corrections often retrace up to 61.8% of a prior impulse.
Moving averages: Price above a rising MA is often viewed as impulse territory.
Volume analysis and oscillators such as RSI or MACD are used to confirm price behavior.
Despite the abundance of methods, the distinction between impulses and corrections often remains subjective. That’s where the Directional Movement Index (DMI) provides an objective lens—especially when paired with price action.
🟣 2. Rethinking Impulses with the DMI Indicator
The Directional Movement Index (DMI), developed by J. Welles Wilder, offers a quantitative way to assess the strength and direction of price movement. It breaks down market activity into three components:
+DMI (Positive Directional Movement Index): Measures the strength of upward movements.
−DMI (Negative Directional Movement Index): Measures the strength of downward movements.
ADX (Average Directional Index): Quantifies overall trend strength but is optional in this discussion.
The key to applying DMI lies in the crossover between +DMI and -DMI:
When +DMI > -DMI, upward price moves dominate—suggesting bullish impulses.
When −DMI > +DMI, downward moves dominate—suggesting bearish impulses.
Calculation is based on a comparison of successive highs and lows over a specific lookback period—commonly set to 14 or 20 periods.
While EMAs track trend direction and momentum, DMI helps dissect who’s in control. This makes it a powerful filter when evaluating whether a breakdown or breakout is likely to become an impulsive trend—or just another correction in disguise.
🟣 3. Case Study – Two Breakdowns, Two Outcomes
Let’s apply this logic to two recent moments on the E-mini S&P 500 Futures (ES) daily chart.
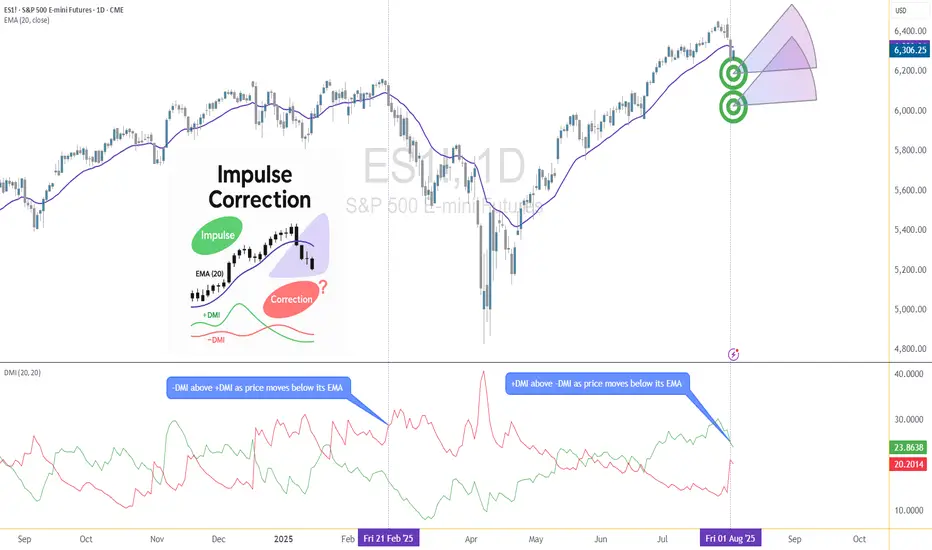
🔹 Feb 21, 2025 Breakdown
Price broke sharply below the 20-period EMA. At first glance, this looked like a potential trend reversal. The DMI confirmed this suspicion: −DMI surged above +DMI, signaling downside impulses were in control. The market followed through with a clear downtrend, confirming the move was not just a pullback—it was a shift in market structure.
🔹 Aug 1, 2025 Breakdown
A similar sharp break below the 20 EMA just occurred again. However, this time +DMI remains above −DMI, despite the bearish price action. This divergence tells a different story: the breakdown may not be impulsive in nature. Instead, it's likely a corrective dip within a broader uptrend, where buyers are still the dominant force.
This is a textbook example of how a moving average crossover without DMI confirmation can mislead traders. By combining these tools, we’re able to make more informed decisions about whether price action is signaling a true shift—or just a pause.
🟣 4. CME Product Specs – ES vs. MES
Traders can express directional views on the S&P 500 using two primary CME futures contracts: the E-mini S&P 500 Futures (ES) and the Micro E-mini S&P 500 Futures (MES). Both track the same underlying index but differ in size, capital requirement, and tick value.
✅ E-mini S&P 500 Futures (ES)
Symbol: ES
Contract Size: $50 x S&P 500 Index
Tick Size: 0.25 index points
Tick Value: $12.50
Initial Margin: Approximately $21,000 (varies by broker and through time)
Market Hours: Nearly 24/6
✅ Micro E-mini S&P 500 Futures (MES)
Symbol: MES
Contract Size: $5 x S&P 500 Index
Tick Size: 0.25 index points
Tick Value: $1.25
Initial Margin: Approximately $2,100 (varies by broker and through time)
The Micro contract provides access to the same market structure, liquidity, and price movement as the E-mini, but with a fraction of the exposure—making it ideal for smaller accounts or more precise position sizing.
🟣 5. Risk Management Matters
Understanding whether a market move is impulsive or corrective isn’t just academic—it’s the difference between positioning with the dominant flow or fighting it. Traders often get trapped by sharp moves that appear trend-defining but are simply noise or temporary pullbacks.
Using tools like DMI to confirm whether directional strength supports price action provides a layer of risk filtration. It prevents overreaction to every EMA crossover or sudden price drop.
Stop-loss orders become vital in both impulsive and corrective conditions. In impulsive environments, stops help lock in profits while protecting from reversals. In corrective phases, they act as circuit breakers against breakouts that fail.
Moreover, knowing the product you're trading is critical:
A single ES contract controls ~$320,000 of notional value.
An MES contract controls ~$32,000.
This disparity means poor sizing on ES can magnify errors, while proper sizing on MES can offer flexibility to test, scale, and hedge with tighter capital control.
Whether you're reacting to price or preparing for continuation, risk management is the only constant. It’s what turns analysis into disciplined execution.
When charting futures, the data provided could be delayed. Traders working with the ticker symbols discussed in this idea may prefer to use CME Group real-time data plan on TradingView: www.tradingview.com - This consideration is particularly important for shorter-term traders, whereas it may be less critical for those focused on longer-term trading strategies.
General Disclaimer:
The trade ideas presented herein are solely for illustrative purposes forming a part of a case study intended to demonstrate key principles in risk management within the context of the specific market scenarios discussed. These ideas are not to be interpreted as investment recommendations or financial advice. They do not endorse or promote any specific trading strategies, financial products, or services. The information provided is based on data believed to be reliable; however, its accuracy or completeness cannot be guaranteed. Trading in financial markets involves risks, including the potential loss of principal. Each individual should conduct their own research and consult with professional financial advisors before making any investment decisions. The author or publisher of this content bears no responsibility for any actions taken based on the information provided or for any resultant financial or other losses.
Usmarkets
SPY to continue fallingSPY reached a top (resistance) fork line and started to fall. Based on this I entered long on VIX on July 28, when VIX was at its lowest point. I expect this fall of the market to continue.
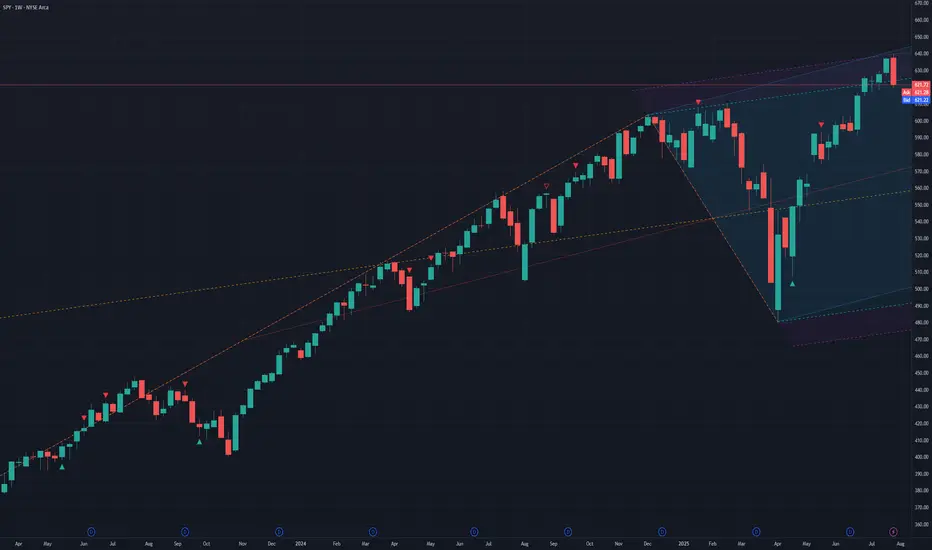
Expect Correction august/septemberMarkets MUST correct, everything is overbought and sentiment is Extreme greed. RSI points to extreme overbought territory, VIX very low and not going any lower (reached bottom).
Usually august/september the market corrects. so i expect a correction around 5-8%.
Be prepared, dont chase FOMO. Be careful.
SP:SPX TVC:SPX CBOE:SPX CBOE:XSP AMEX:SPY

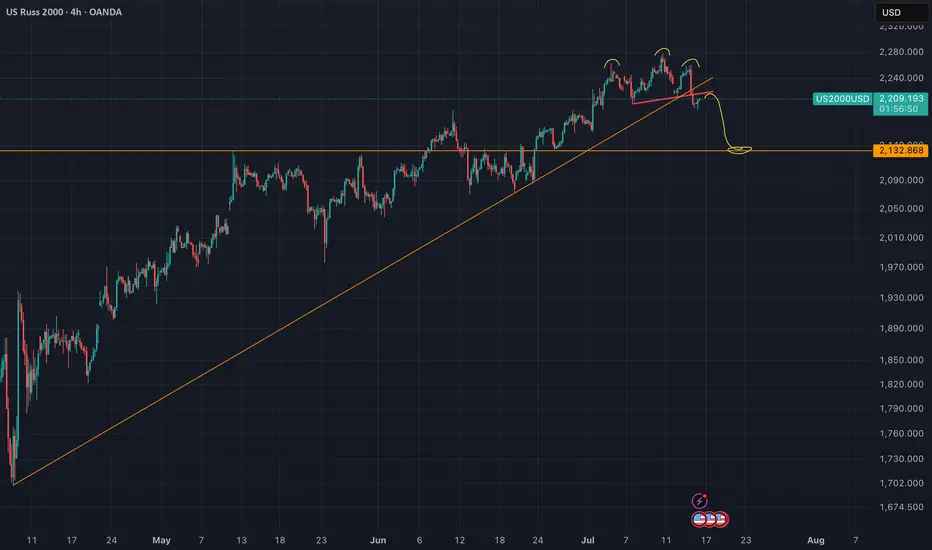
US2000 - Head And Shoulders (Top signal)Reversal in play. The neckline of the H&S got validated yesterday.
Nothing here should be interpreted as financial advise. Always do your own research and decisions.
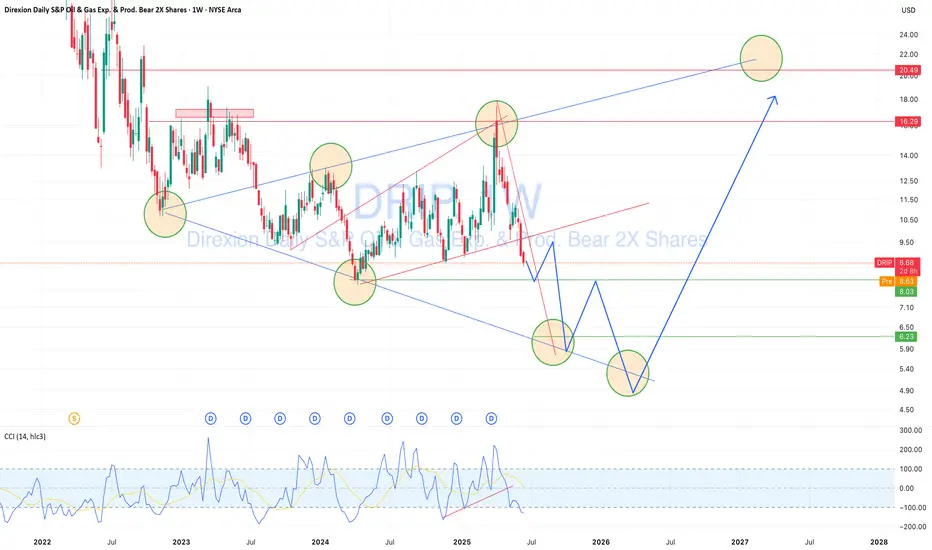
DRIP — Geopolitical Oil Risk Creates a Buying OpportunityDRIP (inverse 2x ETF on US oil & gas exploration/production) is approaching a key technical support zone.
While oil may continue rising short term due to geopolitical tensions — especially US-Iran risks and Middle East instability — this short-term pressure could push DRIP lower toward the $5.00–6.00 area. That zone aligns with strong historical reversal points and trend support. From there, a rebound toward $12.00–20.00 is technically and fundamentally possible, offering 30–50%+ profit potential. I’m planning staged entries in the marked range, managing risk with awareness of commodity market volatility and global uncertainty.

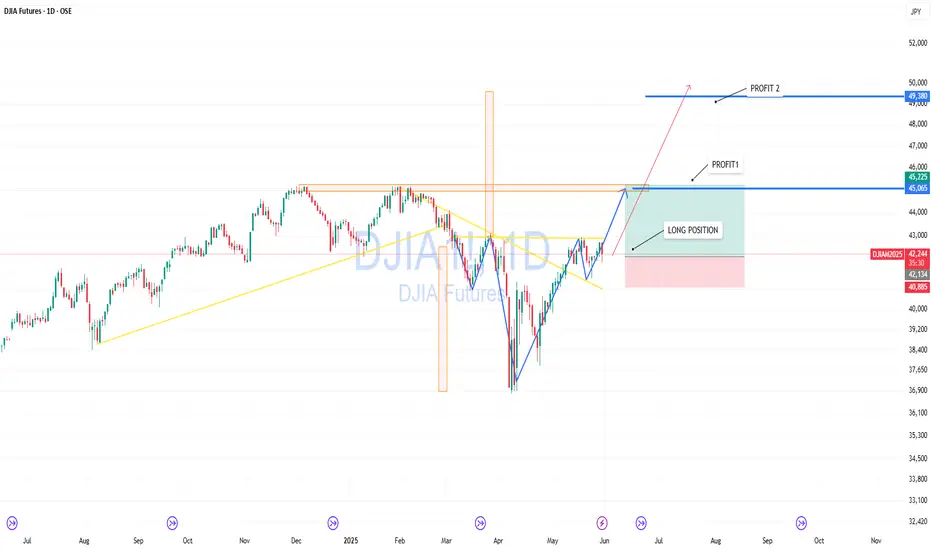
DJIA — Setting Up for Breakout and New ImpulseThe Dow Jones Index is approaching a critical resistance zone. After a deep V-shaped recovery and clear bullish structure, price is preparing for a breakout.
Chart shows a clean long entry with a stop below the recent consolidation. A break and hold above 45,000 could lead to a move toward 46,000, and if momentum holds — up to 49,300.
Partial profit-taking levels:
— Target 1: 45,225
— Target 2: 49,380
Fundamentally, US equity markets remain strong, and DJIA may play catch-up after lagging during the last correction.
Post-Liberation Day Sell-Off – Crash or Correction?Liberation Day has turned into a dramatic "blow the markets back out" day for the SPY , with a significant daily drop of nearly 6%, slicing decisively below the critical 200-day moving average at $574.46. Historically, breaking below the 200-day MA is a strong bearish signal, indicating potential further downside momentum.
The previously identified key bearish pivot, the "Best Price Short" at $565.16, served as a crucial resistance level from which sellers aggressively stepped in, intensifying today's sell-off. Given the current bearish sentiment, the next immediate downside targets without a significant bounce (dead-cat bounce) include:
Half 1 Short (Momentum target): $505.28 (already tested)
High Vol Momentum Target 1a: $497.66
Half 2 Short (secondary bearish momentum): $486.41
Extended Momentum Target (HH Vol Momo Target 2a): $475.16
For traders who missed the initial move, look to re-enter shorts if there's a modest retracement toward the previously broken "Weeks High Short" at $520.16, maintaining tight risk control with stops ideally set just above the "Best Price Short" ($565.16).
Critical levels summary:
Ideal Short Re-entry Zone: $520.16
Profit Targets: $497.66, $486.41, and ultimate $475.16
Stop Loss Area: Slightly above $565.16
Major Broken Support (Resistance now): 200-day MA at $574.46
Today's significant volume spike further reinforces bearish conviction. RSI is deeply oversold at 23.24, suggesting caution for potential short-term bounce, but any bounce is likely to be short-lived unless there's a substantial political or economic pivot soon.
These levels are algorithmically defined, designed to remove emotions from trading. Trade responsibly, adhere to your strategy, and protect your capital.

MON100 : Going long for about 5% of the net capitalTook two positions of 2.5% of the net capital each, at various levels, summing up the total holding in the scrip for about 5% of the net capital. Will be targeting the all time high for a percentage move of about 20% from the current average entry price.
Might consider adding on to the position if price dips and reaches the next critical buying zone, after evaluating the fundamental and sentimental scenarios prevailing globally at the time.
📢📢📢
If my perspective changes or if I gather additional fundamental data that influences my views, I will provide updates accordingly.
Thank you for following along with this journey, and I remain committed to sharing insights and updates as my trading strategy evolves. As always, please feel free to reach out with any questions or comments.
Other posts related to this particular position and scrip, if any, will be attached underneath. Do check those out too.
Disclaimer : The analysis shared here is for informational purposes only and should not be considered as financial advice. Trading in all markets carries inherent risks, and past performance is not indicative of future results. It’s essential to conduct your own research and assess your risk tolerance before making any investment decisions. The views expressed in this analysis are solely mine. It’s important to note that I am not a SEBI registered analyst, so the analysis provided does not constitute formal investment advice under SEBI regulations.

Recession IncomingVery clear confirmation signals here across many sectors in the market that we are in a recession. Fundamentals were breaking down last summer in fact, but now everything is rising to the surface and markets are turning. Buckle up.
Oil is breaking down today.
Bond yields continue to signal de-risking.
USD continues to break down.
USD/JPY is heading lower back toward July panic levels.
VIX is sustaining above 20.
I'm not 100% clear on the structure of this count, so please feel free to share your charts and insight here, but I don't think we are looking at a buy the dip and shoot back to new highs situation anytime soon here.. Unless Trump's entire policy stance changes, he drops Tariffs, and starts increasing the deficit and handing out money, the tightening and de-risking will continue. That said, I believe this is a great thing long-term and is what needs to happen, so I am all for a recession at this point. But this medicine is going to tasty very bad.
All of those white boxes below the price chart are unfilled gaps. I'm not entirely sure if there is an amount of time that passes that makes unfilled gaps less reliable, but still they are there.

Rigetti Computing to breakout soonRigetti Computing Inc NASDAQ:RGTI – Breakout Trade Setup 💪🔥🚀
Entry: Above $12.50 for confirmation
Stop Loss: $10.50 to manage risk
Target: $31.63 based on measured move projection
Risk-Reward Ratio: High potential reward compared to risk
Why This Trade? 📚💡
The stock has been consolidating under a descending trendline and is attempting a breakout. High volume suggests strong buying interest. The measured move target shows significant upside potential.
Risk Management ☔
Use a tight stop below $10.50 in case of a false breakout. Consider scaling out profits near $20 to lock in gains before reaching the full target. Monitor price action for confirmation.
Final Thoughts ✅
RGTI presents a strong breakout opportunity with high growth potential. Watch for sustained momentum before entering the trade.

$MSFT with a neutral outlook following its earnings #StocksThe PEAD projected a neutral outlook for NASDAQ:MSFT after a negative under reaction following its earnings release placing the stock in drift D with an expected accuracy of 57.14%%.

SPY bearish pitchfork setupSPY reached the middle (red) of the pitchfork line which may act as a resistance line. There is also a chance that it will break through and go to the next line up but I find it more likely that it will go down over the coming weeks.

Possible wave counts of chart NVIDIA dip now then upHello Friends,
Today we have plotted Elliott wave counts on NVIDIA Corporations chart Technical Analysis Case study, In this study we used Elliott Wave Theory & Structures, it involves multiple possibilities, and the analysis presented focuses on one potential scenario. The provided information is for educational purposes only, not trading advice. There's a risk of being completely wrong, and users are warned not to trade or invest solely based on this study. The content is not an advisory and does not guarantee profits, We are not responsible for any kind of profits and losses; individuals should consult a financial advisor before making any trading or investment decisions.
I am not Sebi registered analyst.
My studies are for educational purpose only.
Please Consult your financial advisor before trading or investing.
I am not responsible for any kinds of your profits and your losses.
Most investors treat trading as a hobby because they have a full-time job doing something else.
However, If you treat trading like a business, it will pay you like a business.
If you treat like a hobby, hobbies don't pay, they cost you...!
Hope this post is helpful to community
Thanks
RK💕
Disclaimer and Risk Warning.
The analysis and discussion provided on in.tradingview.com is intended for educational purposes only and should not be relied upon for trading decisions. RK_Charts is not an investment adviser and the information provided here should not be taken as professional investment advice. Before buying or selling any investments, securities, or precious metals, it is recommended that you conduct your own due diligence. RK_Charts does not share in your profits and will not take responsibility for any losses you may incur. So Please Consult your financial advisor before trading or investing.

NVIDIA (NVDA) Daily AnalysisNVIDIA (NVDA) Daily Analysis
On the daily time frame, NVIDIA has already broken out of a triangle pattern and is now forming a potential head and shoulders pattern. Here’s the breakdown of the current structure:
Gray support zone: A critical level to monitor. If this level breaks, the next significant support is the purple support zone, which also aligns with the Point of Control (POC) at this level.
If the price retraces to the purple support zone, it could present a potential entry opportunity with proper confirmation.
Based on the projection from the triangle breakout, the green zone remains a key target for later upward momentum.
This is a free idea I’m sharing with the community. If you find value in my analysis, your likes, shares, and follows would be greatly appreciated. I take the time to share my insights, and your support motivates me to keep doing so. 🙏
Thank you!

S&P sellers kick in, but the market remains strongLast week was marked by some selling activity. As anticipated, sellers took advantage of temporary bullish exhaustion and attempted to push the market down. A strong sell-off occurred on Wednesday, with the market losing 1.2%. However, this sharp decline did not see much follow-through, as the price found strong support at the top of the previous consolidation zone ( 574.7 ). On Friday, buyers even attempted to set a new daily high, but they were unable to maintain it through the close.
All of this leads me to believe that the sellers are not particularly strong, and we remain in a broadly bullish environment. A few key points supporting this bullish outlook include:
1. The weekly uptrend is still intact, and there is ample room for this weekly higher low.
2. There is relative strength in "risk-on" sectors (XLK, XLY), suggesting that bullish sentiment hasn't completely faded.
While we might see some short-term rotation within the 584.5–574.4 range, defined by two daily candle wicks (Wednesday and Friday), the long-term outlook remains decidedly bullish.
This week, important economic data will be released, along with earnings reports from major tech companies. This is likely to cause increased volatility, but unless there are major negative surprises, bullish sentiment should remain solid.

S&P Bulls Hold Strong, But Is a Market Cooldown Coming?Last week wasn't particularly remarkable. Despite two bearish attacks (on Tuesday and Thursday), buyers still managed to push the market to a new historical high. It was somewhat concerning that they couldn’t sustain the high for even an hour after the open, but since the bearish movement didn’t gain momentum on Friday, the bulls still have the upper hand. We may see some consolidation in the upcoming weeks, as there are signs that the rally is approaching exhaustion (weakening of upthrust, weekly RSI entering the overbought zone, weakness in XLK). However, this market has repeatedly demonstrated its resilience and ability to exceed expectations.
The long-term outlook remains bullish, but given these signals, it would be prudent for buyers to downsize their positions and refrain from selling PUTs.
Mind TSLA report on Wednesday as it can cause some volatility and act as a trigger.

SMCI at a Critical Support: Will Buyers Return?In the daily time frame, SMCI is approaching a key support zone, highlighted in green. This area previously acted as strong resistance, with several attempts to break above it. Although the price hasn’t returned to this zone yet, I believe once it does, buyers could step in again. This level has proven significant before, and if the price revisits this support, it could present a potential buying opportunity. Keep an eye on this zone, as it may signal a shift in momentum if buyers come back. This version reflects that the price hasn’t yet revisited the support zone.

FANG DIAMONDBACK ENERGY, INC.Swing trading potienal
holding period one month
Hi i am swing trader based in india, and i am closely monitoring markets in US
i would love to share swing oppurtunity for u guys

THE KOG REPORT - FOMCTHE KOG REPORT – FOMC
This is our view for FOMC, please do your own research and analysis to make an informed decision on the markets. It is not recommended you try to trade the event if you have less than 6 months trading experience and have a trusted risk strategy in place. The markets are extremely volatile, and these events can cause aggressive swings in price.
We’re expecting some volatility this Session with the pending FOMC statement so for this report we’ll again look at the extreme levels. We’ve done well already this week, no need to risk anything trying to capture tops and bottoms, so keep an eye on the levels but remember, the trade comes after the event.
The move started early in the week with the price hitting our resistance level and then making the move we wanted completing our first target. This has however left the completion of the move on the table, so we’ll stick with Sundays KOG Report idea for now, but expect a move to the upside potentially into that 2602-5 region and above that 2610! It’s 2610 as the extension that needs to reject the price in order for it make that move downside, as breaking above that will take us further into the 2625-30 region before any breather.
So, as the chart shows, if we get 2602-5 and reject, we could see price move downside to clear the liquidity sitting first at 2550-55 and below that 2525-30.
2525-35 if visited, we feel would represent an opportunity to capture the swing low and then attempt to target that 2550-55 region as the first target.
We’re going to play it safe this time and say if it works it works, if it doesn’t, it doesn’t. If you followed us this week, again we’ve done what we needed to for the week, everything else here is a bonus and should be treated with minimal risk on the markets, until they have settled.
Please do support us by hitting the like button, leaving a comment, and giving us a follow. We’ve been doing this for a long time now providing traders with in-depth free analysis on Gold, so your likes and comments are very much appreciated.
As always, trade safe.
KOG

US DOLLAR - Boxed RangeUS DOLLAR is trading SUPPORT and RESISTANCE zones within a boxed RANGE.
It is respecting a range of 100.53 - 101.93, with respective bounces on either end, keeping it within its BOXED RANGE.
When I'm speaking about a BOXED RANGE, what I mean is that the RANGE ISN'T TIGHT like a normal range, where its looking for volume before a big move, these types of ranges have volume and are easier to read as they respect KEY ZONES, for example right now they are respecting 100.53 - 101.93.
We should wait for the US DOLLAR to enter either SUPPORT or RESISTANCE to enter a trade, we can wait for a rejection + bounce or wait for a breakout.
If the US DOLLAR breaks to the downside (BEARISH) I would expect for the overall US markets to continue it's BULLISH movements, as usually the US MARKET IS INVERSELY PROPORTIONAL TO THE US DOLLAR INDEX...
Conversely if it shows BULLISH signs and begins to move towards the SUPPORT ZONE, I will be looking for the US MARKET to move BEARISH.

NQ E-mini FutureHi guys,
In this chart i Found a Demand Zone in NQ CHART for TRADING entry,
Observed these Levels based on price action and Demand & Supply.
*Don't Take any trades based on this Picture.
... because this chart is for educational purpose only not for Buy or Sell Recommendation..
Thank you

Can we go back to reality?Congratulations NVDA, because you delivered everything you could deliver in terms of good results, however, can we get back to reality?
Will the Black Monday that we experienced in 1987, in the DOW JONES index, be experienced again in 2024, and thanks to NVDA and technology companies?
We know what happened between 1980 and 1985 to the American economy, right?
It is known that in the 1980s and early 1990s, dollars could circulate freely around the world, so much so that we had a global economic miracle, and the world was swimming in booming growth.
But, at the current moment, dollars can no longer circulate freely around the world (FED, China, Russia) and continue contributing to global growth? Therefore, the technological war we are experiencing today (chips and electric cars), diverted dollars to these sectors, further inflating this bubble that is about to burst.
Speaking of electric cars, China is firmly dumping its electric cars around the world at very reasonable prices (as it has no intention of breaking its internal market – control), once and for all destroying the automobile industry in many emerging countries, oh my, no?
Let's go graphics.
Monthly: NVDA has reached the three golden levels of the FIB of the SETUP used, so there is nowhere else to go. So, SPX, get ready.
The red lines are resistance points.
Weekly: With the brilliant financial report recently released, prices are ready to seek the golden region of this chart period.
The red lines are resistance points.
Daily. Prices have reached the region of 100% of the bullish pivot.
The red lines are resistance points.
Do your analysis and good business.
Be aware, if you buy, use stop loss.
See other graphical analyzes below.
