NASDAQ Doesn't Make Any Sense Anymore! But let's earn some moneyWe know it's wrong. We know it's unsustainable. There's a Corona Crisis. There's unsustainable growth. There are huge unemployement issues. Crazy deathrates.
Stockmarkets are surging.
No, it doesn't make any sense. But to make a decision on this trade when the price hit this support zone so beautifully we have to look at the data. Purely based on technical analysis I expect the price to break out.
Okay, we could look at fundamental information like how the technology sector might not be negatively impacted by corona as much as the other sectors. Not just because their products are all online, and people have to arrange their whole life online right now. Also because the people who work for those companies are much more comfortable and capable working from home.
But hey, look at other markets that are not technology based. All green. All going up. This doesn't make any sense to me. Let's earn some money.
It already tried this level one time before, and only bounced back a little bit. With this second attempt on the resistance the bulls will be stronger and have left many bears behind them.
Follow me for consistent high quality updates, with clear explanations and charts.
Please like this post to support me.
- Trading Guru
--------------------------------------------------------------
Disclaimer!
This post does not provide financial advice. It is for educational purposes only!
Usmarkets


Microsoft Corp. $MSFT#Microsoft is holding above daily 50SMA. Needs to get over $170 to start uptrend

SPX: Trump was elected at 2200Hi Guys,
long time since the last time. I hope you are all well and fine.
Let's dive into it!
March 23 - FED announced it would buy bonds in unlimited numbers and backstop direct loans to companies, the latest in a series of policy steps taken over the past 10 days to calm markets and support the economy.
(www.reuters.com)
SPX bounced at 2200 (red dotted line) which is the starting point of Trump's US Presidency.
Please click & play the following chart posted on Feb 29 (Sat) in order to review the informations and watch it unfold:
March 3 (Tue) - by cutting rates the FED managed to slow it down at 2950 but the effects of the emergency measures did not last long:(www.reuters.com)
March 9 (Mon) - market keep falling. Please click & play the following chart posted on March 6 (Fri) in order to review the informations and watch it unfold:
Just to note that the FED held 6 meetings in March to calm markets. (www.federalreserve.gov).
TECHNICAL:
- price below 200SMA (as in 2015/2016 and in 2018/2019) currently supported at 2200 (A);
- price pulling back from 2200 (A) in what may be a bear rally into 200SMA at approx 50% of Covid19 downtrend from (0 zero);
- VIX maybe on its way below 30 again;
Questions:
1) how long will it take for the market to cross and consolidate above 200SMA and resume Progress again?
2) what what kind of recession is the COVID-19 recession going to be? V-Shaped? L-Shaped? W-Shaped?
3) Is this a virus-related recession, or is it the one economists said was on the horizon?
For information iro The Flash Recession (2nd circle in red) please review the following chart posted on Apr.7, 2019:
Thank you for your support and for sharing your ideas.
Disclaimer:
Please note that I am not a professional trader and these are my personal ideas only. The information contained in this presentation is solely for educational purposes and does not constitute investment advice. The risk of trading in securities markets can be substantial. You should carefully consider if engaging in such activity is suitable to your own financial situation. Cozzamara is not responsible for any liabilities arising from the result of your market involvement or individual trade activities.
IMHO: The point of trading is to make money. To make money you must have money. Depending on the money at your disposal, you can decide what to do and how to do it. By having stops you decide how much you are willing to lose. By having targets you decide how much you want to earn. Be disciplined with your protocol and with your strategies for trading. Sometime you win, sometime you lose. Don't be greedy. Be realistic. Be wary but not afraid. Be curious. Use your brain. As long as your working process make sense and your spirit is calm, everything will be fine. Be patient and be prepared for any circumtances.

S§P 500 $SPXAfter hitting for two weeks, $SPX broke out 200SMA this week. #Fibonacci numbers work very well. It is just below 0.5 and next target will be 0.68 which is 2935.


S&P500 could see short-side soon as inching closer to 50%The S&P500 is reaching a resistance area and showed a sell off yesterday. However the 50% level has not quite been reached and could still be in play with another pull up. Downside potential is favorable at the moment therefore I am looking for reversing signals


FORTINET #FTNTThe cybersecurity stock, #FORTINET gained an average of 6.1% in April the past five years. After descent move since 20th March, now it is correcting. #RSI is weak, seems double top is formed. Watch for supports and resistances

ACM Research $ACMR#ACMResearch is ready to break out. $30.09 is critical resistance to overcome and. #RSI is about break down trendline.

Digital Realty $DLRDigital Realty Trust is also closely tied to the cloud-computing phenomenon. The real estate company runs data centers. Given how many workers are telecommuting, demand for communications service is strong.
RSI is still weak and negative divergence now. It may pull back

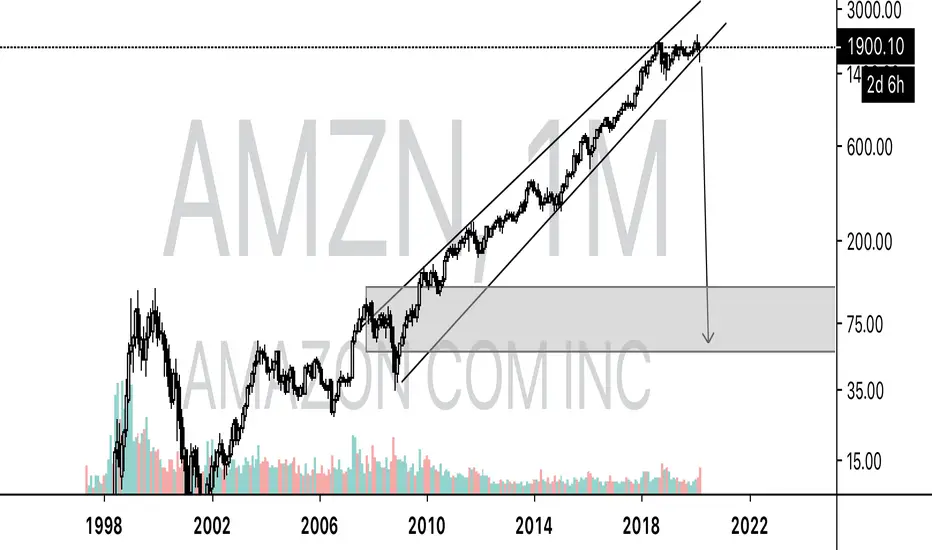
Doomsday awaitsThe company has made great strides rooting itself in the world for established territory but the energy is exhausted plus with the worlds current pandemic influencing the economic flow, Bezos has no choice but to sell more in order to innovate and keep the business afloat. More automation will be added to the company as a whole taking away the human element a great deal forcing them to pay more in taxes.
Be ready because demand is, and remember nothing goes straight up or straight down but this is meant for shorting
Be Safe
Johnson § Johnson $JNJJohnson § Johnson is one of the companies working on coronavirus treatments§vaccines. They need to develop one otherwise as technically monthly looks very ugly

Verizon Communications $VZRsi just broke and tested back the trendline. It is holding above weekly 200MA for second week. watch to break above $55.93

Nasdaq 100 | SLOWDOWN EXPECTED *Falling rate might slowdown but the stability of market takes least 5 months to make optimistic move.
*As 8000 level as a strong resistance,we can expect a short fall from here which might be slow based on upcoming stimulus.
*SL=8600 AND TP=6100.

Here is a buy setup in SLACK. $WORK (Short term trade)Strong probability of Slack to continue moving higher:
1. Technical indicators are bullish and rising,
2. Price is above the two moving averages and acts as support levels.
3. Corona Virus, people working from home and using Slack.


StoneCO $STNEAfter such a huge drop needs to correct upward. Double bottom and positive divergence on 2 hourly chart. needs break out $26.39


S&P500 $SPX$SPX seems very bullish. It needs to hold above the trend by the end of the months. If not, drop will continue till MA100 and MA200 support levels. If the chaos lasts, it may drop to the main trend.
