S&P 500 INTRADAY LEVELS FOR 18/03/2024BUY ABOVE - 5124
SL - 5113
TARGETS - 5131,5140,5150
SELL BELOW - 5113
SL - 5124
TARGETS - 5104,5091,5083
NO TRADE ZONE - 5113 to 5124
Previous Day High - 5131
Previous Day Low - 5104
Based on price action major support & resistance's are here, the red lines acts as resistances, the green lines acts as supports. If the price breaks the support/resistance, it will move to the next support/resistance line. White lines indicates previous day high & low, high acts as a resistance & low acts as a support for next day.
Trendlines are also significant to price action. If the price is above/below the trendlines, can expect an UP/DOWN with aggressive move.
Please NOTE: this levels are for intraday trading only.
Disclaimer - All information on this page is for educational purposes only,
we are not SEBI Registered, Please consult a SEBI registered financial advisor for your financial matters before investing And taking any decision. We are not responsible for any profit/loss you made.
Request your support and engagement by liking and commenting & follow to provide encouragement
HAPPY TRADING 👍
Usmarkets

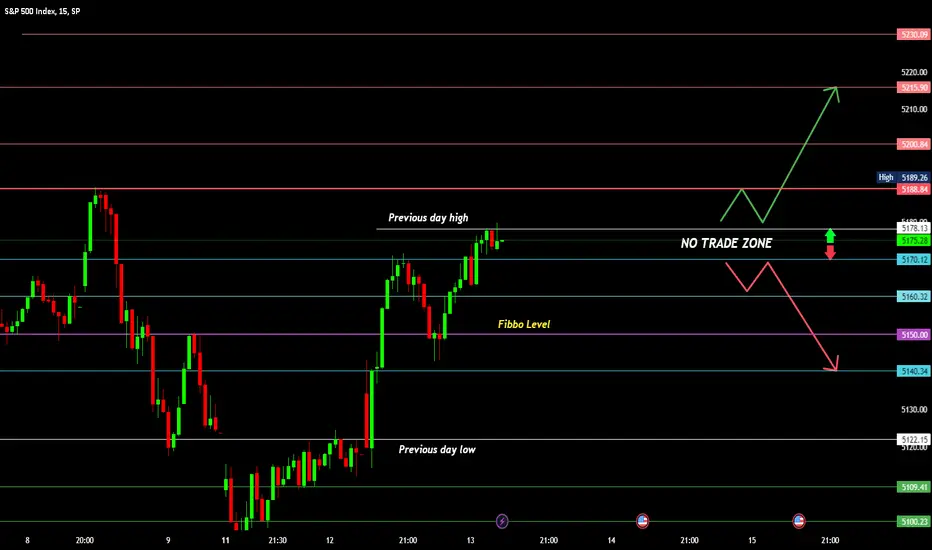
S&P 500 INTRADAY LEVELS FOR 15/03/2024BUY ABOVE - 5160
SL - 5150
TARGETS - 5170,5178,5188
SELL BELOW - 5140
SL - 5150
TARGETS - 5120,5109,5100
NO TRADE ZONE - 5140 to 5160
Previous Day High - 5178
Previous Day Low - 5122
Based on price action major support & resistance's are here, the red lines acts as resistances, the green lines acts as supports. If the price breaks the support/resistance, it will move to the next support/resistance line. White lines indicates previous day high & low, high acts as a resistance & low acts as a support for next day.
Trendlines are also significant to price action. If the price is above/below the trendlines, can expect an UP/DOWN with aggressive move.
Please NOTE: this levels are for intraday trading only.
Disclaimer - All information on this page is for educational purposes only,
we are not SEBI Registered, Please consult a SEBI registered financial advisor for your financial matters before investing And taking any decision. We are not responsible for any profit/loss you made.
Request your support and engagement by liking and commenting & follow to provide encouragement
HAPPY TRADING 👍

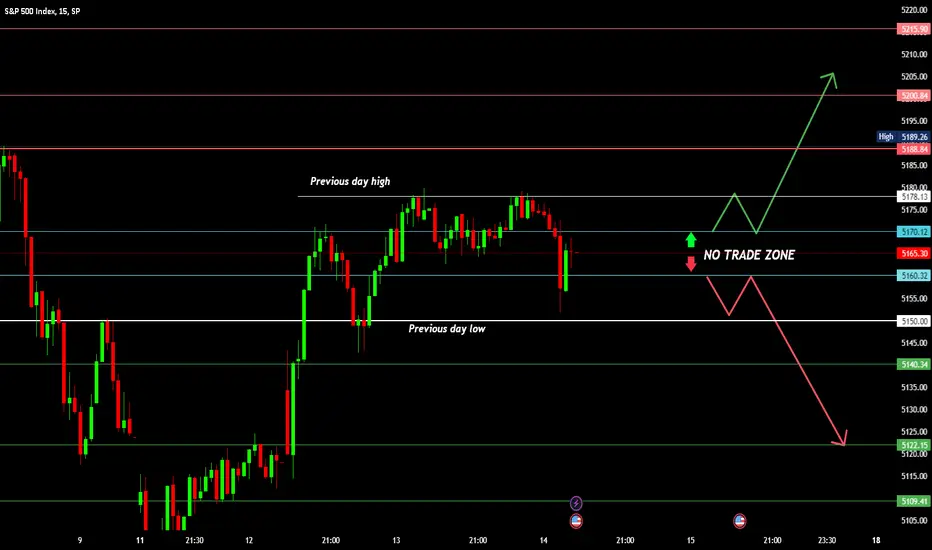
S&P 500 INTRADAY LEVELS FOR 14/03/2024BUY ABOVE - 5170
SL - 5160
TARGETS - 5178,5188,5200
SELL BELOW - 5160
SL - 5170
TARGETS - 5150,5140,5122
NO TRADE ZONE - 5150 to 5178
Previous Day High - 5178
Previous Day Low - 5150
Based on price action major support & resistance's are here, the red lines acts as resistances, the green lines acts as supports. If the price breaks the support/resistance, it will move to the next support/resistance line. White lines indicates previous day high & low, high acts as a resistance & low acts as a support for next day.
Trendlines are also significant to price action. If the price is above/below the trendlines, can expect an UP/DOWN with aggressive move.
Please NOTE: this levels are for intraday trading only.
Disclaimer - All information on this page is for educational purposes only,
we are not SEBI Registered, Please consult a SEBI registered financial advisor for your financial matters before investing And taking any decision. We are not responsible for any profit/loss you made.
Request your support and engagement by liking and commenting & follow to provide encouragement
HAPPY TRADING 👍
S&P 500 INTRADAY LEVELS FOR 13/03/2024BUY ABOVE - 5178
SL - 5170
TARGETS - 5188,5200,5215
SELL BELOW - 5170
SL - 5178
TARGETS - 5160,5150,5140
NO TRADE ZONE - 5170 to 5178
Previous Day High - 5178
Previous Day Low - 5122
Based on price action major support & resistance's are here, the red lines acts as resistances, the green lines acts as supports. If the price breaks the support/resistance, it will move to the next support/resistance line. White lines indicates previous day high & low, high acts as a resistance & low acts as a support for next day.
Trendlines are also significant to price action. If the price is above/below the trendlines, can expect an UP/DOWN with aggressive move.
Please NOTE: this levels are for intraday trading only.
Disclaimer - All information on this page is for educational purposes only,
we are not SEBI Registered, Please consult a SEBI registered financial advisor for your financial matters before investing And taking any decision. We are not responsible for any profit/loss you made.
Request your support and engagement by liking and commenting & follow to provide encouragement
HAPPY TRADING 👍
S&P 500 INTRADAY LEVELS FOR 12/03/2024BUY ABOVE - 5122
SL - 5109
TARGETS - 5128,5140,5150
SELL BELOW - 5109
SL - 5122
TARGETS - 5100,5091,5083
NO TRADE ZONE - 5109 to 5122
Previous Day High - 5122
Previous Day Low - 5091
Based on price action major support & resistance's are here, the red lines acts as resistances, the green lines acts as supports. If the price breaks the support/resistance, it will move to the next support/resistance line. White lines indicates previous day high & low, high acts as a resistance & low acts as a support for next day.
Trendlines are also significant to price action. If the price is above/below the trendlines, can expect an UP/DOWN with aggressive move.
Please NOTE: this levels are for intraday trading only.
Disclaimer - All information on this page is for educational purposes only,
we are not SEBI Registered, Please consult a SEBI registered financial advisor for your financial matters before investing And taking any decision. We are not responsible for any profit/loss you made.
Request your support and engagement by liking and commenting & follow to provide encouragement
HAPPY TRADING 👍

S&P 500 INTRADAY LEVELS FOR 11/03/2024BUY ABOVE - 5128
SL - 5118
TARGETS - 5140,5150,5160
SELL BELOW - 5118
SL - 5128
TARGETS - 5110,5100,5092
NO TRADE ZONE - 5092 to 5110
Previous Day High - 5188
Previous Day Low - 5118
Based on price action major support & resistance's are here, the red lines acts as resistances, the green lines acts as supports. If the price breaks the support/resistance, it will move to the next support/resistance line. White lines indicates previous day high & low, high acts as a resistance & low acts as a support for next day.
Trendlines are also significant to price action. If the price is above/below the trendlines, can expect an UP/DOWN with aggressive move.
Please NOTE: this levels are for intraday trading only.
Disclaimer - All information on this page is for educational purposes only,
we are not SEBI Registered, Please consult a SEBI registered financial advisor for your financial matters before investing And taking any decision. We are not responsible for any profit/loss you made.
Request your support and engagement by liking and commenting & follow to provide encouragement
HAPPY TRADING 👍

#SPX downside target Corrective move down to area that was a previous funnel zone
makes sense in my mind...
1st step
and then assess once we are there.

S&P 500 INTRADAY LEVELS FOR 07/03/2024BUY ABOVE - 5110
SL - 5100
TARGETS - 5118,5128,5140
SELL BELOW - 5092
SL - 5100
TARGETS - 5083,5077,5066
NO TRADE ZONE - 5092 to 5110
Previous Day High - 5128
Previous Day Low - 5092
Based on price action major support & resistance's are here, the red lines acts as resistances, the green lines acts as supports. If the price breaks the support/resistance, it will move to the next support/resistance line. White lines indicates previous day high & low, high acts as a resistance & low acts as a support for next day.
Trendlines are also significant to price action. If the price is above/below the trendlines, can expect an UP/DOWN with aggressive move.
Please NOTE: this levels are for intraday trading only.
Disclaimer - All information on this page is for educational purposes only,
we are not SEBI Registered, Please consult a SEBI registered financial advisor for your financial matters before investing And taking any decision. We are not responsible for any profit/loss you made.
Request your support and engagement by liking and commenting & follow to provide encouragement
HAPPY TRADING 👍

S&P 500 INTRADAY LEVELS FOR 06/03/2024BUY ABOVE - 5092
SL - 5083
TARGETS - 5100,5110,5120
SELL BELOW - 5077
SL - 5083
TARGETS - 5066,5057,5047
NO TRADE ZONE - 5130 to 5140
Previous Day High - 5110
Previous Day Low - 5057
Based on price action major support & resistance's are here, the red lines acts as resistances, the green lines acts as supports. If the price breaks the support/resistance, it will move to the next support/resistance line. White lines indicates previous day high & low, high acts as a resistance & low acts as a support for next day.
Trendlines are also significant to price action. If the price is above/below the trendlines, can expect an UP/DOWN with aggressive move.
Please NOTE: this levels are for intraday trading only.
Disclaimer - All information on this page is for educational purposes only,
we are not SEBI Registered, Please consult a SEBI registered financial advisor for your financial matters before investing And taking any decision. We are not responsible for any profit/loss you made.
Request your support and engagement by liking and commenting & follow to provide encouragement
HAPPY TRADING 👍

S&P 500 INTRADAY LEVELS FOR 05/03/2024BUY ABOVE - 5140
SL - 5130
TARGETS - 5150,5160,5170
SELL BELOW - 5130
SL - 5140
TARGETS - 5120,5110,5100
NO TRADE ZONE - 5130 to 5140
Previous Day High - 5150
Previous Day Low - 5130
Based on price action major support & resistance's are here, the red lines acts as resistances, the green lines acts as supports. If the price breaks the support/resistance, it will move to the next support/resistance line. White lines indicates previous day high & low, high acts as a resistance & low acts as a support for next day.
Trendlines are also significant to price action. If the price is above/below the trendlines, can expect an UP/DOWN with aggressive move.
Please NOTE: this levels are for intraday trading only.
Disclaimer - All information on this page is for educational purposes only,
we are not SEBI Registered, Please consult a SEBI registered financial advisor for your financial matters before investing And taking any decision. We are not responsible for any profit/loss you made.
Request your support and engagement by liking and commenting & follow to provide encouragement
HAPPY TRADING 👍

S&P 500 INTRADAY LEVELS FOR 04/03/2024BUY ABOVE - 5140
SL - 5132
TARGETS - 5150,5160,5170
SELL BELOW - 5132
SL - 5140
TARGETS - 5120,5110,5100
NO TRADE ZONE - 5132 to 5140
Previous Day High - 5140
Previous Day Low - 5094
Based on price action major support & resistance's are here, the red lines acts as resistances, the green lines acts as supports. If the price breaks the support/resistance, it will move to the next support/resistance line. White lines indicates previous day high & low, high acts as a resistance & low acts as a support for next day.
Trendlines are also significant to price action. If the price is above/below the trendlines, can expect an UP/DOWN with aggressive move.
Please NOTE: this levels are for intraday trading only.
Disclaimer - All information on this page is for educational purposes only,
we are not SEBI Registered, Please consult a SEBI registered financial advisor for your financial matters before investing And taking any decision. We are not responsible for any profit/loss you made.
Request your support and engagement by liking and commenting & follow to provide encouragement
HAPPY TRADING 👍

S&P 500 INTRADAY LEVELS FOR 01/03/2024BUY ABOVE - 5100
SL - 5094
TARGETS - 5110,5120,5135
SELL BELOW - 5088
SL - 5094
TARGETS - 5081,5076,5070
NO TRADE ZONE - 5088 to 5100
Previous Day High - 5100
Previous Day Low - 5062
Based on price action major support & resistance's are here, the red lines acts as resistances, the green lines acts as supports. If the price breaks the support/resistance, it will move to the next support/resistance line. White lines indicates previous day high & low, high acts as a resistance & low acts as a support for next day.
Trendlines are also significant to price action. If the price is above/below the trendlines, can expect an UP/DOWN with aggressive move.
Please NOTE: this levels are for intraday trading only.
Disclaimer - All information on this page is for educational purposes only,
we are not SEBI Registered, Please consult a SEBI registered financial advisor for your financial matters before investing And taking any decision. We are not responsible for any profit/loss you made.
Request your support and engagement by liking and commenting & follow to provide encouragement
HAPPY TRADING 👍

S&P 500 SYMMETRICAL TRIANGLE FOR INTRADAY 29/02/2024BUY ABOVE - 5076
SL - 5070
TARGETS - 5081,5088,5100
SELL BELOW - 5057
SL - 5062
TARGETS - 5047,5039,5032
NO TRADE ZONE - 5057 to 5076
Previous Day High - 5076
Previous Day Low - 5057
Based on price action major support & resistance's are here, the red lines acts as resistances, the green lines acts as supports. If the price breaks the support/resistance, it will move to the next support/resistance line. White lines indicates previous day high & low, high acts as a resistance & low acts as a support for next day.
Trendlines are also significant to price action. If the price is above/below the trendlines, can expect an UP/DOWN with aggressive move.
Please NOTE: this levels are for intraday trading only.
Disclaimer - All information on this page is for educational purposes only,
we are not SEBI Registered, Please consult a SEBI registered financial advisor for your financial matters before investing And taking any decision. We are not responsible for any profit/loss you made.
Request your support and engagement by liking and commenting & follow to provide encouragement
HAPPY TRADING 👍

S&P 500 INTRADAY LEVELS FOR 28/02/2024BUY ABOVE - 5081
SL - 5075
TARGETS - 5088,5100,5110
SELL BELOW - 5070
SL - 5081
TARGETS - 5057,5047,5039
NO TRADE ZONE - 5070 to 5081
Previous Day High - 5081
Previous Day Low - 5057
Based on price action major support & resistance's are here, the red lines acts as resistances, the green lines acts as supports. If the price breaks the support/resistance, it will move to the next support/resistance line. White lines indicates previous day high & low, high acts as a resistance & low acts as a support for next day.
Trendlines are also significant to price action. If the price is above/below the trendlines, can expect an UP/DOWN with aggressive move.
Please NOTE: this levels are for intraday trading only.
Disclaimer - All information on this page is for educational purposes only,
we are not SEBI Registered, Please consult a SEBI registered financial advisor for your financial matters before investing And taking any decision. We are not responsible for any profit/loss you made.
Request your support and engagement by liking and commenting & follow to provide encouragement
HAPPY TRADING 👍

S&P 500 INTRADAY LEVELS FOR 27/02/2024BUY ABOVE - 5088
SL - 5081
TARGETS - 5100,5110,5120
SELL BELOW - 5070
SL - 5081
TARGETS - 5057,5047,5039
NO TRADE ZONE - 5070 to 5088
Previous Day High - 5100
Previous Day Low - 5070
Based on price action major support & resistance's are here, the red lines acts as resistances, the green lines acts as supports. If the price breaks the support/resistance, it will move to the next support/resistance line. White lines indicates previous day high & low, high acts as a resistance & low acts as a support for next day.
Trendlines are also significant to price action. If the price is above/below the trendlines, can expect an UP/DOWN with aggressive move.
Please NOTE: this levels are for intraday trading only.
Disclaimer - All information on this page is for educational purposes only,
we are not SEBI Registered, Please consult a SEBI registered financial advisor for your financial matters before investing And taking any decision. We are not responsible for any profit/loss you made.
Request your support and engagement by liking and commenting & follow to provide encouragement
HAPPY TRADING 👍

S&P 500 INTRADAY SYMMETRICAL TRIANGLE FOR 26/02/2024BUY ABOVE - 5100
SL - 5088
TARGETS - 5110,5120,5135
SELL BELOW - 5081
SL - 5088
TARGETS - 5070,5057,5047
NO TRADE ZONE - 5081 to 5100
Previous Day High - 5110
Previous Day Low - 5081
Based on price action major support & resistance's are here, the red lines acts as resistances, the green lines acts as supports. If the price breaks the support/resistance, it will move to the next support/resistance line. White lines indicates previous day high & low, high acts as a resistance & low acts as a support for next day.
Trendlines are also significant to price action. If the price is above/below the trendlines, can expect an UP/DOWN with aggressive move.
Please NOTE: this levels are for intraday trading only.
Disclaimer - All information on this page is for educational purposes only,
we are not SEBI Registered, Please consult a SEBI registered financial advisor for your financial matters before investing And taking any decision. We are not responsible for any profit/loss you made.
Request your support and engagement by liking and commenting & follow to provide encouragement
HAPPY TRADING 👍

S&P 500 INTRADAY LEVELS FOR 23/02/2024BUY ABOVE - 5094
SL - 5079
TARGETS - 5108,5120,5135
SELL BELOW - 5079
SL - 5094
TARGETS - 5067,5057,5047
NO TRADE ZONE - 5079 to 5094
Previous Day High - 5094
Previous Day Low - 5039
Based on price action major support & resistance's are here, the red lines acts as resistances, the green lines acts as supports. If the price breaks the support/resistance, it will move to the next support/resistance line. White lines indicates previous day high & low, high acts as a resistance & low acts as a support for next day.
Trendlines are also significant to price action. If the price is above/below the trendlines, can expect an UP/DOWN with aggressive move.
Please NOTE: this levels are for intraday trading only.
Disclaimer - All information on this page is for educational purposes only,
we are not SEBI Registered, Please consult a SEBI registered financial advisor for your financial matters before investing And taking any decision. We are not responsible for any profit/loss you made.
Request your support and engagement by liking and commenting & follow to provide encouragement
HAPPY TRADING 👍

SPY bearish pitchfork analysisI drew these pitchfork lines before Oct. 15, 2023 when I posted my last SPY idea, titled "SPY: strong bullish pitchfork analysis" (see related idea below). At that time SPY was 427.48. Now it's 470.80. SPY reached the top pitchfork line that I drew back in Oct. 15 last year and is at this time expected to fall further.

S&P 500 INTRADAY LEVELS FOR 21/02/2024 BUY ABOVE - 4980
SL - 4968
TARGETS - 4992,5000,5008
SELL BELOW - 4968
SL - 4980
TARGETS - 4958,4948,4940
NO TRADE ZONE - 4968 to 4980
Previous Day High - 4992
Previous Day Low - 4958
Based on price action major support & resistance's are here, the red lines acts as resistances, the green lines acts as supports. If the price breaks the support/resistance, it will move to the next support/resistance line. White lines indicates previous day high & low, high acts as a resistance & low acts as a support for next day.
Trendlines are also significant to price action. If the price is above/below the trendlines, can expect an UP/DOWN with aggressive move.
Please NOTE: this levels are for intraday trading only.
Disclaimer - All information on this page is for educational purposes only,
we are not SEBI Registered, Please consult a SEBI registered financial advisor for your financial matters before investing And taking any decision. We are not responsible for any profit/loss you made.
Request your support and engagement by liking and commenting & follow to provide encouragement
HAPPY TRADING 👍

S&P500 INTRADAY LEVELS FOR 12/02/2024BUY ABOVE - 5030
SL - 5020
TARGETS - 5045,5060+
SELL BELOW - 5015
SL - 5020
TARGETS - 5008,5000,4992
NO TRADE ZONE - 5015 to 5030
Previous Day High - 5030
Previous Day Low - 5000
Based on price action major support & resistance's are here, the red lines acts as resistances, the green lines acts as supports. If the price breaks the support/resistance, it will move to the next support/resistance line. White lines indicates previous day high & low, high acts as a resistance & low acts as a support for next day.
Trendlines are also significant to price action. If the price is above/below the trendlines, can expect an UP/DOWN with aggressive move.
Please NOTE: this levels are for intraday trading only.
Disclaimer - All information on this page is for educational purposes only,
we are not SEBI Registered, Please consult a SEBI registered financial advisor for your financial matters before investing And taking any decision. We are not responsible for any profit/loss you made.
Request your support and engagement by liking and commenting & follow to provide encouragement
HAPPY TRADING 👍

S&P 500 - INTRADAY LEVELS 09/02/2024BUY ABOVE - 5000
SL - 4990
TARGETS - 5015,5030,5045
SELL BELOW - 4985
SL - 4995
TARGETS - 4975,4958,4940
NO TRADE ZONE - 4985 to 5000
Previous Day High - 5000
Previous Day Low - 4985
Based on price action major support & resistance's are here, the red lines acts as resistances, the green lines acts as supports. If the price breaks the support/resistance, it will move to the next support/resistance line. White lines indicates previous day high & low, high acts as a resistance & low acts as a support for next day.
Trendlines are also significant to price action. If the price is above/below the trendlines, can expect an UP/DOWN with aggressive move.
Please NOTE: this levels are for intraday trading only.
Disclaimer - All information on this page is for educational purposes only,
we are not SEBI Registered, Please consult a SEBI registered financial advisor for your financial matters before investing And taking any decision. We are not responsible for any profit/loss you made.
Request your support and engagement by liking and commenting & follow to provide encouragement
HAPPY TRADING 👍

S&P 500 Index Possible Forecast until Spring 2025...Risk Disclaimer: This is just a possible forecast that
could be wrong and there is No advice for any Trading!...

BEAR Attack on US IndexesAll major 4 indexes are now under the Red TrapZone and The First retrace back into the TrapZone will be Key to see IF we start trending back down or not.
Retrace is starting right about now!
