USO
UPDATE: Patience, support broken in USOIL min target $61.90Hi guys, thank you for the support! I will have this analysis out each weekend as well as daily updates throughout the week, if you guys like what I'm doing hit the "follow" button and you will get a notification each time I post a video or chart!
Have a great day everyone!
OPENING: USO JULY/OCT 10/13/13/16 DOUBLE DIAGONAL... for a .77/contract credit.
Truth be told, I kind of hate USO, with XOP being my go-to for petro-based plays. That being said, with its high implied volatility rank (65) and its decent background volatility (31%), I figured I'd throw a "can't hurt much" trade on here as a demo trade for a "safety tape" setup.
The basic notion of a "safety tape" trade is to define your risk with longer-dated, cheap throwaway longs, while trading essentially naked inside the longs. This is particularly useful in cash secured/small account environments where being naked invokes a buying power reduction equal to the short put strike minus the credit received and/or where brokers generally prohibit naked short calls, with the workaround being to buy a cheap long call anyway to define the theoretically infinite risk that a naked short call entails. Alternatively, it's a way for people who fear the notion of full on naked from a risk standpoint to get some of the benefits that trading naked entails (i.e., fewer legs, quicker vol crush and/or theta decay, easier rolls) without "hanging all their junk out there." (No one wants to see that).
Here, the buying power effect is attributable to the widest wing of the setup (3.00), minus the credit received (.77) or 2.23, far less than you'd tie up trading the naked short straddle cash secured (basically, $1200, since the July 20th 13 short straddle is trading for about a 1.00 here).
I'll look to take profit on the short straddle at 25% max as I would if I were just trading it purely naked, and then sell another ATM short straddle, reusing the longs as many times as I can before they expire ... .
WEEKEND REVIEW: USOIL dropping into $61.90 buying areaHi guys, thank you for the support! I will have this analysis out each weekend as well as daily updates throughout the week, if you guys like what I'm doing hit the "follow" button and you will get a notification each time I post a video or chart!
Have a great day everyone!
USO short term long callOil ETFs saw a sharp sell-off last week over concerns regarding Russia and Saudi Arabia. Given the support levels of the channel we have been trading in, I would like to see a bounce to the upside in the near future. Upcoming OPEC meeting on June 22 is a cause for caution in the energy sector, making volatility likely.
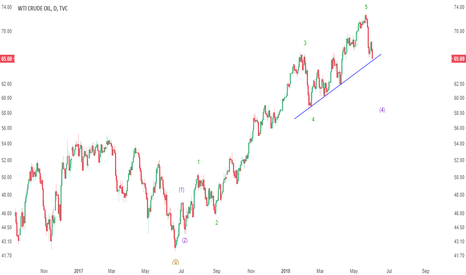
End-of-week crude analysisWell, contrary to my reading earlier, crude did not have a meaningful retracement, and they instead decided to send crude prices lower, finishing out the week at the low. Looking at the chart, the outlook on crude is downward. Notice how earlier in the week they pushed prices higher after hitting the 50% retracement from the low on 02/09 and the high on 03/25, but then sold it down after reaching the fib. level at 63.73. What's more, they closed the price under the 1.618 extension in the figure. My impression is that over the near-term crude may be sold down to the 2.618 extension level at 59.18, and possibly (though less likely) the 4.236 extension at 54.64. Downside resistance may come in around 61.31, 60.37, and 58.07. Cheers!
update on the Texas teaThis is an update on the bearish crude thesis running through April. I'm thinking here that we could continue the pattern of the past week where the price is run down into a partial extension and then brought back up by two fib level, only to sold down to the next fib. extension level. This would imply the price could be brought up to about 65.08, then sold down to about 60.32 later in the month. We'll see!


