This wavecount suggests one more leg up in the wedgeThis wave count suggest one more leg up to form an intermediate wave E before a larger price drop. In a primarily wave count (dark pink) I am open for the possibility the blue wedge being a wave A in a ABC correction.
Stay aware that price might as well break out at point (D) as we are moving pretty close to the wedge's apex now. If point D is broken I suggest closing any longs. Watch how price currently behaves around dotted blue trendline near point (D) on lower timeframe for clues of a potential breakout.
USO

Crude to 58-60Been holding the weekly 100 ema on multiple tests.
20 ema about to cross up 100 ema on weekly. Cloud is also bullish.

USO to breakout above US$11.50 amid potential breakout in crude As the crude oil price is still trending within the uptrend channel, we expect it is poise for a breakout towards the US$60-US$62 levels.


USO Ichimoku Buy SignalsOn the 1 day chart, price broke above the triangle pattern and is trying to cross above blue base line. The lagging line is also attempting to cross up over price. Last, the 50 DMA is trying to cross up over the 200 DMA. Thanks for viewing my chart. I'm new to charting/trading, so any corrections or help would be appreciated.

USOIL: My best analysis everOil looking very bullish
RSI is going down and nearing an interesting area where it bounced off in the past.
The green triangle is support area, we are looking to long there. The darker green area is most likely to hold. (if price breaks that this whole idea is invalid)
Fibonacci retracement 0.618 is at that area.
One resistance line is broken and acts now as support, the one above will be broken and price may bounce off that again.
Entry: 49.10
Stoploss: 37.30
Target: 61.60

Long term Bearish SPX, Correlation Analysis showing Positive ( green boxes) negative (red Boxes) and Mixed ( yellow and orange Boxes) prediction for 2017. Expecting to See some sharp fall in prices in July, Based on Gann Cycles.


Going long. to go or not to go?I have been recently watching United States Oil Fund's 6 months, 1y and 5y chart and they all say the same thing. go long. any thoughts?

USO - Support around 10.90Looking for USO to strengthen around 10.90 where 50, 100 and 200 ma confluence exists. Also trendline support.

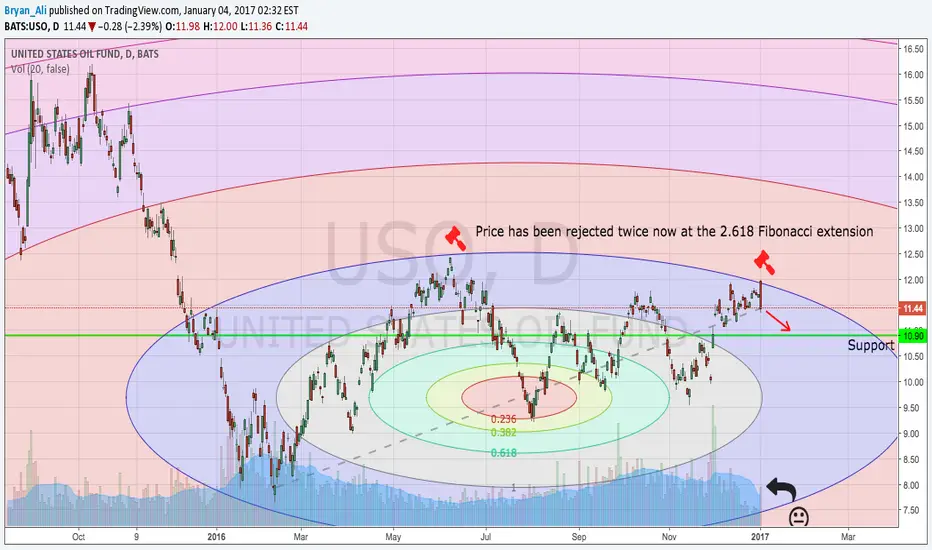
Price Action is Accelerating UpwardsThe angle of the current pitchfork channel (Modified Schiff) that prices are moving within is larger in magnitude than the angle of the longer-dated, broad pitchfork channel. That may imply that price action is accelerating to the upside. Keep in mind, for this assumption to remain valid, the channels must stay intact.
I have overlaid a Fibonacci Circle study, as well, since it appears to mark significant price movements.

Uptrend Intact Despite False BreakoutPrice has recovered considerably since being rejected at resistance on January 3rd. The current trading channel remains valid, as well. I am looking for a retest of resistance on price in addition to the new resistance trend lines on RSI and ROC. Of note, the MACD is turning positive, too.

USO Breakout Rejected at Resistance Trend Line- Indicators BleakPrice briefly pierced resistance, although, this was promptly rejected during the US regular session hours. Concerning indicators, the RSI uptrend appears to be broken to the downside- same with the ROC uptrend. Concurrently, the MACD just turned negative. My short-term price targets are $10.90 and then $10.50.

Fibonacci Circles: Price Rejected at 2.618 Extension, AgainThe USO trading price has been rejected (on large volume) for a second time now at the 2.618 Fib extension- with the first rejection occurring in June of 2016. Next area of support is around $10.90.
Watch oil collapse within a couple of yearsCurrently trading the upwards correction to 60-70. Then I am afraid we are going to see oil collapse in price..

RSI comparison across SPY GLD USO TLTCapital flows can be inferred from a comparison of SPY GLD USO TLT in terms of relative RSI's

Ascending triangle in wave B on weekly chart nearing break outOPEC reached an agreement in the weekend, which should imply a price move upwards. Still though my current wave count suggest another move downwards to point E of the ascending triangle in the corrective wave B of one larger degree. Further we should get a bigger corrective wave C up to around 60, which is the end of wave 4 where most corrections tend to end.
Comments are welcome:)

Oil WedgeLong term wedge has been violated where the arrows are showing it's weakness
Watching that smaller wedge we are in right now

USO Short Term LongWe saw a gap down on the open today. Regardless, buyers were still willing to come in and drive the price higher. I think this is a good opportunity to squeeze out the people who got short positions in early on what appears to be a top forming.
Be prepared for a gap up on the next open. In which case, I still wouldn't be afraid to open a position up. Looking to get long once the MACD crosses upwards. My stop will happen if the MACD crosses back downwards.
I would look for a target price of around 11.90 - 12.00. I would not be looking to hold this for more than a few days.

USO Medium Top Forming (Update 12/06/2016)Medium term traders shouldn't be shorting this yet. We still have positive momentum on the MACD. Also, I think it's a bad sign to see buyers willing to come in and drive the price higher after a gap down today. I think this still needs more time before heading down.

USO Medium Term Top Forming Update (12/05/2016)A top appears to be forming on USO but medium term traders should not short yet. Looking at the MACD we still see positive momentum going on. It is safer to wait until we start seeing the MACD cross towards the downside before we look to short this.


Transitioning to Risk-OFF Inflationary EnvironmentWe are about to transition from a risk-ON inflationary environment to a risk-OFF inflationary environment. That means bond yields might fall even though inflation is rising. The US has been a huge beneficiary of the risk-ON move and as a result should see outflows. That means lower equities, and a weaker dollar. Given a falling dollar, rising inflation, and risk-OFF environment, it doesn't seem unreasonable to think that GOLD could do quite well. US treasury bonds should outperform HYG and EMB. Oil is the wild card. Higher or even flat oil prices will be much higher than they were last year. The YoY inflation effects if OPEC can stabilize the oil market above $50 for the next two months would really feed into inflation. Higher inflation would hurt the US consumer and business margins applying further downward pressure on risk assets. But I am getting ahead of myself. The risk-ON rally is likely over, and it's time to expect a risk-OFF rising inflation environment.
