Opening (IRA): USO April 19th 66 Monied Covered Call... for a 64.51 debit.
Comments: IV of 32.3%.
Selling the -75 call against a one lot of stock to emulate a 25 delta short put with built-in short call defense.
Metrics:
Cost Basis in Stock/Break Even/BPE: 64.51/share
Max Profit: 1.49
ROC at Max: 2.31%
ROC at 50% max: 1.15%
USO

Natural Gas Price Forecast | DXY Crude Oil Silver GoldNatural Gas Price Forecast | DXY Crude Oil Silver Gold
0:00 Natural Gas stock Bulls NatGas Support & Resistance Guide
05:29 AMEX:UNG Stock Forecast
06:37 USO Oil Stock Forecast
09:18 DXY US dollar Stock Forecast
11:08 Gold XAUUSD Stock Forecast
12:30 Silver XAGUSD


Natural Gas Price Forecast | DXY Crude Oil XAUUSD XAGUSDNatural Gas Price Forecast | DXY Crude Oil XAUUSD XAGUSD
00:00 Natural Gas stock Bulls NatGas Support & Resistance Guide
04:55 AMEX:UNG Stock Forecast
07:08 USO Oil Stock Forecast
09:20 DXY US dollar Stock Forecast
10:54 Gold XAUUSD Stock Forecast
12:28 Silver XAGUSD

$USO to 50day SMA, POUNCE ON PUTS AT THE GAP FILLRefer to a previous post. Breakdown has begun but I suspect a gap fill before a follow through. POUNCE on the gap fill for a swing $70 3/15 Puts High.
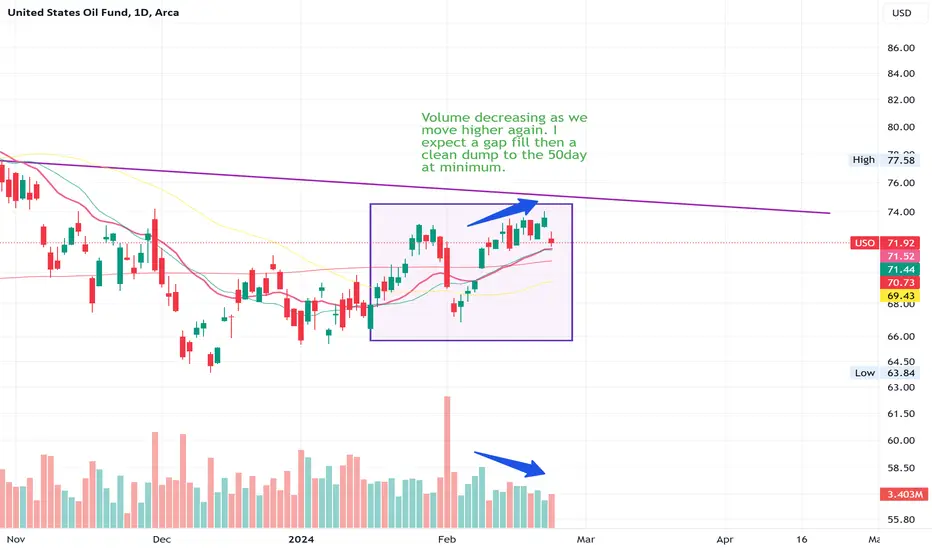
$USO back to 50 day at minimum AMEX:USO Headed back to the 50 day. Really quick. Will continue watching to see if we hold $69s or break lows. I'm expecting the pullback to resume after a quick stall at the 20day sma. The giveaway that helped pay last time was the rally above the death cross. That first rally is usually bearish as noted in the chart posted. Fast forward and we have the same setup today. Good luck out there.

Natural Gas Price Forecast | DXY Oil XAUUSD XAGUSDNatural Gas Price Forecast | DXY Oil XAUUSD XAGUSD
00:00 Natural Gas stock Bulls NatGas Support & Resistance Guide
04:12 AMEX:UNG Stock Forecast
08:53 USO Oil Stock Forecast
10:55 DXY US dollar Stock Forecast
12:31 Gold XAUUSD Stock Forecast
13:42 Silver XAGUSD

Natural Gas Price Forecast | DXY Oil XAUUSD XAGUSD00:00 Natural Gas stock Bulls NatGas Support & Resistance Guide
05:34 AMEX:UNG Stock Forecast
08:29 USO Oil Stock Forecast
10:24 DXY US dollar Stock Forecast
11:56 Gold XAUUSD Stock Forecast
12:52 Silver XAGUSD
#naturalgas #natgas #xagusd #dxy #xauusd #naturalgastechnicalanalysis #technicalanalysis #tradingstrategy #daytrading #naturalgasanalysis #naturalgastrading #natgasanalysis #uso #crudeoil

Natural Gas Price Forecast | DXY Oil Gold XAGUS00:00 Natural Gas stock Bulls NatGas Support & Resistance Guide
06:06 AMEX:UNG Stock Forecast
08:47 USO Oil Stock Forecast
10:14 DXY US dollar Stock Forecast
11:38 Gold XAUUSD Stock Forecast
12:29 Silver XAGUSD

Natural Gas Price Forecast | DXY Oil XAGUS Gold00:00 Natural Gas stock Bulls NatGas Support & Resistance Guide
06:02 AMEX:UNG Stock Forecast
07:57 USO Oil Stock Forecast
10:11 DXY US dollar Stock Forecast
11:07 Gold XAUUSD Stock Forecast
12:31 Silver XAGUSD
#naturalgas #natgas #xagusd #dxy #xauusd #naturalgastechnicalanalysis #technicalanalysis #tradingstrategy #daytrading #naturalgasanalysis #naturalgastrading #natgasanalysis #uso #crudeoil

DXY USO XAGUSD Gold Natural Gas Price Forecast - BIG MOVE soon.#naturalgas #natgas #xagusd #dxy #xauusd #naturalgastechnicalanalysis #technicalanalysis #tradingstrategy #daytrading #naturalgasanalysis #naturalgastrading #natgasanalysis #uso #crudeoil
00:00 Natural Gas stock Bulls NatGas Support & Resistance Guide
03:05 AMEX:UNG Stock Forecast
04:10 USO Oil Stock Forecast
05:38 DXY US dollar Stock Forecast
07:49 Gold XAUUSD Stock Forecast
09:11 Silver XAGUSD

Natural Gas DXY Oil Gold Silver Price Forecast00:00 Natural Gas stock Bulls NatGas Support & Resistance Guide
04:14 AMEX:UNG Stock Forecast
05:45 USO Oil Stock Forecast
07:25 DXY US dollar Stock Forecast
08:09 Gold XAUUSD Stock Forecast
08:53 Silver XAGUSD

USO ( Oil Futures ETF) Swing Trade Review LONGThe idea was that while US Oil is not directly affected by the tensions in the Middle East as
most of it is domestic consumption, what portion of it that is exported does not go through the
Suez Canal but rather across the Pacific to Asia mostly. The idea was expanded by no matter
that, the Middle East quagmire affects global oil prices all intertwined. The China recession
is a drag on oil prices as is Russian sales below market but no matter the shipping costs have
gone up and so also the price of what is being shipped.
The 30-minute chart shows the trades based on the premise of a volume profile with the
evolving high volume area between the blue lines and price simply a black line. As the price is
supported by the lower black line and resisted by the upper black line and the price is expected
to rise, the trade plan was to "buy low" when the price dropped to the lower black line with
two lots of shares. When the price rose to the upper black line sell one of those lots and run the
other to gradually acquire more shares and average up. A high-volume area breakout 3 days
ago was also used as a buy signal.
As of the present, the trade is carrying five lots of 10 shares each. Profit has been pulled out
in partials each time a lot has been sold at a red down arrow. The trade close signal will be
from the RSI indicator when the fast RSI line in green goes under the slower red RSI line.
Upon closure, the profits will be redeployed by shorting USO using a similar strategy: short
selling at the top of the high volume area two lots of shares and buying to cover one lot at the
bottom of the high-volume area. Although this trade is a slow-moving swing trade used for
disciplined and deliberate trading, it is very low risk with moderate profit and for the most
part is risk-free because the entry points are relatively precise especially if using a shorter
time frame than the 30 minutes here.

Natural Gas DXY, Oil Gold Silver Price Forecast - Natural Gas Natgas Stock 4h uptrend confirmed
#naturalgas #natgas #xagusd #dxy #xauusd #naturalgastechnicalanalysis #technicalanalysis #tradingstrategy #daytrading #naturalgasanalysis #naturalgastrading #natgasanalysis #uso #crudeoil
00:00 Natural Gas stock Bulls NatGas Support & Resistance Guide
05:05 AMEX:UNG Stock Forecast
05:58 USO Oil Stock Forecast
07:14 DXY US dollar Stock Forecast
09:09 Gold XAUUSD Stock Forecast
09:56 Silver XAGUSD

Natural Gas DXY Gold Silver Oil Price Forecast00:00 Natural Gas stock Bulls NatGas Support & Resistance Guide
03:43 AMEX:UNG Stock Forecast
04:16 USO Oil Stock Forecast
05:13 DXY US dollar Stock Forecast
06:16 Gold XAUUSD Stock Forecast
07:03 Silver XAGUSD

Natural Gas DXY Gold Silver OIL Price Forecast- Natural Gas Natgas Stock daily uptrend confirmed
#naturalgas #natgas #xagusd #dxy #xauusd #naturalgastechnicalanalysis #technicalanalysis #tradingstrategy #daytrading #naturalgasanalysis #naturalgastrading #natgasanalysis #uso #crudeoil
00:00 Natural Gas stock Bulls NatGas Support & Resistance Guide
03:53 AMEX:UNG Stock Forecast
05:37 USO Oil Stock Forecast
07:10 DXY US dollar Stock Forecast
09:19 Gold XAUUSD Stock Forecast
10:55 Silver XAGUSD

$USO looks like a great shortJust like everyone think GOLD is going higher, people are overly bullish oil because of the war, blah blah, *insert your fundamental bias here.*
The reality is, the chart looks like shit. Price just rallied directly into resistance and has now formed a lower high confirming resistance at $79.
The price of oil is going much lower from here.
I wouldn't touch this from the long side until we get into the green support levels.
Good luck to all of the people bullish oil here because it won't turn out well for you.

Natural Gas DXY Gold Silver OIL Price ForecastWelcome to the everyday how to make money online trading with Natural Gas Technical Analysis show, where I give you guys support & resistance levels to potentially play off of. As well as both sides perspective of a bear and a bull to give us a better understanding of where our trades are currently and not have a bias
- Natural Gas weekly bear flag
#naturalgas #natgas #xagusd #dxy #xauusd #naturalgastechnicalanalysis #technicalanalysis #tradingstrategy #daytrading #naturalgasanalysis #naturalgastrading #natgasanalysis #uso #crudeoil
00:00 Natural Gas stock Bulls NatGas Support & Resistance Guide
04:55 AMEX:UNG Stock Forecast
06:22 USO Oil Stock Forecast
07:52 DXY US dollar Stock Forecast
10:52 Gold XAUUSD Stock Forecast
13:37 Silver XAGUSD

Natural Gas Price ForecastWelcome to the everyday how to make money online trading with Natural Gas Technical Analysis show, where I give you guys support & resistance levels to potentially play off of. As well as both sides perspective of a bear and a bull to give us a better understanding of where our trades are currently and not have a bias
- Natural Gas Natgas Stock daily uptrend confirmed
#naturalgas #natgas #xagusd #dxy #xauusd #naturalgastechnicalanalysis #technicalanalysis #tradingstrategy #daytrading #naturalgasanalysis #naturalgastrading #natgasanalysis #uso #crudeoil
00:00 Natural Gas stock Bulls NatGas Support & Resistance Guide
04:24 AMEX:UNG Stock Forecast
05:42 USO Oil Stock Forecast
07:38 DXY US dollar Stock Forecast
10:52 Gold XAUUSD Stock Forecast
12:46 Silver XAGUSD

OIL IS VERY BULLISH WAVE E ENDED The chart posted is that of WTI . even in a bearish alt oil will see back to 80 The cycles model is in the bottom phase and is set to turn up for the rally into first 90 days . bearish for SP 500

OIH wave 4 of 5 of 5 wave structure The chart posted in the OIH tracking etf We should be seeing the last of the selloff today and see a rally back to 333 within 2 to 4.5 weeks and then see a drop and pullback from .786 to a minor new low from this point I would be looking for a 95 PLUs pt up move to above ALL the tops and then A panic of DEFLATION back to a .618 from the 2020 panic low I am now 100 % long uso amd oih and have orders just below today prints to margin 7 % and up to 15 % long I am also in options for the june and july calls as sometimes the futures see a print in pre market and options we have to wait for 9.30 am BEST OF trades Wavetimer the final peak should near march 20/april 2 2024

Natural Gas OIL Gold DXY Silver Price Forecast00:00 Natural Gas stock Bulls NatGas Support & Resistance Guide
07:33 AMEX:UNG Stock Forecast
10:41 USO Oil Stock Forecast
12:53 Gold XAUUSD Stock Forecast
15:33 DXY US dollar Stock Forecast
17:02 Silver XAGUSD

OIH Bottomed at .618 I have now moved to a 100 % long The chart is that of OIH etf we have now dropped into the 17 week turn and have reached .618 pullback .I would now look to be look calls and a target min 333 with the odds of a print at or above 375
