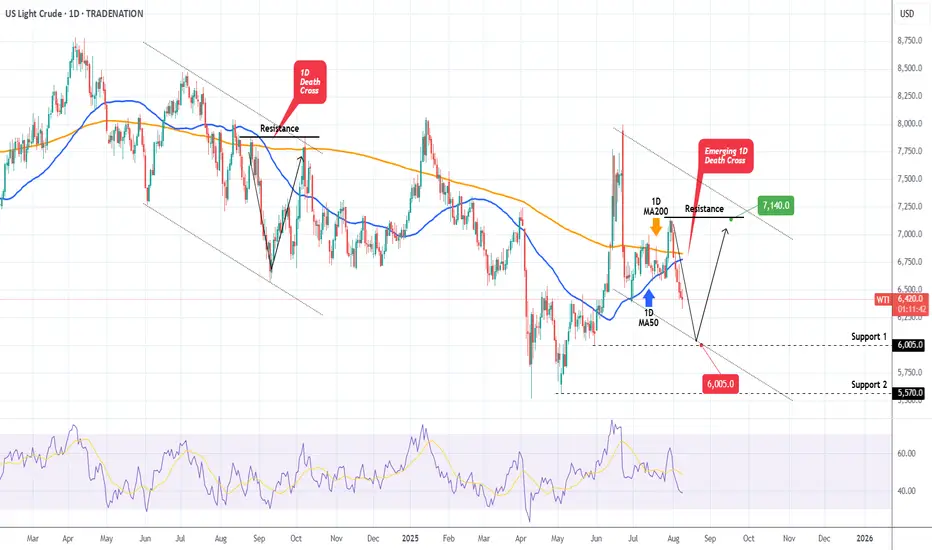
WTI OIL on its first 1D Death Cross since Sep 2024!WTI Oil (USOIL) is on the decline and is about to form a 1D Death Cross for the first time since September 06 2024! That is technically a bearish signal but last time once completed, the market formed a bottom 2 days later.
As a result, we expect a max drop to Support 1 ($60.05) but then more likely a rebound back to the Resistance ($71.40), especially given the fact that the 1D RSI will almost get oversold (>30.00).
-------------------------------------------------------------------------------
** Please LIKE 👍, FOLLOW ✅, SHARE 🙌 and COMMENT ✍ if you enjoy this idea! Also share your ideas and charts in the comments section below! This is best way to keep it relevant, support us, keep the content here free and allow the idea to reach as many people as possible. **
-------------------------------------------------------------------------------
Disclosure: I am part of Trade Nation's Influencer program and receive a monthly fee for using their TradingView charts in my analysis.
💸💸💸💸💸💸
👇 👇 👇 👇 👇 👇
Crude Oil WTI
WTI Crude Oil Analysis – Is a Major Wave 3 About to Begin?🛢 WTI Crude Oil Analysis – Is a Major Wave 3 About to Begin? 🚀
According to Elliott Wave count, it appears that the corrective Wave 2 has either completed or is in its final stages. The (ABC) corrective structure, combined with reactions to key Fibonacci levels, suggests a potential end to the correction and the start of a powerful Wave 3.
Key Fibonacci Support Levels:
📍 $60.39 – 50% retracement
📍 $58.84 – 78.6% retracement
As long as price holds above these levels, the bullish structure remains intact, with the ultimate target for Wave 3 projected well above the previous all-time highs.
💬 What’s your view? Is crude oil ready for a historic move, or is there still room for more correction?
✅ Save this idea & follow for future updates.
-------------------------------------------------------------------------------------------------------------------
🚀 Who am I?
I'm Mahdi, a prop firm trader with 7+ years of experience in technical analysis, mainly focusing on Smart Money Concepts and Elliott Wave theory.
I specialize in delivering high-quality trading signals, market insights, and educational content tailored for serious traders and investors.
📊 My Tools: SMC, Elliott Wave, Fibonacci, Liquidity Grabs, Order Blocks
💼 Prop Challenge Passed: Yes | Funded Account: In Progress
🔗 Follow for consistent updates and trading insights.

USOIL Sellers In Panic! BUY!
My dear subscribers,
USOIL looks like it will make a good move, and here are the details:
The market is trading on 63.34 pivot level.
Bias - Bullish
My Stop Loss - 63.05
Technical Indicators: Both Super Trend & Pivot HL indicate a highly probable Bullish continuation.
Target - 63.89
About Used Indicators:
The average true range (ATR) plays an important role in 'Supertrend' as the indicator uses ATR to calculate its value. The ATR indicator signals the degree of price volatility.
Disclosure: I am part of Trade Nation's Influencer program and receive a monthly fee for using their TradingView charts in my analysis.
———————————
WISH YOU ALL LUCK

USOIL BEST PLACE TO BUY FROM|LONG
USOIL SIGNAL
Trade Direction: long
Entry Level: 63.31
Target Level: 68.69
Stop Loss: 59.72
RISK PROFILE
Risk level: medium
Suggested risk: 1%
Timeframe: 1D
Disclosure: I am part of Trade Nation's Influencer program and receive a monthly fee for using their TradingView charts in my analysis.
✅LIKE AND COMMENT MY IDEAS✅
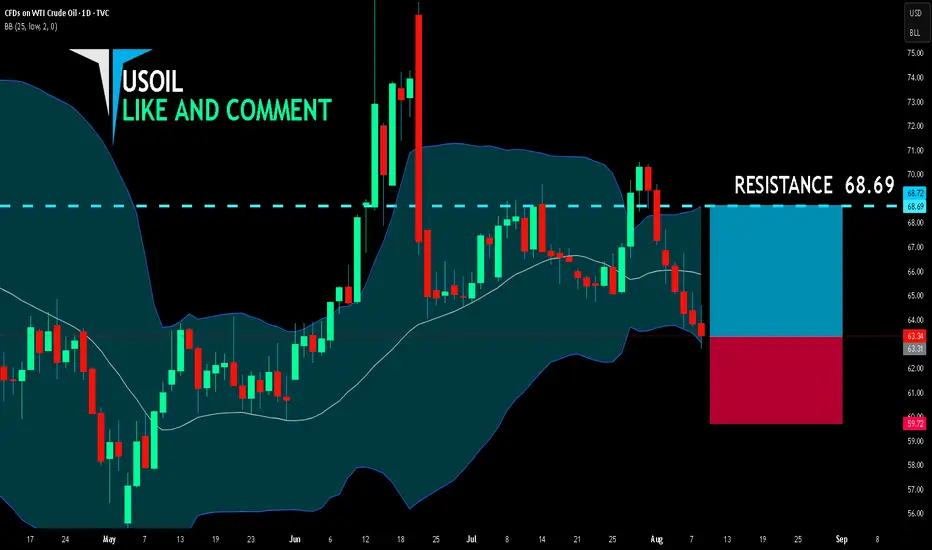
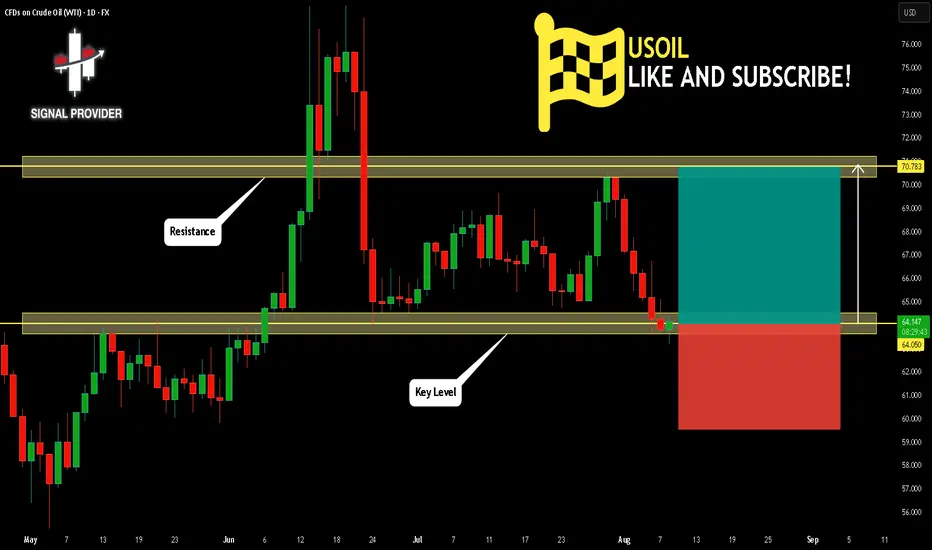
USOIL Is Going Up! Buy!
Take a look at our analysis for USOIL.
Time Frame: 1D
Current Trend: Bullish
Sentiment: Oversold (based on 7-period RSI)
Forecast: Bullish
The market is approaching a key horizontal level 64.050.
Considering the today's price action, probabilities will be high to see a movement to 70.783.
P.S
Please, note that an oversold/overbought condition can last for a long time, and therefore being oversold/overbought doesn't mean a price rally will come soon, or at all.
Disclosure: I am part of Trade Nation's Influencer program and receive a monthly fee for using their TradingView charts in my analysis.
Like and subscribe and comment my ideas if you enjoy them!
USOIL: The Market Is Looking Up! Long!
My dear friends,
Today we will analyse USOIL together☺️
The market is at an inflection zone and price has now reached an area around 63.337 where previous reversals or breakouts have occurred.And a price reaction that we are seeing on multiple timeframes here could signal the next move up so we can enter on confirmation, and target the next key level of 63.685.Stop-loss is recommended beyond the inflection zone.
❤️Sending you lots of Love and Hugs❤️

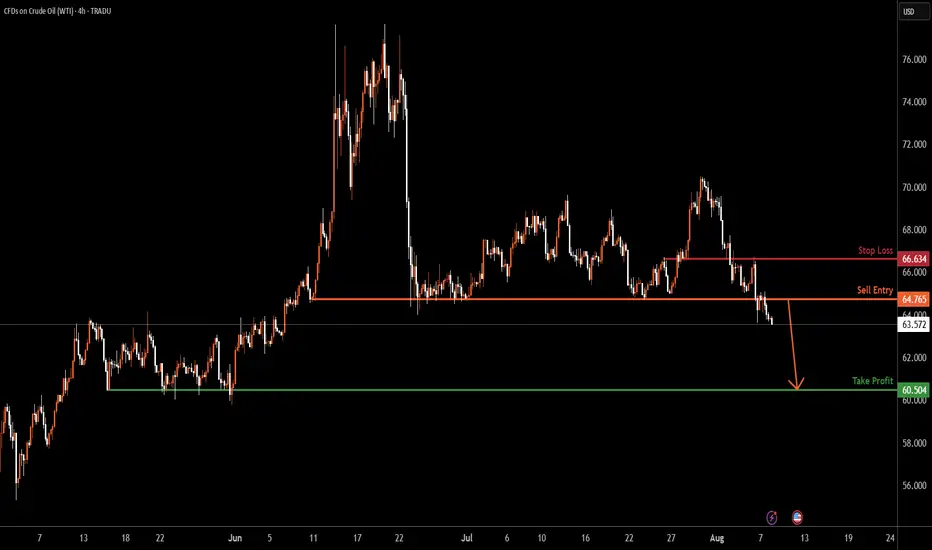
USOIL H4 | Potential bearish dropUSOIL has rejected the sell entry which has been identified as a pullback resistance and could drop from this level to the downside.
Sell entry is at 64.76, which is a pullback resistance.
Stop loss is at 66.63, which is an overlap resistance.
Take profit is at 60.50, which is a multi-swing low support.
High Risk Investment Warning
Trading Forex/CFDs on margin carries a high level of risk and may not be suitable for all investors. Leverage can work against you.
Stratos Markets Limited (tradu.com ):
CFDs are complex instruments and come with a high risk of losing money rapidly due to leverage. 65% of retail investor accounts lose money when trading CFDs with this provider. You should consider whether you understand how CFDs work and whether you can afford to take the high risk of losing your money.
Stratos Europe Ltd (tradu.com ):
CFDs are complex instruments and come with a high risk of losing money rapidly due to leverage. 66% of retail investor accounts lose money when trading CFDs with this provider. You should consider whether you understand how CFDs work and whether you can afford to take the high risk of losing your money.
Stratos Global LLC (tradu.com ):
Losses can exceed deposits.
Please be advised that the information presented on TradingView is provided to Tradu (‘Company’, ‘we’) by a third-party provider (‘TFA Global Pte Ltd’). Please be reminded that you are solely responsible for the trading decisions on your account. There is a very high degree of risk involved in trading. Any information and/or content is intended entirely for research, educational and informational purposes only and does not constitute investment or consultation advice or investment strategy. The information is not tailored to the investment needs of any specific person and therefore does not involve a consideration of any of the investment objectives, financial situation or needs of any viewer that may receive it. Kindly also note that past performance is not a reliable indicator of future results. Actual results may differ materially from those anticipated in forward-looking or past performance statements. We assume no liability as to the accuracy or completeness of any of the information and/or content provided herein and the Company cannot be held responsible for any omission, mistake nor for any loss or damage including without limitation to any loss of profit which may arise from reliance on any information supplied by TFA Global Pte Ltd.
The speaker(s) is neither an employee, agent nor representative of Tradu and is therefore acting independently. The opinions given are their own, constitute general market commentary, and do not constitute the opinion or advice of Tradu or any form of personal or investment advice. Tradu neither endorses nor guarantees offerings of third-party speakers, nor is Tradu responsible for the content, veracity or opinions of third-party speakers, presenters or participants.
Is oil price heading back up? Watching a potential inverse head and shoulders forming on the 30-minute chart for Oil.
🔹 Risk/Reward: 2.7
🔹 Entry: 63.290
🔹 Stop Loss: 63.043
🔹 Take Profit 1 (50%): 63.93
🔹 Take Profit 2 (50%): 64.21
A couple of key factors still need to align before I pull the trigger:
• One will confirm around 14:45 SAST (GMT+2)
• Looking for lower volume on the right shoulder compared to the left
What do you think? Is oil ready to push higher?
Drop your thoughts or how you trade inverse head and shoulders below! 👇

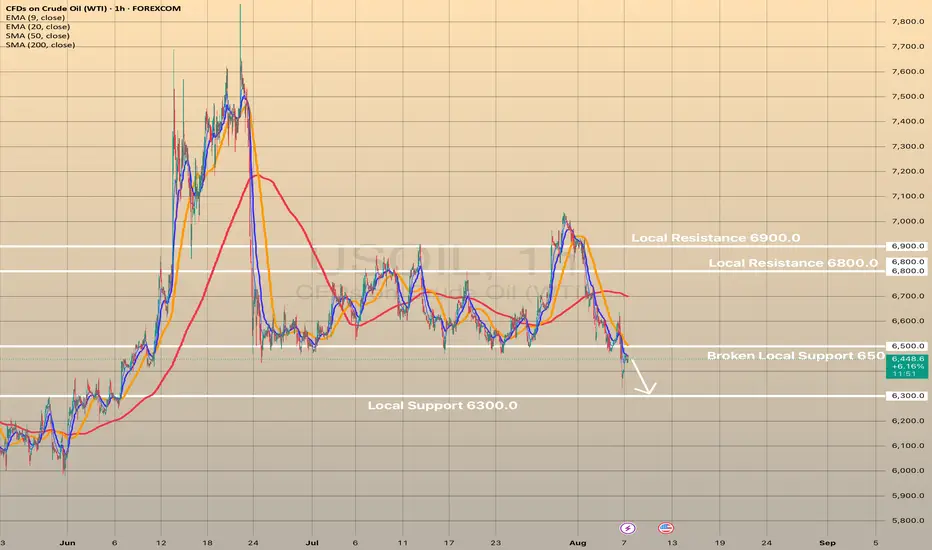
Oil continues to decline due to geopolitics optimismOil continues to decline due to geopolitics optimism
A Kremlin official announced that Presidents Trump and Putin will hold a summit soon, their first since 2021, with a White House source suggesting it could occur as early as next week. Optimism surrounding potential U.S.-Russia discussions on the Ukraine conflict has alleviated concerns about oil supply disruptions, despite U.S. sanctions targeting India for its continued Russian crude imports. Trump introduced a 25% tariff on Indian goods and signaled possible additional tariffs on China. However, increased OPEC production and ongoing trade tensions remain key concerns, raising fears of slower economic growth and reduced demand.
Technically, USOIL trades just above the 6,300.00 support level. Insignificant rebound from this level is expected with possible decline towards crucial 6,000.00 support level.

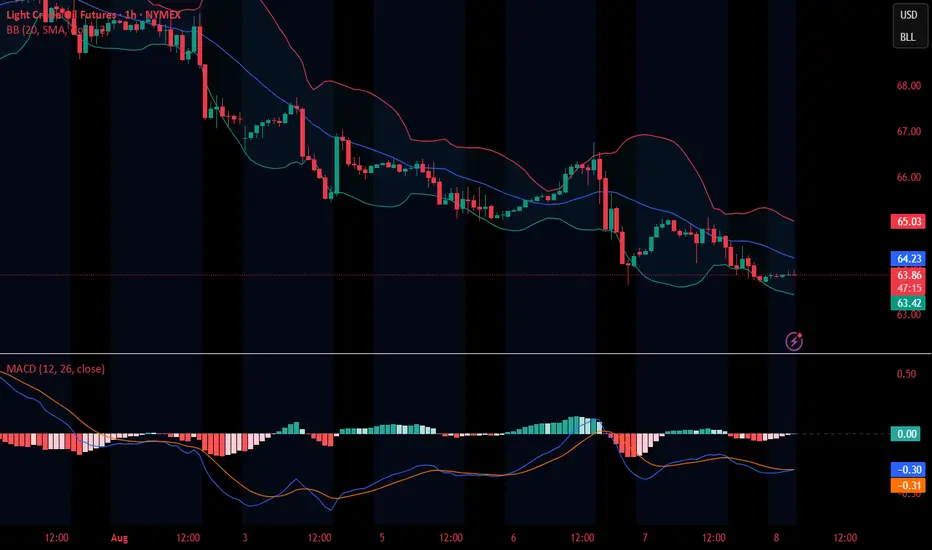
WTI(20250808)Today's AnalysisMarket News:
① Trump nominated Stephen Milan, Chairman of the White House Council of Economic Advisers, to serve on the Federal Reserve Board, with a term ending January 31, 2026.
② Waller is reportedly a leading candidate for the next Fed Chair.
③ U.S. Treasury Secretary Bensont stated that the interview process for the Fed Chair has begun.
④ Bostic stated that the July jobs report did change the Fed's outlook on its employment goals.
Technical Analysis:
Today's Buy/Sell Levels:
63.55
Support and Resistance Levels:
64.86
64.37
64.06
63.05
62.73
62.24
Trading Strategy:
If the price breaks above 63.55, consider entering a buy position, with the first target price being 64.06.
If the price breaks below 63.05, consider entering a sell position, with the first target price being 62.73.
WTI: Oil Markets on Edge Despite Trump Considering Major TariffsOil prices could drop if Trump backs down on tariffs on countries buying Russian oil, but short-term bullish catalysts, like geopolitical tensions and bullish speculative bets, may still push prices up before longer-term headwinds take hold.
----------------------------------------------------------------------------------------------------------------------
Trump’s threats of steep tariffs on countries buying Russian oil have sent oil prices surging, as traders fear a global supply crunch if Russian barrels are cut off.
But here’s the twist: Trump has a history of backing down or delaying tariffs after using them as leverage. When he does, oil prices usually fall, as the immediate risk of supply disruption fades.
If he caves in again by the deadline, which is 10 to 12 days from 4 August, or extends it, oil prices could drop. The bigger picture also appears bearish: OPEC+ is ramping up supply, global demand is slowing and expected to drop in H2, and inventories are rising (first glimpse by EIA, Wed).
But with the deadline falling around 14–16 August, 2025, short-term bullish catalysts could spark a rally up to the 38.2%-61.8 % Fibonacci retracement levels, positioning WTI better for declines (conditional on Trump!).
This content is not directed to residents of the EU or UK. Any opinions, news, research, analyses, prices or other information contained on this website is provided as general market commentary and does not constitute investment advice. ThinkMarkets will not accept liability for any loss or damage including, without limitation, to any loss of profit which may arise directly or indirectly from use of or reliance on such information.

CRUDE OIL BEARISH BREAKOUT|SHORT|
✅CRUDE OIL is going down currently
As the price broke the key structure level of 64.00$
Which is now a resistance, and has made a pullback
And the retest, so I think the price will keep going down now
SHORT🔥
✅Like and subscribe to never miss a new idea!✅

TP REACHEDOur 2nd trade of the day closed with profits.
We choose to close our trade right before it reached the main TP due to one reason, a pullback on a Liquidity lvl we have at 64.178 (5min chart).
It was a great day!
See you tomorrow!
Follow for more!

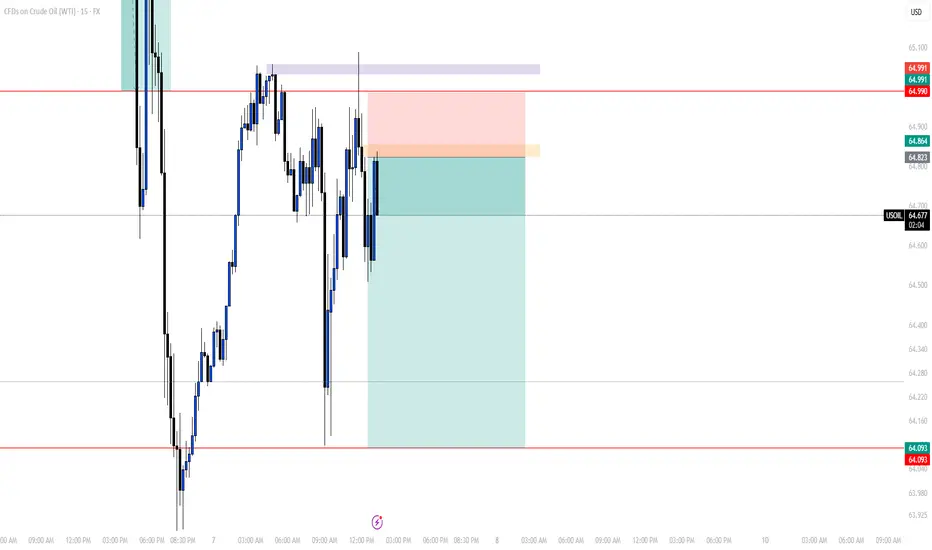
SELL USOILOur 2nd trade if the day on USOIL is a short one again since the price kept grabbing BSL to continue pushing lower and lower.
You can sell and follow the same levels as mine
Follow for more!
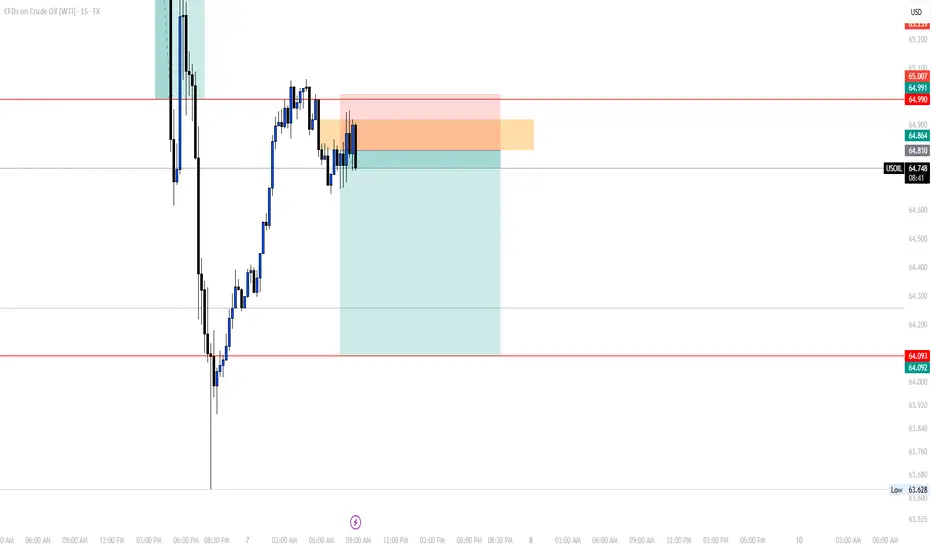
UPDATE ON THIS MORNING'S TRADEEarly in the morning, I posted a trade (Sell USOIL) in which we trargeted the LQ level which the market came closer to and didn't touch, which isn't a big deal.
As you can see on the chart, as I told my students during the LIVE TRADING SESSION they assisted, it's all about trade management.
On the screenshot on the left, we added another order at 50% lvl of the FVG, xhich the market respected at that moment before giving us a double bottom which is a sign to the change of the movement of the market.
For a safe closure of the trade, as you can see in the picture on the left, we waited for the market to break through the 5min LQ we have to close, and that's what exactly happened.
We'll wait for another trade to take later in the US session.
Follow for more!

Hellena | Oil (4H): SHORT to support area of 61.937 (Fibo lvl).Hello, colleagues!
Well, I think that the previous scenario is still relevant and the “ABC” correction is developing according to the scenario.
At the moment, I see a five-wave structure in the downward wave “C”. I expect a small correction to the area of 67.287, then a continuation of the downward movement to the area between 61.8% and 100% of the levels of Fibonacci extension - the support area of 61.937.
Manage your capital correctly and competently! Only enter trades based on reliable patterns!

SELL USOILThis morning we're going short again on OIL, since as you can see the price grabbed the LQ and gave us a proper rntry point we entered based on 1h ago.
Follow for more!
USOIL declines on possibility of geopolitical stabilityUSOIL declines on possibility of geopolitical stability
Crude oil and gasoline prices fell August 6 after an early rally, as Trump announced "great progress" in U.S.-Russia talks to end the Ukraine war, reducing fears of new sanctions on Russian energy exports. Additionally, OPEC+’s planned 547,000 bpd production increase for September further pressured prices amid concerns of a global oil supply glut.
Technically, USOIL broke crucial local support at 6,500.00. Currently, the price is retesting this level. The decline towards 6,300.00 is expected in short-term.
OUR TRADE FOR THE DAYEarly today, I posted that we'll be waiting for the market to give us an entry after grabbing the liquidity, we did have it and caught it.
I didn't share it since it was given to my students.
As you can see on the chart, the market gave us a FVG after that it did grab the liquidity which we entered based on to target again the LQ level to close with a good margin.
Follow for more!
RBOB from $2.08 to $1.23Crude is in a downtrend and therefore so is RBOB and any other crude products. "Drill baby drill" as he says :/
Good luck!

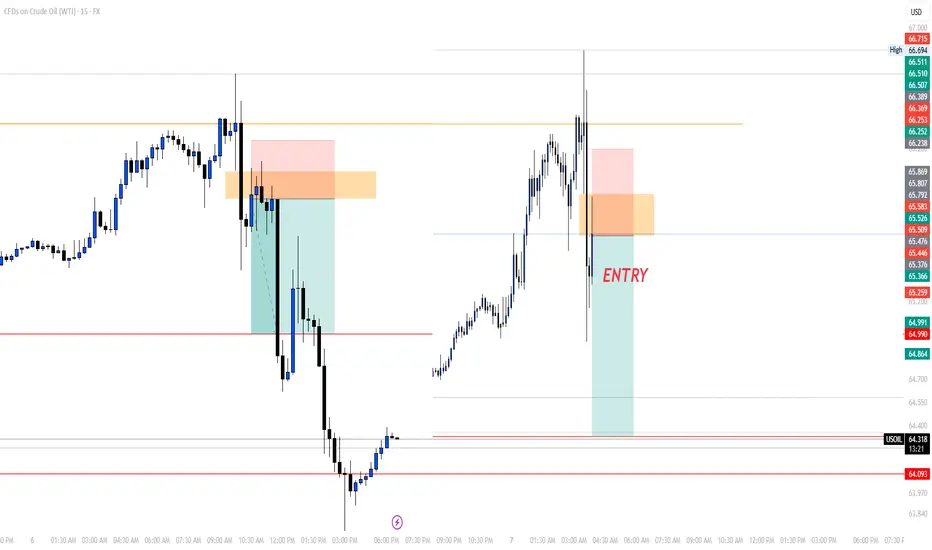
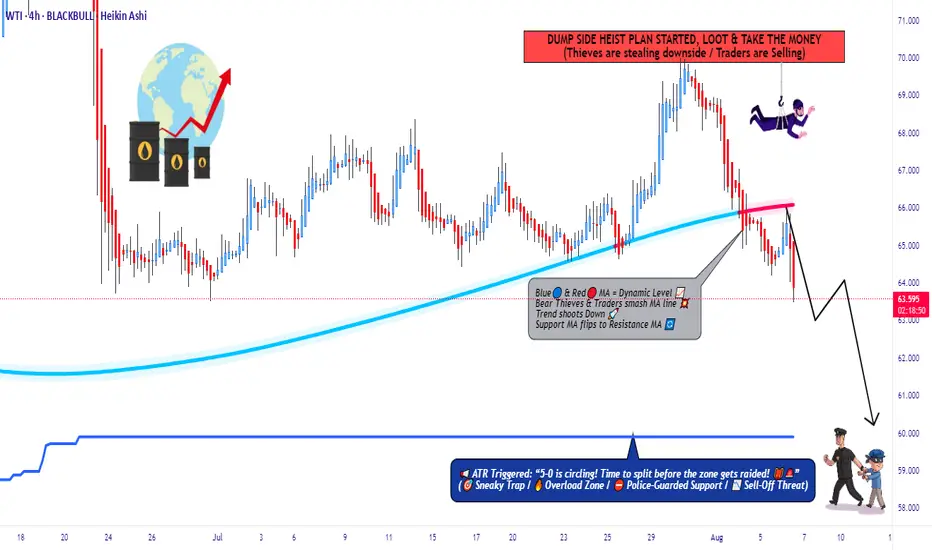
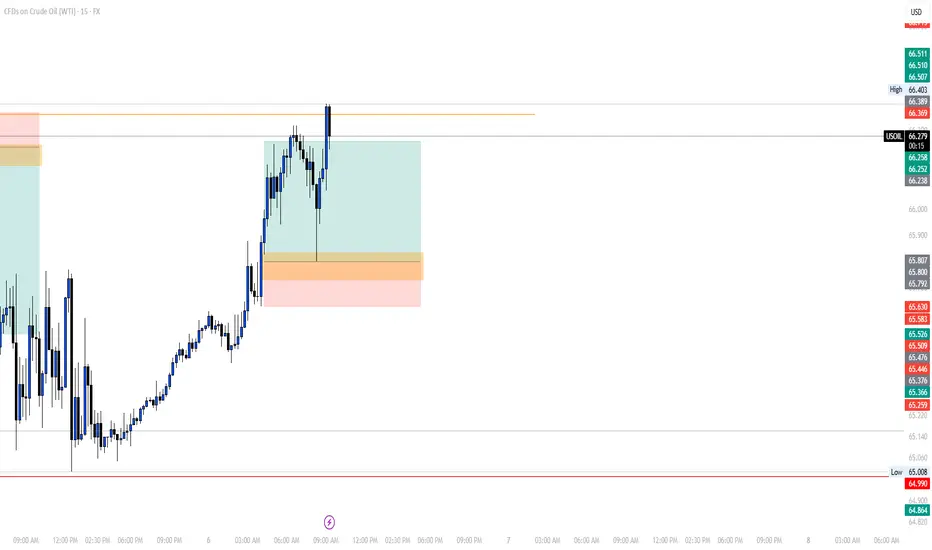
WTI Under Attack – Rob the Market with This Bear Setup🛢️💣 WTI Oil Short Raid: Bearish Heist Activated! 💣🛢️
📉 Thief Trader’s Limit-Layered Attack Plan 🔐
💥 Attention Market Robbers & Chart Breakers! 💥
We're about to break into the XTIUSD / US Oil Spot vault — Bearish style.
🚨 The Setup:
This ain’t your average breakout — we’re talking high-precision, multi-layered entries on a downside raid.
🧠 Thief Trader Strategy: Drop limit orders at key zones like trip wires. Let price walk into your trap.
🎯 Plan:
🧱 Entry: Any level after MA resistance confirmation.
Layer multiple limit orders — DCA-style — after trend shows weakness.
🛑 Stop Loss: 66.300 🔒
Protect your vault. Place SL just above major 4H rejection zone.
🎯 Target: 60.000 💰
Profit at exhaustion level. This is where bulls cry, and we cash out.
🧠 Robbery Logic Backed By:
COT Data 📊
Crude Oil Inventories 🛢️
Macro + Sentiment Flows 🌐
Technical MA Break + Retest Patterns 🎯
🔥 Why this isn’t a random short?
Because thieves do research — not guesswork.
Bulls have overextended. Oil’s price is reacting to strong supply pressure and weakening demand outlook.
⚠️ Risk Note:
No entry without trend confirmation.
No blind shots — place alerts and wait for the setup.
This is a sniper job, not a shotgun spray.
💬 Join the Robbery Crew
Smash that ❤️ & Boost if you're riding with the thieves!
Drop your charts, entries, or sniper shots in the comments 💬
We rob together. We win together.
🔔 Follow for more heist plans – next market break-in coming soon.
💰 Rob Smart. Trade Sharp. Exit Clean. 🏴☠️
TRADE CANCELEDThis morning I posted to take a long trade and we canceled it since the price didn't come to our entry point which is a normal thing to happen, now after that it took the daily LQ, we'll be waiting for the price to give us a sort entry to take.
Follow for more!
Crude Oil: Equilibrium, Key Levels & Trade ScenariosNYMEX:CL1! NYMEX:MCL1!
Market Recap
In our prior crude oil commentary, we identified a bullish flag formation with key support anchored at the Q3 micro composite Value Area Low. Following a measured pullback, prices decisively reclaimed the Q3 micro composite Value Area High, subsequently advancing toward the $70 level. However, this upward momentum proved unsustainable, with prices unable to maintain higher ground. We have since retraced to the yearly open, where the market is now consolidating.
Current Market Structure
Crude oil is presently exhibiting a balanced profile. Notably, the composite Volume Points of Control (VPOC) for both the yearly and quarterly profiles are overlapping — a technical signal indicative of equilibrium in positioning.
Market Performance Assessment
Price action in recent sessions has been heavily influenced by shifts in the global demand outlook, which in turn remain sensitive to macroeconomic expectations, geopolitical events, and OPEC+ V8 members’ gradual unwinding of voluntary production cuts. Despite the prevailing headwinds — including tariff disputes, Russian sanctions, and broader trade tensions — crude oil has demonstrated resilience, consistently trading above the $65 threshold.
Forward Outlook
Attention will turn to today’s EIA release at 9:30 a.m. CT, which may serve as the primary catalyst for near-term directional bias.
Key Technical Levels
• Q3 mCVAH: 67.28
• Neutral Zone: 66.45 – 66.30
• Yearly Open: 66.34
• Intermediate Support: 65.80
• CVPOC / mCVPOC: 65.54
• Q3 mCVAL: 64.95
• Support Zone: 65.00 – 64.80
Trading Scenarios
• Scenario 1 — Yearly Open Rejection
Monitor the Yearly Open (66.34) as an initial resistance level. A rejection here could prompt a tactical pullback toward the Line in the Sand (LIS), offering long entry opportunities with a target above the yearly open.
• Scenario 2 — DOE-Driven Flush & Recovery
Should the DOE data trigger a downside push, watch for a swing failure at recent lows. A close back above prior levels would present a potential long setup, with conviction increasing on sustained price action above 65.80.
