Oil Prices Surge Amid Threat of Strike on IranOil Prices Surge Amid Threat of Strike on Iran
As shown on today’s XBR/USD chart, Brent crude oil prices have jumped (as indicated by the arrow) to a one-week high. This surge follows U.S. intelligence reports suggesting that Israel may be preparing to strike Iran’s nuclear facilities.
Although CNN, citing officials, noted that it remains unclear whether Israeli leaders have made a final decision, oil prices are rising as markets price in the risk of escalation disrupting Middle Eastern oil supply chains:
→ Iran is the third-largest oil producer within OPEC.
→ There is concern that Iran could retaliate by blocking the Strait of Hormuz in the Persian Gulf — a key shipping route used by Saudi Arabia, Kuwait, and others to export oil products.
Technical Analysis of XBR/USD
Brent crude oil price has climbed towards the descending trendline (marked in black), drawn through key highs from April and mid-May. From a bearish perspective, this key resistance could trigger a downward pullback.
On the other hand, recent price action in Brent suggests upward momentum (indicated by blue lines), with the $65.20 level — previously a cap — potentially turning into support after a breakout.
Whether the black resistance line is broken will largely depend on geopolitical developments. It is possible that reports of an imminent missile strike on Iran may later be refuted.
This article represents the opinion of the Companies operating under the FXOpen brand only. It is not to be construed as an offer, solicitation, or recommendation with respect to products and services provided by the Companies operating under the FXOpen brand, nor is it to be considered financial advice.
Crude Oil WTI

WTI Oil H4 | Overlap support at 38.2% Fibonacci retracementWTI oil (USOIL) is falling towards an overlap support and could potentially bounce off this level to climb higher.
Buy entry is at 60.44 which is an overlap support that aligns with the 38.2% Fibonacci retracement.
Stop loss is at 57.60 which is a level that lies underneath a swing-low support and the 61.8% Fibonacci retracement.
Take profit is at 63.68 which is a multi-swing-high resistance.
High Risk Investment Warning
Trading Forex/CFDs on margin carries a high level of risk and may not be suitable for all investors. Leverage can work against you.
Stratos Markets Limited (tradu.com/uk):
CFDs are complex instruments and come with a high risk of losing money rapidly due to leverage. 63% of retail investor accounts lose money when trading CFDs with this provider. You should consider whether you understand how CFDs work and whether you can afford to take the high risk of losing your money.
Stratos Europe Ltd (tradu.com/eu):
CFDs are complex instruments and come with a high risk of losing money rapidly due to leverage. 63% of retail investor accounts lose money when trading CFDs with this provider. You should consider whether you understand how CFDs work and whether you can afford to take the high risk of losing your money.
Stratos Global LLC (tradu.com/en):
Losses can exceed deposits.
Please be advised that the information presented on TradingView is provided to Tradu (‘Company’, ‘we’) by a third-party provider (‘TFA Global Pte Ltd’). Please be reminded that you are solely responsible for the trading decisions on your account. There is a very high degree of risk involved in trading. Any information and/or content is intended entirely for research, educational and informational purposes only and does not constitute investment or consultation advice or investment strategy. The information is not tailored to the investment needs of any specific person and therefore does not involve a consideration of any of the investment objectives, financial situation or needs of any viewer that may receive it. Kindly also note that past performance is not a reliable indicator of future results. Actual results may differ materially from those anticipated in forward-looking or past performance statements. We assume no liability as to the accuracy or completeness of any of the information and/or content provided herein and the Company cannot be held responsible for any omission, mistake nor for any loss or damage including without limitation to any loss of profit which may arise from reliance on any information supplied by TFA Global Pte Ltd.
The speaker(s) is neither an employee, agent nor representative of Tradu and is therefore acting independently. The opinions given are their own, constitute general market commentary, and do not constitute the opinion or advice of Tradu or any form of personal or investment advice. Tradu neither endorses nor guarantees offerings of third-party speakers, nor is Tradu responsible for the content, veracity or opinions of third-party speakers, presenters or participants.

Crude Oil (WTI/USD) Short SetupInternational oil prices have been supported by the temporary easing of trade tensions and buying sentiment attracted by a double bottom. However, the upside for oil prices remains limited, mainly due to the impact of Trump's uncertain tariff policies on the economy and the OPEC+ strategy of maintaining production increases. In the forward view, attention should be paid to the progress of the Iran Nuclear Agreement and Russia-Ukraine negotiations. If the agreements are reached, pressure on the oil supply side will continue to increase. During the summer oil consumption peak season, the incremental oil demand in major consuming countries may be affected by factors such as the bleak prospects of economic recovery and the substitution of new energy, keeping oil prices under pressure. On the daily chart, crude oil closed with a small bullish candle, with the high price breaking above the previous high and the low price not breaking below the previous low, forming an breakout pattern. Crude oil has shown upward momentum after consecutive oscillations, and key attention should be paid to whether the resistance level at 63.6 is broken.
Trading Strategy:
sell@62.5-63.0
TP:61.0-61.5
In the market, there are no absolutes, and neither upward nor downward trends are set in stone. Therefore, the ability to judge the balance between market gains and losses is your key to success. Let money become our loyal servant.

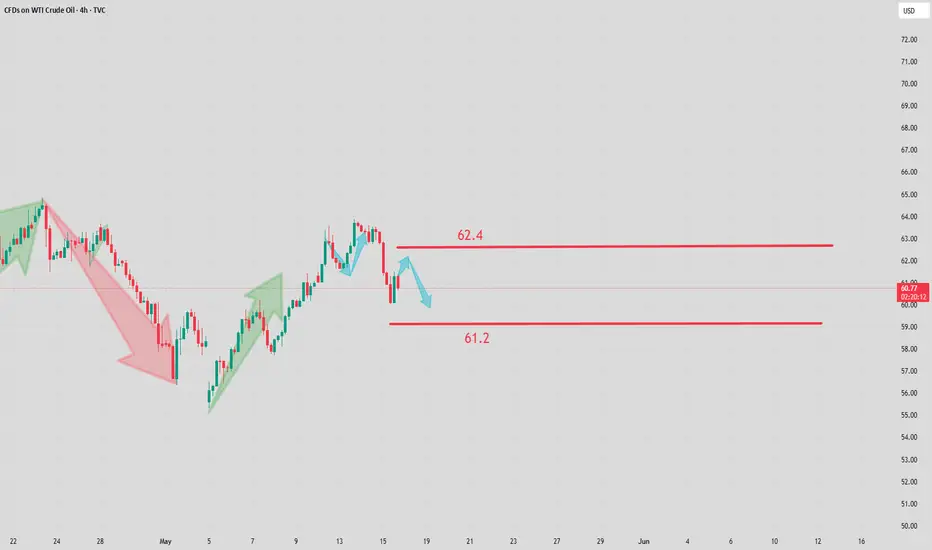
Crude oil: 63.00 resistance & 60.00 support keyPrices are currently testing the upper resistance at $63.00 📈. These levels are suppressing the price 🔻. A decisive breakthrough above this level may trigger a more intense upward rally 🔥. Meanwhile, recent selling pressure has pushed the price down to $60.60 📉. Watch the pivot support at $60.00, the real downward target 🎯
Crude oil surplus expanded in April, and imports increased, reaching multi - month highs from some countries 🌍. If global benchmark oil prices rise in the future, purchases may be reduced 📉.
Crude oil fell first and then rose today 📊. After a deep dive to $60.9, it stabilized and started to rise 🔼. After the previous price increase and adjustment, it remains to be seen if the upward momentum will continue and break through upwards 🔍.
Overall, on the delivery day, oil prices are volatile 🔼🔽. Watch the resistance at $63.0 on the upside and the support at $60.60 - $60.0 on the downside 👀.
⚡️⚡️⚡️ USOil ⚡️⚡️⚡️
🚀 Sell@ 62.50 - 62.30
🚀 TP 61.50 - 60.60
Accurate signals are updated every day 📈 If you encounter any problems during trading, these signals can serve as your reliable guide 🧭 Feel free to refer to them! I sincerely hope they'll be of great help to you 🌟 👇

WTI OIL 1H Channel Up make or break Targets.WTI Oil (USOIL) has been trading within a Channel Up on the 1H time-frame that is supported by the 1H MA200 (orange trend-line). As long as this holds, we expect another +2.50% Bullish Leg (at least), which gives a Target of $63.55.
If the price breaks below the 1H MA200 though, we will take this small loss on the long and go short instead, targeting Support 1 at $60.60.
-------------------------------------------------------------------------------
** Please LIKE 👍, FOLLOW ✅, SHARE 🙌 and COMMENT ✍ if you enjoy this idea! Also share your ideas and charts in the comments section below! This is best way to keep it relevant, support us, keep the content here free and allow the idea to reach as many people as possible. **
-------------------------------------------------------------------------------
Disclosure: I am part of Trade Nation's Influencer program and receive a monthly fee for using their TradingView charts in my analysis.
💸💸💸💸💸💸
👇 👇 👇 👇 👇 👇

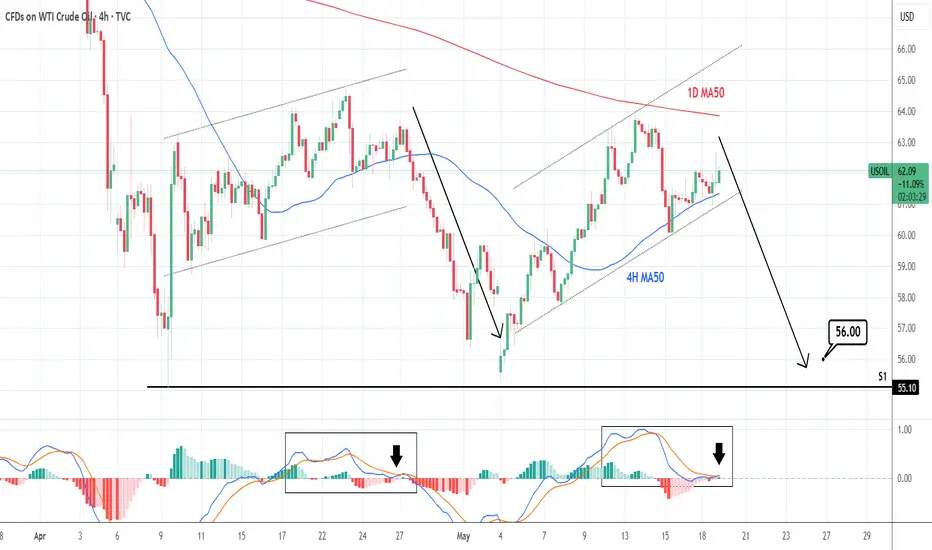
WTI CRUDE OIL: Mirror pattern calls for a sell.WTI Crude Oil is neutral on its 1D technical outlook (RSI = 50.222, MACD = -0.370, ADX = 25.154) as the price is just under the 1D MA50, where it got rejected last Tuesday. In the meantime, it has the support of the 4H MA50, hence stuck inside a neutral range. This pattern is however identical to April, after which the price declined aggressively to the S1 level. Sell, TP = 56.00.
See how our prior idea has worked out:
## If you like our free content follow our profile to get more daily ideas. ##
## Comments and likes are greatly appreciated. ##
The main strategy is to go long on pullbacksDuring the Asian trading session on Monday, Brent crude fell slightly by $0.05 to $65.15 per barrel; WTI crude was quoted at $61.76, while the more actively traded July contract dropped $0.04 to $61.93. Both benchmark oil prices recorded weekly gains of over 1% last week, mainly boosted by the easing of global trade sentiment. The market will closely monitor data to be released soon by a major Asian economy, including April industrial added value, fixed asset investment, and retail sales. ANZ Bank noted in a report that weak data from the major Asian economy could undermine the optimism brought by the tariff suspension, thereby pressing down oil prices.👉👉👉
The K-line closed as a yang line with a long lower shadow, indicating strong bullish momentum from buyers. The moving average system is gradually arranging in a bullish formation, relying on the oil price, and the short-term objective trend direction has turned upward. It is expected that the intraday crude oil trend will continue to rise, reaching near 63. Overall, in terms of crude oil trading strategies, it is recommended to focus on buying low on pullbacks and supplement with selling high on rebounds. In the short term, pay attention to the resistance at the 63.0-63.5 level above, and the support at the 61.0-60.5 level below.
Oil trading strategy:
buy @ 61.00-61.50
sl 60.00
tp 62.30-62.80
If you think the analysis helpful, you can give a thumbs-up to show your support. If you have different opinions, you can leave your thoughts in the comments. Thank you for reading!👉👉👉

WILL CRUDE OIL HOLD BULLISH PRESSURE!?NY Session
LONG entry
Retest and Bounce of POi (61.700) psychological level
5-15min break of previous structure]
15min break of 9 ema
+ 618 retracement level
looking for price to fill (63.838)TP
EASYMARKETS:OILUSD

BRIEFING Week #20 : ETH Reversed, WTI Next ?!Here's your weekly update ! Brought to you each weekend with years of track-record history..
Don't forget to hit the like/follow button if you feel like this post deserves it ;)
That's the best way to support me and help pushing this content to other users.
Kindly,
Phil

WTI Crude Oil Price Targets Fresh GainsWTI Crude Oil Price Targets Fresh Gains
WTI Crude oil prices are gaining bullish momentum and might even test $63.50.
Important Takeaways for WTI Crude Oil Price Analysis Today
- WTI Crude climbed above the $60.90 and $61.50 resistance levels.
- There is a key rising channel forming with support at $61.30 on the hourly chart of XTI/USD at FXOpen.
WTI Crude Oil Price Technical Analysis
On the hourly chart of WTI Crude Oil at FXOpen, the price started a fresh upward move from $60.10 against the US Dollar. The price gained bullish momentum after it broke the $60.90 resistance.
The bulls pushed the price above the 50% Fib retracement level of the downward move from the $63.45 swing high to the $60.08 low. The price even climbed above the 50-hour simple moving average.
It tested the $62.15 resistance zone and the 61.8% Fib retracement level of the downward move from the $63.45 swing high to the $60.08 low. There is now a key rising channel forming with support at $61.30.
The RSI is now near the 50 level and the price could aim for more gains. If the price climbs higher again, it could face resistance near $62.15. The next major resistance is near the $62.65 level. Any more gains might send the price toward the $63.45 level or even $65.00.
Conversely, the price might correct gains and test the $61.30 support level. The next major support on the WTI crude oil chart is near the $60.90 zone, below which the price could test the $60.10 zone.
If there is a downside break, the price might decline toward $58.50. Any more losses may perhaps open the doors for a move toward the $55.50 support zone.
This article represents the opinion of the Companies operating under the FXOpen brand only. It is not to be construed as an offer, solicitation, or recommendation with respect to products and services provided by the Companies operating under the FXOpen brand, nor is it to be considered financial advice.

Hellena | Oil (4H): SHORT to support area of 56,339.Colleagues, I was watching the price and was expecting a pattern for a reversal downtrend. I still expect a downward movement and believe that the price is in a combined correction.
This means that wave “B” has been formed and I expect wave “C” to reach at least the 56,339 area.
Manage your capital correctly and competently! Only enter trades based on reliable patterns!

WTI Oil H4 | Potential bullish bounceWTI oil (USOIL) is falling towards an overlap support and could potentially bounce off this level to climb higher.
Buy entry is at 60.44 which is an overlap support that aligns with the 38.2% Fibonacci retracement.
Stop loss is at 57.60 which is a level that lies underneath a swing-low support and the 61.8% Fibonacci retracement.
Take profit is at 63.68 which is a multi-swing-high resistance.
High Risk Investment Warning
Trading Forex/CFDs on margin carries a high level of risk and may not be suitable for all investors. Leverage can work against you.
Stratos Markets Limited (tradu.com):
CFDs are complex instruments and come with a high risk of losing money rapidly due to leverage. 63% of retail investor accounts lose money when trading CFDs with this provider. You should consider whether you understand how CFDs work and whether you can afford to take the high risk of losing your money.
Stratos Europe Ltd (tradu.com):
CFDs are complex instruments and come with a high risk of losing money rapidly due to leverage. 63% of retail investor accounts lose money when trading CFDs with this provider. You should consider whether you understand how CFDs work and whether you can afford to take the high risk of losing your money.
Stratos Global LLC (tradu.com):
Losses can exceed deposits.
Please be advised that the information presented on TradingView is provided to Tradu (‘Company’, ‘we’) by a third-party provider (‘TFA Global Pte Ltd’). Please be reminded that you are solely responsible for the trading decisions on your account. There is a very high degree of risk involved in trading. Any information and/or content is intended entirely for research, educational and informational purposes only and does not constitute investment or consultation advice or investment strategy. The information is not tailored to the investment needs of any specific person and therefore does not involve a consideration of any of the investment objectives, financial situation or needs of any viewer that may receive it. Kindly also note that past performance is not a reliable indicator of future results. Actual results may differ materially from those anticipated in forward-looking or past performance statements. We assume no liability as to the accuracy or completeness of any of the information and/or content provided herein and the Company cannot be held responsible for any omission, mistake nor for any loss or damage including without limitation to any loss of profit which may arise from reliance on any information supplied by TFA Global Pte Ltd.
The speaker(s) is neither an employee, agent nor representative of Tradu and is therefore acting independently. The opinions given are their own, constitute general market commentary, and do not constitute the opinion or advice of Tradu or any form of personal or investment advice. Tradu neither endorses nor guarantees offerings of third-party speakers, nor is Tradu responsible for the content, veracity or opinions of third-party speakers, presenters or participants.

Buyers Stand By And Be Ready! In this Weekly Market Forecast, we will analyze the S&P 500, NASDAQ, DOW JONES, Gold and Silver futures, for the week of May 18 - 24th.
The Stock Indices remain bullish. So buys are warranted for next week.
Gold and Silver pulled back last week on news of Trump's deals and sanction relief. But Gold is at support now. Watch for bullish setups for buys or a bearish market structure shift before seeking sells.
Crude Oil is near buy side liquidity. Look for short term buys before a longer term, high probability sell setup to form.
Enjoy!
May profits be upon you.
Leave any questions or comments in the comment section.
I appreciate any feedback from my viewers!
Like and/or subscribe if you want more accurate analysis.
Thank you so much!
Disclaimer:
I do not provide personal investment advice and I am not a qualified licensed investment advisor.
All information found here, including any ideas, opinions, views, predictions, forecasts, commentaries, suggestions, expressed or implied herein, are for informational, entertainment or educational purposes only and should not be construed as personal investment advice. While the information provided is believed to be accurate, it may include errors or inaccuracies.
I will not and cannot be held liable for any actions you take as a result of anything you read here.
Conduct your own due diligence, or consult a licensed financial advisor or broker before making any and all investment decisions. Any investments, trades, speculations, or decisions made on the basis of any information found on this channel, expressed or implied herein, are committed at your own risk, financial or otherwise.

Natural Gas | Oil | Dollar | Silver | Gold Price ForecastNatural Gas | Oil | Dollar | Silver | Gold Price Forecast
NYMEX:NG1! CAPITALCOM:NATURALGAS COMEX:GC1! COMEX:SI1!

USOIL Weekly Analysis – Major Breakdown and Retest in PlayAfter several months of holding firm, USOIL has finally broken below its key support zone around $67–$70, which had acted as a floor since mid-2021 . This is a significant technical development, and the current price action is showing a classic bearish retest of that broken structure.
Technical Breakdown:
Support Broken:
The $67–$70 zone was tested multiple times over the past 2 years. Price has now cleanly broken through it and is struggling to reclaim it.
Retest in Progress:
Price is currently hovering around $62.36 and failing to push back above the broken support. This retest is textbook and could confirm further downside.
Market Structure:
Lower highs and lower lows dominate the weekly chart = clear bearish trend.
Bearish Targets:
Target 1: $53.50 – Previous minor demand zone from 2021.
Target 2: $41.50 – Strong historical support and potential major bounce area.
Invalidation Zone:
If price closes above $70 on the weekly chart, the breakdown would be invalidated and we’ll reconsider our bias.
Confluence:
Broken multi-year support
Bearish retest on weekly timeframe
Clear downside liquidity below
Summary:
Bias: Bearish
Setup: Short on confirmation of rejection below $67
Timeframe: Weekly / Daily
This is a high-probability setup if the rejection continues. Look for further bearish price action on the daily or 4H chart for refined entries. As always, manage risk carefully .
Like & Follow for more clean, high-timeframe breakdowns!

USOIL BEST PLACE TO SELL FROM|SHORT
USOIL SIGNAL
Trade Direction: short
Entry Level: 61.86
Target Level: 55.95
Stop Loss: 65.80
RISK PROFILE
Risk level: medium
Suggested risk: 1%
Timeframe: 1D
Disclosure: I am part of Trade Nation's Influencer program and receive a monthly fee for using their TradingView charts in my analysis.
✅LIKE AND COMMENT MY IDEAS✅

USOIL: Will Keep Falling! Here is Why:
The charts are full of distraction, disturbance and are a graveyard of fear and greed which shall not cloud our judgement on the current state of affairs in the USOIL pair price action which suggests a high likelihood of a coming move down.
Disclosure: I am part of Trade Nation's Influencer program and receive a monthly fee for using their TradingView charts in my analysis.
❤️ Please, support our work with like & comment! ❤️

USOIL: Strong Bearish Sentiment! Short!
My dear friends,
Today we will analyse USOIL together☺️
The price is near a wide key level
and the pair is approaching a significant decision level of 62.367 Therefore, a strong bearish reaction here could determine the next move down.We will watch for a confirmation candle, and then target the next key level of 61.933 .Recommend Stop-loss is beyond the current level.
❤️Sending you lots of Love and Hugs❤️

USOIL RISKY SHORT|
✅CRUDE OIL is going up to retest
A horizontal resistance of 62.00$
Which makes me locally bearish biased
And I think that we will see a pullback
And a move down from the level
Towards the target below at 60.62$
SHORT🔥
✅Like and subscribe to never miss a new idea!✅
Disclosure: I am part of Trade Nation's Influencer program and receive a monthly fee for using their TradingView charts in my analysis.

WTI Crude Returns to the $60 ZoneWTI crude oil has posted a drop of more than 4% in recent sessions as the market digests new announcements from OPEC+. The organization stated that current economic conditions could support growth in oil demand throughout 2025 and 2026. However, it remains firm in its decision to increase production starting in May and June, with monthly increments of 411,000 barrels per day, and has also announced another increase in July.
This stance has sparked concerns in the market about a potential short-term oversupply. If this strategy persists, selling pressure could return to WTI price action in the coming sessions.
Bearish Trend
Since January 20, a clear bearish trend has been forming, pushing the barrel’s price below the $60 mark. While a notable upward move is currently underway, it remains insufficient to break the prevailing bearish formation, which continues to be the dominant technical structure in the short term.
ADX
The ADX line was previously hovering around the 40 level, reflecting high volatility in price movements. However, it has begun to flatten, and if this continues, it could suggest a loss of directional strength, paving the way for a more neutral price behavior.
RSI
The behavior of the RSI mirrors that of the ADX. It is currently oscillating around the 50 level, indicating a balance between buying and selling pressure, and reinforcing the potential for a neutral phase in the short term.
Key Levels:
$65 – Current Resistance: Aligns with the 38.2% Fibonacci retracement and acts as a key psychological level. A breakout above this level could extend the current bullish bias over the coming sessions.
$67 – Distant Resistance: Matches the 50% Fibonacci retracement and a sideways zone observed in March. Sustained moves above this area could challenge the existing bearish structure on the chart.
$60 – Crucial Support: Represents a consistent area of indecision in recent months. If the price returns to this level, the previous bearish structure could regain strength in the short term.
Written by Julian Pineda, CFA – Market Analyst

Potential bullish bounce?USO/USD has bounced off the support level which is an overlap support that lines up with the 38.2% Fibonacci retracement and could potentially rise from this level to our take profit.
Entry: 60.39
Why we like it:
There is an overlap support level that aligns with the 38.2% Fibonacci retracement.
Stop loss: 57.93
Why we like it:
There is a pullback support level that lines up with the 71% Fibonacci retracement.
Take profit: 64.14
Why we like it:
There is a pullback resistance level.
Enjoying your TradingView experience? Review us!
Please be advised that the information presented on TradingView is provided to Vantage (‘Vantage Global Limited’, ‘we’) by a third-party provider (‘Everest Fortune Group’). Please be reminded that you are solely responsible for the trading decisions on your account. There is a very high degree of risk involved in trading. Any information and/or content is intended entirely for research, educational and informational purposes only and does not constitute investment or consultation advice or investment strategy. The information is not tailored to the investment needs of any specific person and therefore does not involve a consideration of any of the investment objectives, financial situation or needs of any viewer that may receive it. Kindly also note that past performance is not a reliable indicator of future results. Actual results may differ materially from those anticipated in forward-looking or past performance statements. We assume no liability as to the accuracy or completeness of any of the information and/or content provided herein and the Company cannot be held responsible for any omission, mistake nor for any loss or damage including without limitation to any loss of profit which may arise from reliance on any information supplied by Everest Fortune Group.

USOIL Temporary Drop seems inevitableOn Thursday, WTI crude oil futures prices fell approximately 3.5% during the session, extending losses after failing to test technical resistance levels. The decline was jointly driven by heightened expectations of a U.S.-Iran nuclear agreement and unexpected increases in crude oil inventories, both of which exerted heavy pressure on supply outlooks. Nevertheless, market analysis suggests the downside for the U.S. dollar may be limited. Improved global trade sentiment has reduced recession fears, leading markets to scale back expectations for aggressive Federal Reserve rate cuts. Data shows the probability of a 25-basis-point rate cut by the Fed in September is now 74%, down from earlier predictions of a July cut.
Crude oil continued to decline today, breaking the previous upward pattern, with a high probability that prices will trade in a broad range going forward. Overall, the magnitude of the decline has increased, suggesting a higher likelihood of further downside. Today's trading strategy considers shorting on rebounds as the primary approach, while waiting for long opportunities at lower levels. Resistance is focused on the $62.0–63.0 area, with support at $60.0–59.0.
you are currently struggling with losses, or are unsure which of the numerous trading strategies to follow, at this moment, you can choose to observe the operations within our channel.