Weekly Market Forecast WTI CRUDE OIL: Bearish! Wait For SellsThis forecast is for the week of March 17 - 21st.
WTI Crude Oil is in consolidation, but forming a wedge pattern. As the market condenses, we no watch out for a breakout that could go in either direction. But if we take note of the Weekly bearish FVG that formed last week, we simply wait for price to sting into it and use it to move lower. The market is weak, and has been trending down for over two months now. Using the trend and the -FVG, the higher probability is for price to continue lower, as long as the -FVG holds.
Check the comments section below for updates regarding this analysis throughout the week.
Enjoy!
May profits be upon you.
Leave any questions or comments in the comment section.
I appreciate any feedback from my viewers!
Like and/or subscribe if you want more accurate analysis.
Thank you so much!
Disclaimer:
I do not provide personal investment advice and I am not a qualified licensed investment advisor.
All information found here, including any ideas, opinions, views, predictions, forecasts, commentaries, suggestions, expressed or implied herein, are for informational, entertainment or educational purposes only and should not be construed as personal investment advice. While the information provided is believed to be accurate, it may include errors or inaccuracies.
I will not and cannot be held liable for any actions you take as a result of anything you read here.
Conduct your own due diligence, or consult a licensed financial advisor or broker before making any and all investment decisions. Any investments, trades, speculations, or decisions made on the basis of any information found on this channel, expressed or implied herein, are committed at your own risk, financial or otherwise.
Usoilanalysis

USOIL Analysis of TodayThe global economic situation has a significant impact on the demand for crude oil.
During periods of economic prosperity, industrial production and transportation activities are frequent, leading to an increase in the demand for crude oil, which in turn drives up the price of USOIL.
For example, during the period of rapid development of emerging economies, the demand for energy was robust. When there is an economic recession, the demand decreases, and the price may drop. Just like after the global financial crisis in 2008, the demand for crude oil plummeted sharply, and the price also crashed accordingly. In terms of supply, the changes in production output of major oil-producing countries are of vital importance.
The adjustment of production capacity and production disruptions in major oil-producing countries such as the United States, Saudi Arabia, and Russia will all affect the global crude oil supply. For instance, the development of the shale oil industry in the United States has significantly increased the country's crude oil production, having a major impact on the global crude oil market supply pattern.
🎁 Buy@66.90 - 67.00
🎁 SL 66.80
🎁 TP 67.15 - 67.20
Traders, if you liked this idea or if you have your own opinion about it, write in the comments. I will be glad
If you also aspire to achieve financial freedom,Follow the link below to get my daily strategy updates

USOIL:The latest trading strategyThe price of WTI crude oil futures has risen slightly, and the market is currently in the process of bottom - building.
The price briefly broke through last week's high of $67.94, reaching an intraday high of $68.37 before pulling back. The market remains in a "sell - on - rally" mode.
After the higher opening, there is a probability that the crude oil price will stabilize at a lower level. For the subsequent trading strategy, short - selling is worth considering.
USOIL Trading Strategy:
Sell@67.7-68.3
TP:66-65

#USOIL/WTI 1 DAYUSOIL/WTI (1D Timeframe) Analysis
Market Structure:
The price is currently trading near a key support level, which has previously acted as a strong demand zone. Buyers may step in at this level, leading to a potential reversal or bounce.
Forecast:
A buy opportunity is expected if the price holds above the support level and shows signs of bullish momentum. Confirmation through price action, such as bullish candlestick patterns or increased volume, can strengthen the trade setup.
Key Levels to Watch:
- Entry Zone: Consider buying near the support level if the price confirms a bounce.
- Risk Management:
- Stop Loss: Placed below the support level to manage downside risk.
- Take Profit: Target resistance levels or previous swing highs for potential gains.
Market Sentiment:
If the support level holds, the market sentiment may shift towards the upside, leading to a potential bullish move. However, a breakdown below support could indicate further weakness, requiring reassessment.

USOILUSOIL is in still in down trend, any pullback is just a chance to get in the sells again.
Disclosure: We are part of Trade Nation's Influencer program and receive a monthly fee for using their TradingView charts in our analysis.

Trading Strategy for Crude Oil Next WeekAs U.S. President Donald Trump pushes for an increase in domestic oil production and a reduction in energy prices, the prospect of declining profits may stifle drilling activities. If WTI crude oil hovers around $65 per barrel, shale oil operators may shut down 25 drilling rigs and keep U.S. oil production flat. A further drop in prices would actually reduce crude oil production.
With Trump's trade war weighing on the demand outlook, traders are bracing for an influx of Russian crude oil into the global market, and WTI crude oil is in the midst of its longest losing streak in nearly a decade.
The price of crude oil has been lingering at a low level. On the weekly chart, it closed with a bearish doji star, showing a double-bottom pattern. In the short term, the oil price is still fluctuating in the range below $68.5. If it fails to break upward in the future, there is a high probability of a continued decline.
USOIL Trading Strategy for Next Week:
Sell@67.7-68.3
TP:66-65
I always firmly believe that profit is the sole criterion for measuring strength. I will share accurate trading signals every day. Follow my lead and wealth will surely come rolling in. Click on my profile for your guide.

"US oil Spot / WTI" Energy Market Bullish Heist Plan🌟Hi! Hola! Ola! Bonjour! Hallo! Marhaba!🌟
Dear Money Makers & Thieves, 🤑 💰🐱👤🐱🏍
Based on 🔥Thief Trading style technical and fundamental analysis🔥, here is our master plan to heist the "US oil Spot / WTI" Energy market. Please adhere to the strategy I've outlined in the chart, which emphasizes long entry. Our aim is the high-risk Red Zone. Risky level, overbought market, consolidation, trend reversal, trap at the level where traders and bearish robbers are stronger. 🏆💸Book Profits wealthy and safe trade.💪🏆🎉
Entry 📈 : "The heist is on! Wait for the MA breakout (73.300) then make your move - Bullish profits await!"
however I advise to Place Buy stop orders above the Moving average (or) Place buy limit orders within a 15 or 30 minute timeframe most recent or swing, low or high level.
Stop Loss 🛑:
Thief SL placed at the recent / nearest low level Using the 2H timeframe (71.600) swing trade basis.
SL is based on your risk of the trade, lot size and how many multiple orders you have to take.
Target 🎯:
1st Target - 75.500 (or) Escape Before the Target
Final Target - 79.000 (or) Escape Before the Target
🧲Scalpers, take note 👀 : only scalp on the Long side. If you have a lot of money, you can go straight away; if not, you can join swing traders and carry out the robbery plan. Use trailing SL to safeguard your money 💰.
📰🗞️Fundamental, Macro, COT, Sentimental Outlook:
🛢️"US oil Spot / WTI" Energy Market is currently experiencing a bullish trend,., driven by several key factors.
🔥Fundamental Analysis
- Supply and Demand: The current price is influenced by the balance between oil supply and demand. OPEC's production cuts and increasing demand from Asia are driving prices up ¹.
- Inventory Levels: US oil inventory levels are currently below the five-year average, contributing to the price surge.
🔥Macro Economics
- Inflation: Rising oil prices can contribute to inflation, which may lead to interest rate hikes and impact oil demand.
- Global Economic Trends: Economic growth, particularly in Asia, is driving up oil demand and prices.
🔥COT Data
- Non-Commercial Traders: Currently holding a net long position, indicating a bullish sentiment.
- Commercial Traders: Holding a net short position, possibly hedging against potential price drops.
🔥Seasonal Analysis
- Historical Price Patterns: Oil prices tend to be higher during the summer months due to increased demand.
🔥Market Sentimental Analysis
- Investor Sentiment: Currently leaning towards a bullish outlook, driven by escalating crude oil prices and increasing demand.
- Market Positioning: Investors are optimistic about oil's potential, with some expecting a breakout above $75.
🔥Next Trend Move
- Potential for an Upward Movement: With increasing demand and supply constraints, oil prices may continue to rise.
🔥Overall Summary Outlook
Considering the current price of 72.500, USOILSPOT is expected to maintain its upward momentum, driven by increasing demand and supply constraints. However, investors should be cautious of potential price volatility and geopolitical events that may impact oil prices.
⚠️Trading Alert : News Releases and Position Management 📰 🗞️ 🚫🚏
As a reminder, news releases can have a significant impact on market prices and volatility. To minimize potential losses and protect your running positions,
we recommend the following:
Avoid taking new trades during news releases
Use trailing stop-loss orders to protect your running positions and lock in profits
💖Supporting our robbery plan will enable us to effortlessly make and steal money 💰💵 Tell your friends, Colleagues and family to follow, like, and share. Boost the strength of our robbery team. Every day in this market make money with ease by using the Thief Trading Style.🏆💪🤝❤️🎉🚀
I'll see you soon with another heist plan, so stay tuned 🤑🐱👤🤗🤩

USOIL latest analysis of profitable trading signalsDuring the US trading session on Thursday, US crude oil fell in a narrow range and is currently trading around $67.13 per barrel, holding most of the gains in the previous two trading days. Previously, oil prices had rebounded for two consecutive trading days. The latest monthly report released by the Organization of Petroleum Exporting Countries (OPEC) on Wednesday showed that the organization maintained its forecast for global oil demand growth in 2025 and 2026, which is expected to increase by 1.45 million barrels per day and 1.43 million barrels per day respectively. The current crude oil market is supported by factors such as the decline in US inflation and the recovery of market sentiment in the short term, and prices have rebounded.
Analysis: From the daily chart level, the medium-term trend of crude oil remains in a wide upward channel, and oil prices gradually fall back to the lower edge of the channel. There have been many cases where one trading day swallowed up all the gains in the previous week, and the short-selling forces are more dominant. The medium-term trend of crude oil maintains a range of oscillations and downward, and the lower edge of the channel has been broken. It is expected that the medium-term decline of crude oil will start soon. The short-term trend of crude oil (1H) continues to consolidate at a low level, and the oil price gradually tests from the bottom of the range to the upper edge of the range, with the range range between 68.80-65.20. The short-term objective trend direction is oscillating rhythm. It is expected that the trend of crude oil will be resisted at the upper edge of the range during the day, and the probability of falling back downward is high. On the whole, He Bosheng recommends that the operation strategy of crude oil today is mainly to rebound high and to step on lows as a supplement. The short-term focus on the upper resistance of 68.3-68.8 and the short-term focus on the lower support of 66.0-65.5. FX:USOIL FOREXCOM:USOIL TVC:USOIL

USOIL's latest 20% profit tips
Trading signal analysis gives 65 support, and traders who rebound and go long, TP reaches the target 15%.
If you don’t know when to buy or sell, please pay close attention to the real-time signal release of the trading center or leave me a message, so that you can quickly realize the joy of profit. FOREXCOM:USOIL FX:USOIL TVC:USOIL

Latest USOIL Trading Signal PlanToday's crude oil opened at $66.34, slightly higher than yesterday's low, indicating that the market has some support around $65. After Wednesday's low of $65.22, the 4-hour chart closed with a positive line with a long lower shadow, showing that bulls have strong defense around $65.
According to the current trend analysis, the price fell from $73.14 to $68.36, a drop of $4.78; it rebounded from $68.36 to $70.60, a rebound of $2.24, and a correction of about 50%. The drop from $70.60 to $65.22, a drop of $5.38, may theoretically have ended, but considering the support of the $65 mark, it may further fall below $65.
The current trend stage may be nearing its end, but the $65 mark has not been effectively broken, and the possibility of further decline needs to be paid attention to. The target below may be in the $64.00-63.00 range.
If the price stabilizes around $65, it may start to rebound, with the target in the $67.00-68.00 range. Short selling is the main method of rebounding during the day. Pay attention to the support effect of the $65 mark. If the price effectively falls below $65, short selling can be pursued, with the target at $63.00-64.00.
Trading is risky and positions should be controlled reasonably. When the opportunity comes, if you don’t know when to buy or sell, pay close attention to my real-time signal announcement or leave me a message so that you can realize the joy of quick profits. FOREXCOM:USOIL FX:USOIL TVC:USOIL

WTI Price Analysis: Key Insights for Next Week Trading DecisionMarket Overview:
📉 WTI at $66.00: Trading defensively near a three-year low amid tariff concerns and OPEC+ output hikes.
📊 Inventory Build: A larger-than-expected US crude inventory build (up by 3.614M barrels vs. a forecasted decline) is adding pressure on prices.
⚖️ Tariff Uncertainty: Despite Trump's recent executive order exempting goods from Canada and Mexico under USMCA, overall tariff uncertainty remains a key concern.
🔺 OPEC+ Output Increase: For the first time since 2022, OPEC+ has ramped up production, weighing further on WTI.
Technical Insights:
📉 Descending Channel: The 4H chart shows a clear descending channel. Watch for the potential break of the channel's resistance line to the upside.
🎯 Key Level: Next week, the critical level to monitor is $66.50 – consider a buy if prices break above, and sell if they remain below.
Upcoming Catalysts:
⏰ US Employment Data: Keep an eye on the Consumer Price Index, Producer Price Index, Michigan Consumer Sentiment Index, EIA and API report. A weaker-than-expected report could lift the USD and boost oil prices.
Stay Tuned:
I'll provide a detailed update at the beginning of next week. Follow along for more insights and actionable trading strategies!
#WTI #CrudeOil #OilTrading #OilMarket #CommodityTrading #EnergyMarket #OilPrice #MarketAnalysis #TradingInsights #OPEC
Happy trading!
Disclaimer:
Forex and other market trading involve high risk and may not be for everyone. This content is educational only—not financial advice. Always assess your situation and consult a professional before investing. Past performance doesn’t guarantee future results.

Oil Prices Plummet as Trade Tensions RiseOil prices took a hit after Trump's tariffs were announced, and it's essential to understand the reasoning behind this drop.
When US imposed tariffs on Chinese goods, China retaliated by placing tariffs on US goods, including oil. This move led to a decrease in oil demand from China, which is the world's largest oil importer. As a result, oil prices plummeted.
◉ Key Factors Behind the Decline
● Trade Tensions: The escalation of trade tensions between the US and China led to a decrease in oil demand, causing prices to drop.
● China's Tariffs on US Oil: China's decision to impose tariffs on US oil imports reduced demand for US oil, contributing to the price decline.
● Global Economic Slowdown: The ongoing trade tensions and tariffs have led to a slowdown in global economic growth, further reducing oil demand and prices.
● Increased Oil Production: The US has been increasing its oil production, leading to a surplus in the market and contributing to the decline in oil prices.
◉ Technical Observations
● A notable decline in oil prices has been observed since mid-January 2025.
● Prices are currently hovering near the critical support zone around $66, a level that has historically provided a floor for prices.
● If this support level is breached, it may trigger a further decline in oil prices.

USOIL POTENTIAL BUYS On M15 Timeframe USOIL is showing a lot of buying momentum due its manner on this particular time frame. So am expecting price to rise to resistance 70.55
Entry:69.43
Stoploss:68.97
Take Profit:70.56
If you found this idea helpful please leave a like and a comment

Crude Oil Technical Outlook: Range Breakdown & Next Targets🔹Key Observations:
1. Range Formation & Breakout:
- The price was consolidating within a range (highlighted in the pink box).
- A range breakout trading setup is identified.
- The price has broken below the range support, signaling potential downside momentum.
2. Breakout Confirmation:
- The price has moved below a key support area (marked in blue).
- The breakdown indicates a potential continuation of the downtrend.
3. Downside Targets:
- 1st Target: $68.00 (first green line).
- 2nd Target: $67.05 (second green line).
- If the price sustains below the breakout level, these targets could be reached.
4. Volume Analysis:
- The volume bar at the bottom suggests increased selling pressure.
- The breakout occurred with notable volume, which confirms bearish sentiment.
▪️Technical Outlook:
- Bearish Bias: The chart suggests a bearish move with downside targets aligned at $68.00 and $67.05.
- Watch for Retest: If the price pulls back toward the breakout zone, it may confirm the breakdown before further decline.
- Invalidation Level: A strong recovery back above the blue support zone could invalidate the bearish setup.
😊Don't Forget To Hit The Like Button & Share Your Thoughts In Comments.


USOIL BUY!!!hello friends
As you can see, this chart is very, very patternable.
Now, with the floor construction that we expect from it, the growth to the resistance areas has been determined.
*Trade safely with us*

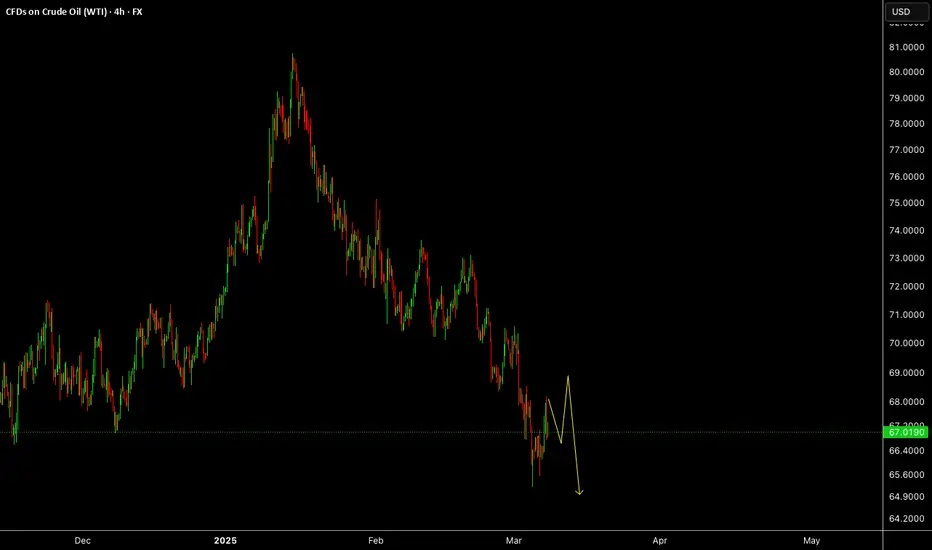
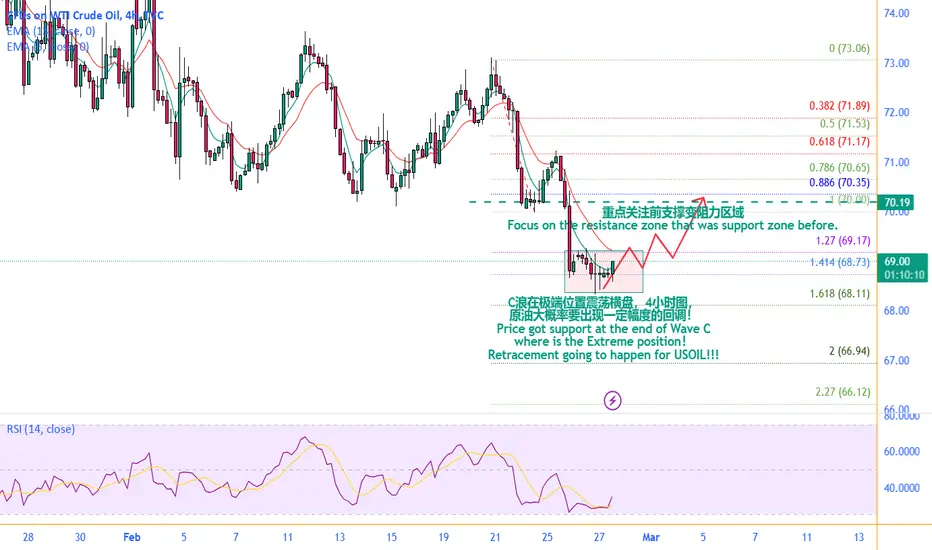
0227 USOIL looking for a correction on 4H chart!!!Hello traders,
On Wednesday, the internal alert stated: "On Wednesday, we are waiting for a new sideways trend in crude oil. Crude oil may experience a short-term decline followed by a pullback around the opening time of the European and American markets. Participation is not recommended!"
On Thursday, in the four-hour chart, the C wave of crude oil is oscillating sideways at an extreme position, and there is a high probability of a certain degree of pullback! Pay close attention to the previous support level of 70.00, which is also a key psychological price level.
You can consider taking a light position to go long on crude oil!
TP1: 70.00
TP2: 70.35
GOOD LUCK!
LESS IS MORE!
Go long crude oilDear Traders,
Currently, crude oil continues its downward trend, though the pace of its decline has moderated, showing signs of bottoming out. Moreover, oil has now pulled back to the critical support zone around the 68 level. Should oil fail to decisively break below this support, a technical rebound could occur at any moment. Additionally, with oil’s relatively low valuation, it becomes increasingly attractive in the market.
For short-term trades, I favor initiating long positions on crude oil, with an initial target of a rebound toward the 69.5-70.5 zone, which seems well within reach.Bros, profits are the ultimate goal in trading. Accumulating profits is what changes lives and destinies. Choosing wisely is far more important than just working hard. If you want to replicate trade signals and earn stable profits, or if you want to deeply learn the correct trading logic and techniques, you can consider joining the channel at the bottom of this article!

USOIL IS ON SUPPORT ZONE?Currently Usoil is in support zone we will see pump from this levels that i mentioned in chart so be carefull with your trades and avoid short usoil becouse Usoil is on support.

US Oil Market Outlook: Bearish Momentum Indicate Further DeclineThe 4-hour chart of WTI Crude Oil (TVC: USOIL) reveals a well-defined market structure transition from bullish to bearish. Initially, the price action exhibited a strong uptrend, characterized by the formation of higher highs (HH) and higher lows (HL). However, a break of structure (BOS) marked the onset of a reversal, leading to the emergence of lower highs (LH) and lower lows (LL), confirming the shift to a downtrend.
A key technical observation is the presence of a price gap near the highest point, which often signifies inefficiency in the market and the potential for price retracements in the future. Furthermore, the highlighted resistance zone around the $72.49–$73.50 range has proven to be a strong supply area, repeatedly rejecting bullish attempts to break above it. This resistance, coupled with price trading below the 50-period and 200-period moving averages, reinforces the bearish bias.
The price has now breached the $71.78 level, accelerating downward momentum. The next significant area of interest lies at the identified support level around $69.36, which serves as the primary target area. If selling pressure remains dominant, further declines may be anticipated.
Volume analysis further substantiates the bearish outlook, as recent price drops have been accompanied by increased selling activity. The combination of structural shifts, resistance validation, and moving average positioning strongly suggests that the downward trajectory is likely to persist unless the price reclaims and sustains above the resistance zone.
Don't Forget To Hit The Like Button & Share Your Thoughts In Comments.

WTI Oil Analysis and Trade Idea📊 Dive into a detailed technical analysis of WTI Oil as we explore monthly, weekly, and 4-hour levels, liquidity zones, and potential trading setups. Not financial advice.

USOIL Reversal in Motion? Key Levels You Can’t Ignore!Market Structure Breakdown:
🔸 Daily Timeframe:
• We initially identified a double-bottom formation, signaling a bullish push to grab liquidity above previous highs.
• However, buyers failed to sustain momentum, leading to a structural shift.
🔸 H4 Timeframe:
• Strong impulse move downward, breaking key structure.
• Formed a lower high, indicating seller control.
🔸 H1 Timeframe:
• Entry confirmation: Lower high + structure break + retest.
• Current Position: Short trade floating +142 pips in profit.
• Stops secured in profit = No risk on the trade.
🎯 Next Targets & Key Levels:
✅ Target 1: Sweep 7040 low.
✅ Target 2: Potential drop to 7026 if momentum continues.
⏳ Crucial Confirmation Needed:
• If today’s bearish candle closes above average, it will confirm a true lower high and increase chances of breaking consolidation to move lower.
🛠 Trade Management:
• Profits taken at: +30 pips, +60 pips, +100 pips.
• Current floating: +142 pips.
• Overall target: +212 pips (1:5 / 1:6 RR).
• If we break consolidation, we’ll trail TP and maximize gains.
This trade is a textbook example of a failed bullish push leading to a structural breakdown. With stops locked in profit, we’re letting the trade play out risk-free, while looking for further downside expansion.
If you’re tracking USOIL, keep an eye on these key levels and watch how price reacts! 🚀📊
