USOIL - Wave Revision - Oil Has Not BottomedIn fact far from bottomed USOIL has much further to fall if this latest AriasWave analysis is anything to go by.
We are still working within Wave B of an unfolding Zig Zag.
The Wave B of Wave (B) of Wave B expanded below the zero point. This thing is no where near done falling into negative territory.
This new analysis further supports what is happening in other markets.
I will post an idea on the current Wave C shortly.
Please LIKE and FOLLOW to get notification of updates and future posts.
Usoilforecast

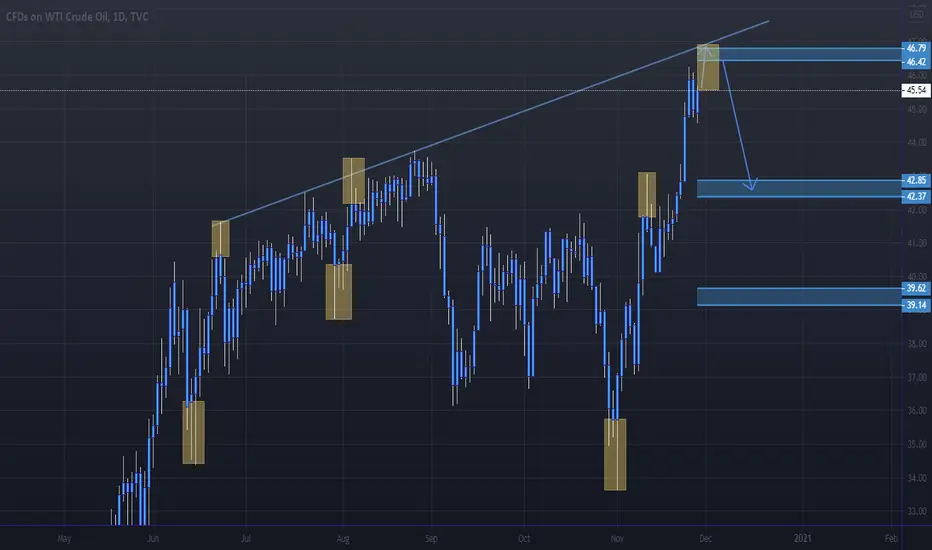
USOIL SELLING IDEAHi Traders,
USOIL is retesting its Supply Zone. I have drew to profit levels also.
hope this work.
Good Luck

US OIL SHORTShort all over for me!
Yellow zones show liquidation spikes...We haven't seen any yet and we need one for the reversal.
OIL 9.55% jump was expected from August high levelUSOIL
*********
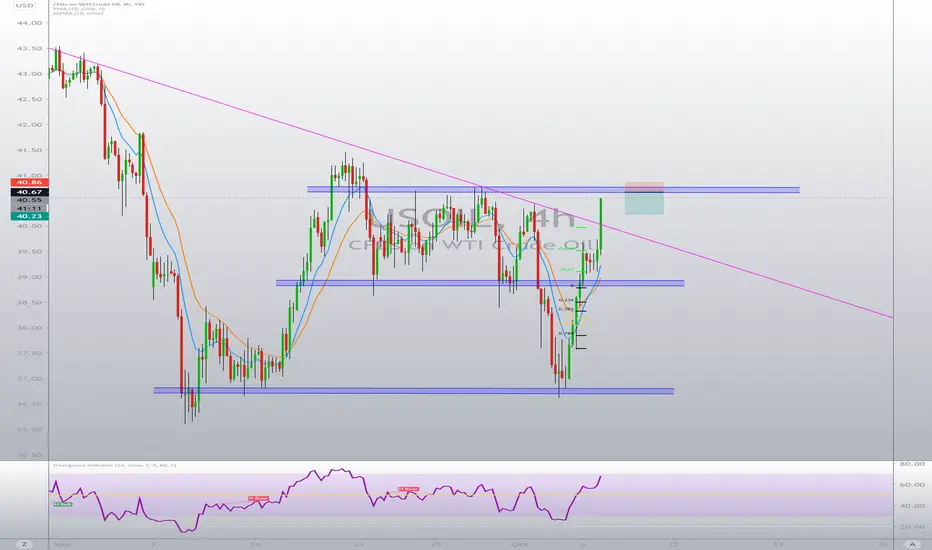
⏳4 Hour chart
🎲 Possible entry analysis
⛳️ Possible bull/bear target
📚Educational
—————-❇️——————-
Detailed analysis 💬
1️⃣ Positive vaccine hope-major boost in energy demand
2️⃣ Demand driven recent upward rally
3️⃣ Break and retest happens around 40.00 ( Psychological level )
4️⃣ 44.00 Upper side resistance - Minor Key reversal area
5️⃣ Successful move out of the ranging territory
6️⃣ August high - 43.79 immediate support for bull
7️⃣ Technical support - Bull
8️⃣ 48.00 will acted as key reversal-bearish
9️⃣ June, September, October months low's forming a lower side trend line
🔟 Possible swing target-48.00 Key reversal area
*️⃣ Reverse Parabolic move-Slowing of the momentum
#️⃣ Overall trend - bullish
—————-❇️——————-
📉 Technical bias-H4-Bullish
Price is above 50,100,200 Exponential moving average
50 Exponential moving average will act as support-Bull
Ichimoku cloud -cloud is still green -Cloud supporting the bullish trend
Bollinger band- Price reached around the upper side of the band and middle band is acting as bullish support
Relative strength index - Reached around 50 neutral area 50- Will act as support for bullish trend
MACD -Turned red and fell below the signal line ,oscillators are crossed and pointing downwards
Stochastic - Reached around 60- Oscillators are converging pointing downwards short term fall back expected
—————-✳️——————-
Key reversal area's
44.00 Psychological level/Dynamic support & Resistance
43.79 August month high
48.00 Key reversal area/psychological level
41.86 October month high
4.39 September month high
43.00 Major psychological level
38.00 POC area
43.79 Support level/Possible entry- Bull
48.00 Psychological level/Alternative bearish entry
—————-✳️——————-
Bullish entry #oil #usoil
Entry price - 43.80
Take profit 01 - 45.00
Take profit 02 - 46.20
Take profit 03 - 48.00
🚫 Stop lose 42.30
⬆️ 9.59% Growth expected
⤴️ Account growth 2.05: 9.59
✅ Risk reward ratio 1 : 4.7
—————-⚜️——————-
Push the like button , And cheer up if you found useful

Usoil: Is it about to fall.Will usoil fall now or move up a little bit before falling. One thing is for sure its about to fall.

Bearish scenarioHarmonic Bullish Bat pattern forming, get ready to sell on breaking the up trend. The target will be 38


USDCHF BUY ON DIPS FROM KEY LEVEL !!!!BUYING ON DIPS
More Demand rising+Negative inventory as predicted Help OIL price to revive
FRIENDS it will be a help that you
Push Like and comments Follow us for more updates

USOIL 15 MIN 22 OCTas you can see the price broke the resistance level
we have 1:2 risk / reward ratio
I am looking for buying opportunity
DO NOT FORGET FOLLOW OPEC NEWS


CFDs on crud oil opportunity to bu , USOIL signal buy concerning this market will experience an uptrend
towards the TP because the buyers will return to the market
combined with the spring effect on the VWAP indicator
with a large volume means that the start of an uptrend
signal buy


📢US OIL Going down 😮It sure looks like Oil will be heading lower from here. take a look at those nice red candles 🛢🛢🩸

USOIL BUYING ON DIPS !!!as we see more demand day by day after opening alote of countries their lockdown
we expecting more bullish in usoil and we expected it will hit 50$ barrel till ending of 2020
guys push like and follow us for more updates on other analysis

a buying opportunity on Crude Oila strong breakout of VWAP with a large volume on the volume up down
a very important buying opportunity


📢USOIL, we'll know the direction at close of the daily candleThis is on our watchlist 👀 ... If you like the Analysis feel free to drop a like and leave comment, we are grateful for all the love out there 🤍

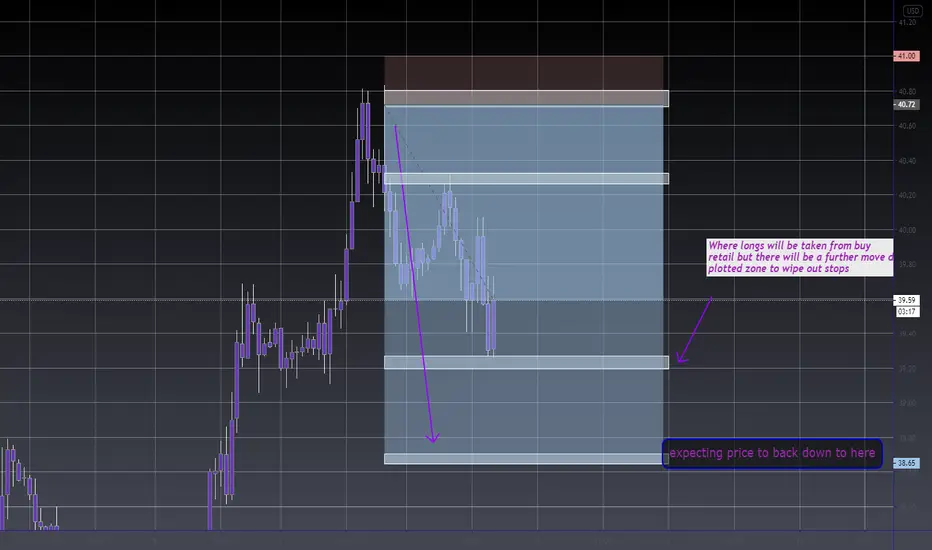
To the tee!This trade is unfolding perfectly. The next zone has been grabbed where retail have entered...further push down now to wipe out retail longs

Oil shortI Believe oil is still going to down.
BULL TRAP AND BIG IMPULSE TO WIPE STOPS.
SUB $36 IN BOUND.

USOILPrice tested the flip resistance. The market is currently printing a descending triangle consolidation pattern. Possible price action patterns indicated.
