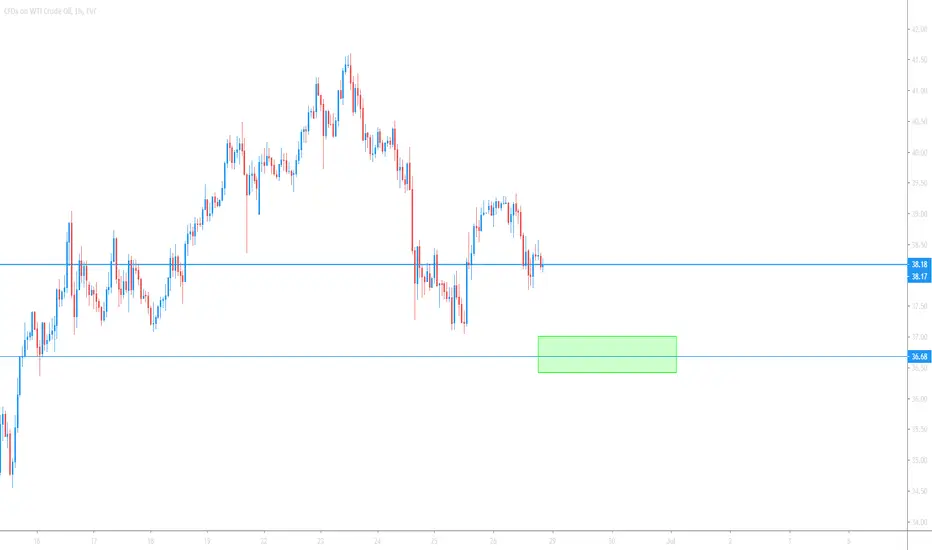
USOIL - SELLExpecting OIL to take a drop this week to its previous level of support, once this current level has been broken
Usoilforecast
USOIL CRUDE OIL FUTURES LONG SET UP TO $44US OIL LONG DROP
P 39.54
S3 35.4 S2 37.47 S1 38.49 R1 40.56 R2 41.61 R3 43.68
CRUDE OIL FUTURES
TITLE : BUY USOIL
ASSETS : COMMODITIE
SYMBOL : USOIL
ORDER TYPE : (EP1) market
(EP2) LIMIT ORDER
TF : 1W
ENTRY PRICE 1: $37.98
ENTRY PRICE 2: $37.08
STOP LOSS : $36.20
TAKE PROFIT 1- $38.98
TAKE PROFIT 2- $40.08
TAKE PROFIT 3 -$41.98
TAKE PROFIT 4 -$43.08
STATUS: ACTIVE

USOIL Buy OIL from around 34Hi traders,
If you want you can start watching for SHORT TERM Sell setups back to the previous bottom around 34.
For buyers, let the price come down to 34 then we will start watching for buy setups.
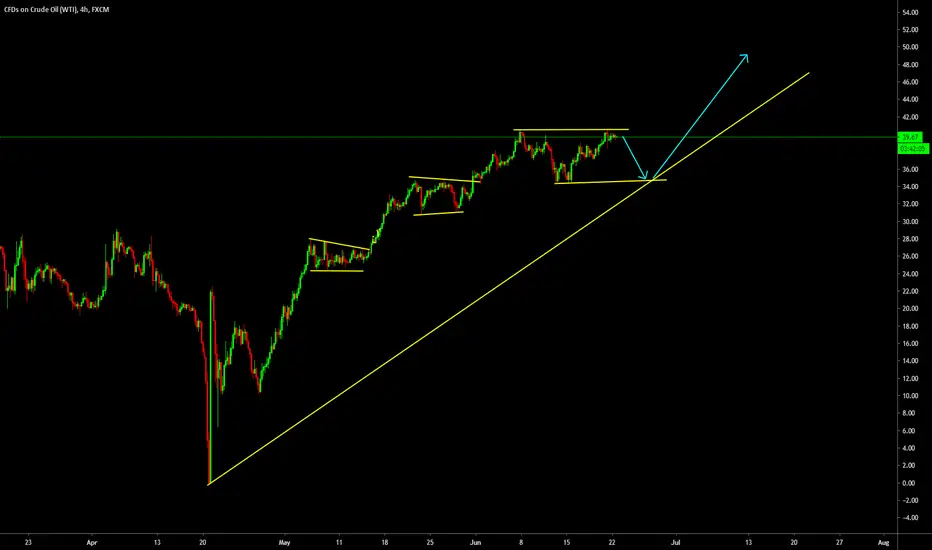

USOIL (XTIUSD) CRUDE OIL GOING TO 50$+USOIL START MOVING TO 50$+ all is matter of time as
worldwide lock down is opening
Keep buying we had changed our trend
after long time period on oil ..
NOW WE ARE BUYING
WE APPRECIATE YOUR LIKES AN COMMENTS
DO YOUR OWN ANALYSIS BEFORE ENTERING TO A TRADE

USO ETF Resumes Trading Oil Futures - 155% Price IncreaseFollowing temporary suspension of trading new oil futures contracts for all institutional and private customers by USO's broker RBC, USO has secured a second broker, RCG, to allow the trading of new oil futures contracts by USO , effective May 29, 2020.
In addition to the buying and selling of new oil futures contracts under RCG, USO still maintains full rollover capabilities of preexisting oil futures contracts, prior to May 23, 2020, maintained, and brokered, under RBC .
From the market low of $16.88 on April 28, 2020, USO has seen a 155% increase on price, as of June 2, 2020.
With economic recovery, and an increased demand for oil , poised to dominate the summer season, outlooks for holders of USO ETF are promising.

USOIL - WTI (CRUDE)Hey Guys,
GOLD and OIL both are quite Bullish due to current economic uncertainty.
Buy the dips and keep long term targets to 33, 35, and 40.
Note, any impulsive moves to the downside will be short-lived.
Ty

USOIL WTI CRUDE TIME TO GO DOWN TO $20 Then $17!! SELL!Failure to break the LH at 28.40 we can see Oil heading down to retrace or make a new LL


USOIL - WTIHey Guys,
I believe we are starting downtrend for this and coming week.
Target 1 = 22
Target 2 = 20
Target 3 = 18
Extended Target = 16.50
Good luck!

SECOND ROUND OF USOIL / WTI SELLS INCOMING UPDATE!USOIL / WTI - Update.
Created an equal high today after pushing higher. Then following on with a push down.
Need to see a pullback to the areas highlighted if we can and see it rejecting strongly we can look to sell OIL.
For now be patient and await some more signs.
IF we do not reject after a pullback and keep pushing higher we may be in for OIL coming in higher ONE MORE last time to 28.40 so please keep aware and be patient.

USOIL SHORTS COMING IN TO $10Rejection of the resistance area twice of the last LH set to come down!

USOIL will rally up long-term!As businesses slowly reopen in the US, the demand for oil will increase. Therefore, the price will rise long-term. Please like, share and follow if you found my analysis useful!

USOIl - WTIHey Guys,
Hope you are getting good trade out of this. I can see two possible scenarios for coming week.
Share your thoughts and take care.
ty

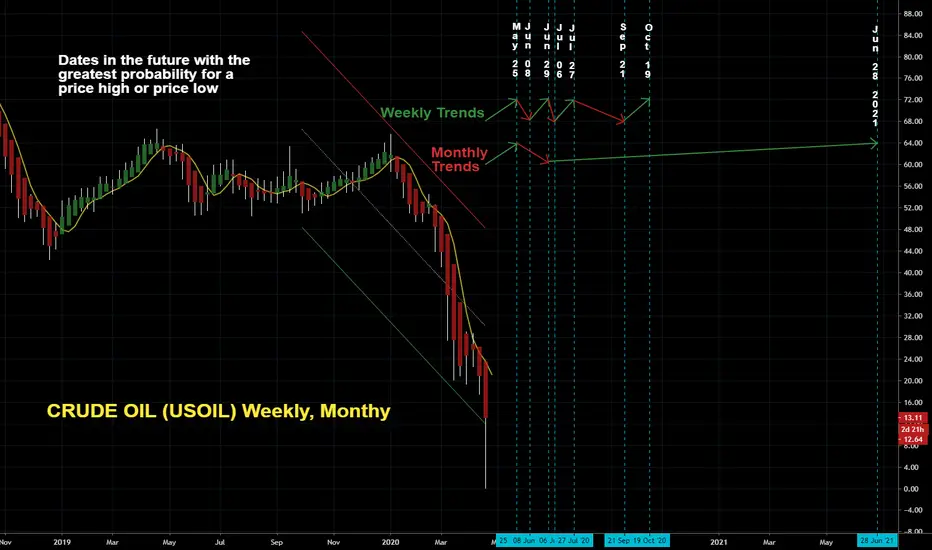
CRUDE OIL (USOIL) Weekly, MonthyDates in the future with the greatest probability for a price high or price low.
The Djinn Predictive Indicators are simple mathematical equations. Once an equation is given to Siri the algorithm provides the future price swing date. Djinn Indicators work on all charts, for any asset category and in all time frames. Occasionally a Djinn Predictive Indicator will miss its prediction date by one candlestick. If multiple Djinn prediction dates are missed and are plowed through by same color Henikin Ashi candles the asset is being "reset". The "reset" is complete when Henikin Ashi candles are back in sync with Djinn price high or low prediction dates.
One way the Djinn Indicator is used to enter and exit trades:
For best results trade in the direction of the trend.
The Linear Regression channel is used to determine trend direction. The Linear Regression is set at 2 -2 30.
When a green Henikin Ashi candle intersects with the linear regression upper deviation line (green line) and both indicators intersect with a Djinn prediction date a sell is triggered.
When a red Henikin Ashi candle intersects with the linear regression lower deviation line (red line) and both indicators intersect with a Djinn prediction date a buy is triggered.
This trading strategy works on daily, weekly and Monthly Djinn Predictive charts.
Trades made when the weekly and monthly arrows are pointing in the same direction are the most profitable.
This is not trading advice. Trade at your own risk.
USO is crashing again. Bottom around 1.92 or 0.95?As suggested some time ago, an extended 5th could occur in USO... and it's happening. We may bottom around $1.92 or $0.95. Currently at $2.6 in pre market. This is possibly one of the most dangerous falling knife ever :knife:
