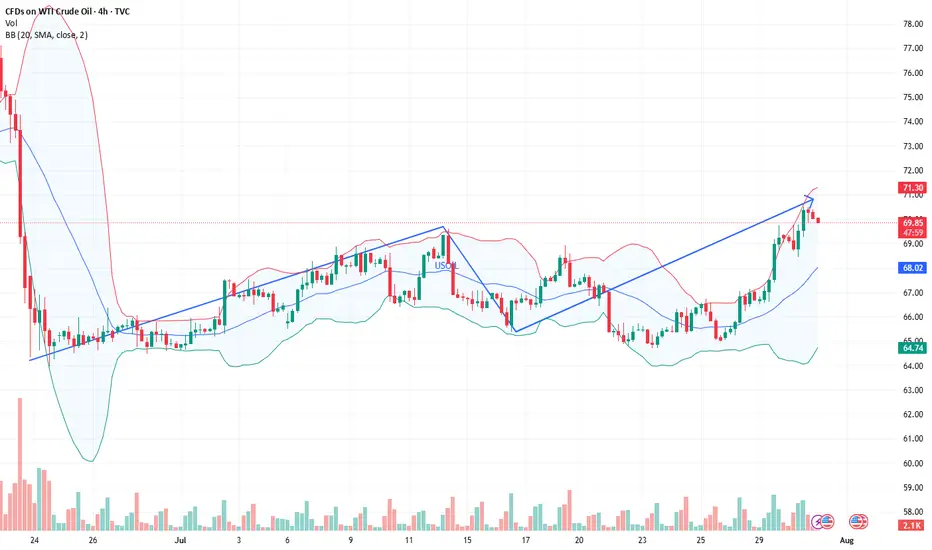
Is the surge in crude oil bulls here a comeback?The news-driven support for crude oil's recent rally is almost exhausted, so we'll continue to adopt a buy-low-sell-high strategy today, using a small stop-loss to maximize profits.
Short at $71.20, with a stop-loss at $71.70 and a take-profit at $69.20. (For aggressive shorting, try shorting at $70.95).
The above strategy is Charlie's personal opinion and is for reference only. If you follow suit, please be cautious and use a stop-loss to protect your position. TVC:USOIL FOREXCOM:USOIL TRADU:USOIL TRADU:USOIL
Usoillong
LONG ON USOIL OIL has just completed a sweep of sell side liquidity, leaving behind lots of BUY side liquidity.
DXY is falling on top of economic news stating trump will possibly fire Jerome Powell.
All this with OPEC increase oil production.
I expect oil to make a $5-$10 move throughout the rest of the week.
That's 500-1000 pips!

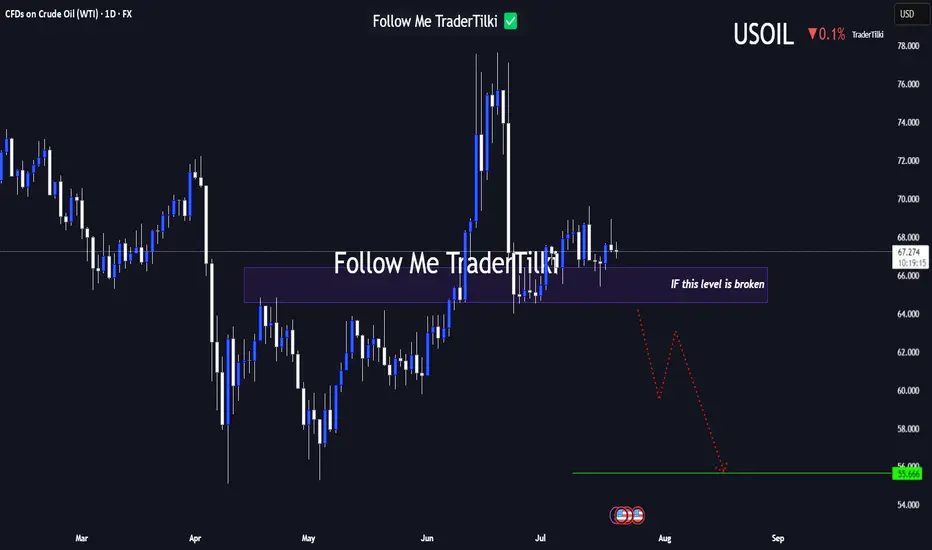
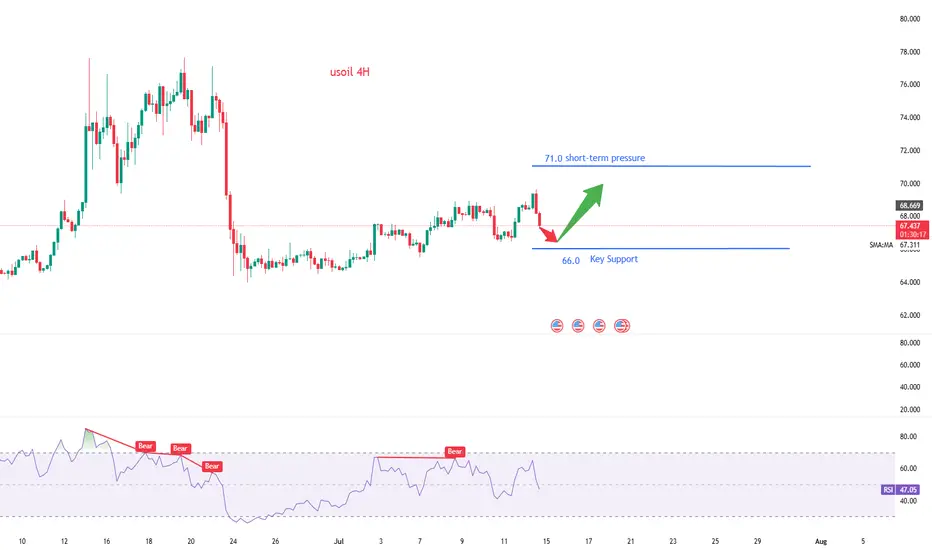
USOIL Under Technical Pressure: 1D Timeframe Breakdown Hey Guys,
The 66.584 level currently stands as the strongest support zone for USOIL. If this level breaks with a candle close, the next major target could drop to 55.666.
This setup is based on the 1-day timeframe. I highly recommend keeping a close watch on that key level.
Every like from you is my biggest motivation to keep sharing these insights. Thanks so much to everyone who’s showing support!
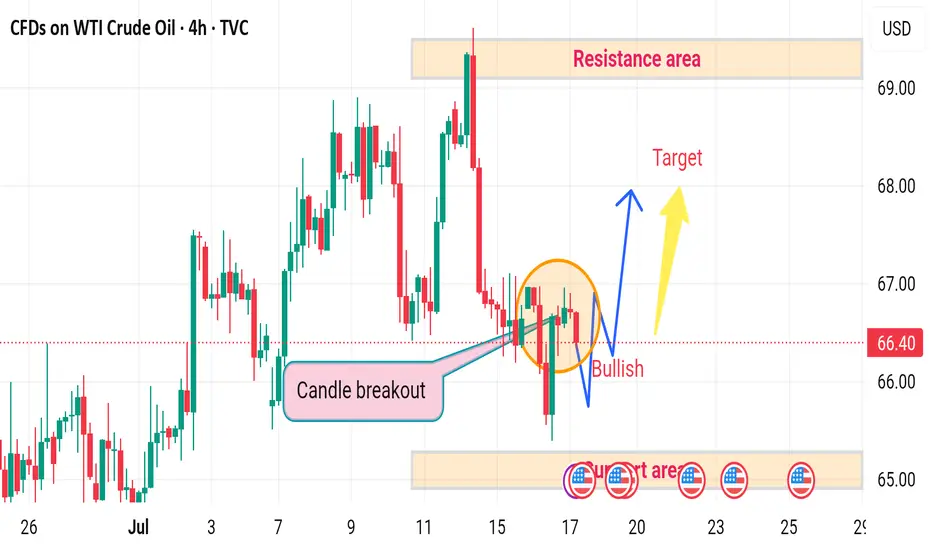
USOIL H4 bullish upward ⚠️ Disrupted Analysis – WTI Crude Oil (4H Chart)
🔻 Bearish Pressure Re-Entering
Despite a temporary candle breakout, the price failed to sustain above the breakout trendline.
The recent price action inside the orange circle shows lower highs and rejection wicks, indicating bullish weakness.
📉 Potential Breakdown Risk
If the price fails to hold above 66.00, there's a high probability of it breaking below the support area around 64.80–65.00, leading to:
Increased bearish momentum
Retesting lower demand zones, possibly around 63.50–64.00
❌ Resistance Area Still Valid
The Resistance area at 68.00–69.00 remains unchallenged.
The "Target" shown is optimistic under current momentum.
Without strong volume and bullish candles, that target remains unlikely in the near term.
🔁 Disruption Summary
The bullish breakout is likely a false breakout.
Market may be forming a bull trap.
Watch for a clean break below 65.00 for confirmation of a bearish reversal.
Crude oil rebounds after a correction!International oil prices continued to climb on Monday, though the gains were limited. Brent crude futures rose 8 cents to $70.44 per barrel, extending Friday's 2.51% rally. U.S. WTI crude edged up 5 cents to $68.50 per barrel, after surging 2.82% in the previous trading session.
The primary driver behind the current upward move stems from market expectations of further escalation in U.S. sanctions against Russia. U.S. President Trump stated on Sunday that he would provide Ukraine with the "Patriot" air defense missile system and deliver a "major announcement" on Russia-related issues on Monday. "Trump is dissatisfied with the Russian President's failure to advance the peace process, a stance exacerbated by Russia's continued bombing of Ukrainian cities in recent days.
In the short term (1-hour timeframe), crude oil has shown high volatility, with prices finding support at the lower edge of the wide trading range and moving higher again. The objective short-term trend direction is upward within the range, with sufficient bullish momentum. However, given the high probability of recent erratic price swings, there is a greater likelihood that intraday crude oil prices will encounter resistance at the upper edge of the range and pull back.
you are currently struggling with losses,or are unsure which of the numerous trading strategies to follow,You have the option to join our VIP program. I will assist you and provide you with accurate trading signals, enabling you to navigate the financial markets with greater confidence and potentially achieve optimal trading results.
Strong USOIL Setup: Long from Support + 4.34 R/RHey Guys, hope you're all doing well!
I've placed a limit buy order on USOIL from a key support level. Below are the relevant levels for your reference:
- 🔵 Entry Level: 67.424
- 🔴 Stop Loss: 66.803
- 🟢 Target 1 (TP1): 67.908
- 🟢 Target 2 (TP2): 68.456
- 🟢 Target 3 (TP3): 70.036
📊 Risk/Reward Ratio: 4.34
Your likes and support are what keep me motivated to share these analyses consistently.
Huge thanks to everyone who shows love and appreciation! 🙏

USOIL:Today's Trading Strategy
Oil prices have signs of upward breakthrough at present, yesterday's trend broke the short - term narrow range of shock range, on the idea of retracting to do more. The more appropriate long point is 66-66.3, if short, the more appropriate point is 67-67.4, but the short position is recommended not to be too heavy, not to do less than the point.
Trading Strategy:
SELL@67-67.4
TP: 66-66.3
BUY@66-66.3
TP: 67.5-68
More detailed strategies and trading will be notified here ↗↗↗
Keep updated, come to "get" ↗↗↗

USOIL : What will happen to the price of oil?Hello friends
As you can see, we had support in the past, which has now become a strong resistance for the price after it was broken.
Now we need to see if the price will manage to break it at this moment when it is close to its key and sensitive resistance.
*Trade safely with us*

USOIL:Narrow trading strategy
USOIL: There is no update in the past two days, because the oil price still continues to fluctuate in a narrow range, and the space for volatility is gradually reduced, which is not very different from our overall trading idea. The original long target of 65.9-66.4 can be adjusted to 65.8-66.2 with the reduction of the space for volatility. It is expected that the trend will come out this week, and we will adjust our thinking then.
Friends who do not trade at present can refer to the interval trading strategy within a day:
BUY@64.7-65
TP: 65.8 to 66.2
SELL@65.8-66.2
TP: 64.7-65
More detailed strategies and trading will be notified here ↗↗↗
Keep updated, come to "get" ↗↗↗

USOIL:Today's trading strategy
Oil prices have been sideways for the fourth trading day, volatility began to narrow, the market is brewing a new round of trend, short-term range 64-66.4. Today you can sell high and buy low around a narrow range.
Trading Strategy:
BUY@64.7-65.1
TP: 65.9-66.4
SELL: 66-66.4
TP: 65.1-64.5
More detailed strategies and trading will be notified here ↗↗↗
Keep updated, come to "get" ↗↗↗

#USOIIL #WTI 1H📈 #USOIL 1H Buy Setup – Liquidity Sweep in Play
Crude Oil is consolidating after a sharp decline, forming a potential setup for a liquidity sweep below the current range, followed by a bullish reversal. We're anticipating a fakeout move to grab sell-side liquidity before price targets the Fair Value Gap (FVG) and premium supply zone above.
🟩 Buy Limit: 64.50 / 64.00
🎯 Targets: 70.00 → 72.00+
❌ Stop Loss: 63.00
This setup offers high risk-to-reward potential if the liquidity sweep plays out as expected. Monitor price action closely at the buy zone.
#CrudeOil #WTI #SmartMoney #TradingStrategy

USOIL:Go long
usoil: Let's start with a short-term rebound.
Trading idea:
BUY@64.8-65.2
TP: 66-66.4
More detailed strategies and trading will be notified here ↗↗↗
Keep updated, come to "get" ↗↗↗

LONG ON OILUSOIL is consolidating at a major demand area.
We have a small choc (change of character) from down to up on the lower timeframe.
I will be buying oil to the next supply level looking to catch 500-1000 pips.

USoilLatest news. If the Strait of Hormuz is closed, the restrictions on the import and export of oil and natural gas will increase greatly. Because 20% of the world's oil and natural gas exports come from the Strait of Hormuz. So the trend of geopolitics will affect the closing and opening of this important checkpoint. If the increase in geopolitics really reaches this point, the price of oil may rise to 90$-100$. This is an excellent trading opportunity for investors who like to trade oil. But at present, this is an option for Iran to negotiate. Rather than a real closure, after all, the incident has not developed to this situation. If you like to trade oil. You can also follow me. Get brand new trading opportunities and make profits. Do not trade independently to avoid losses.

USOIL Expected to Rebound to the 68–70 ZoneUSOIL has shown signs of short-term overselling, and a technical rebound is likely during today’s session. Traders participating in crude oil can consider buying on dips, focusing on short-term opportunities with proper position management. Quick entries and exits are recommended.

Crude Oil Strategy LayoutThe rise in oil prices on Monday will not only push up household daily expenses such as fuel and heating costs, but also increase corporate operating costs, which may in turn suppress consumption and investment activities. Ellen Zentner, Chief Economic Strategist at Morgan Stanley, pointed out in a Sunday analysis that against the backdrop of the Trump administration's high tariff policies, the U.S. economy was already facing pressure from a slowdown in growth, and the further increase in oil prices would exert "powerful pressure" on household consumption capacity. This may not only weaken consumers' willingness to purchase, but also drag down the pace of overall economic growth.
Crude oil showed a gap-up and then decline trend today, falling sharply from around $77.7. Oil prices gradually corrected today, with the lowest point touching around $72.5 and hovering there. Currently, oil prices are hovering above the support level of 72.0, which is expected to be the bottom support of the box movement. Taken together, crude oil is in a high-range consolidation. In terms of operation, it is considered to lay out long positions on pullbacks.
you are currently struggling with losses,or are unsure which of the numerous trading strategies to follow,You have the option to join our VIP program. I will assist you and provide you with accurate trading signals, enabling you to navigate the financial markets with greater confidence and potentially achieve optimal trading results.
Trading Strategy:
buy@72.0-72.5
TP:75.0-75.5

Crude Oil Market Trend Forecast for Next WeekThe oil price continued its upward trend this week, despite a brief correction on Friday. As of Friday's Asian session, Brent crude oil futures dropped by $1.57, or 2%, to $77.28 per barrel. However, the cumulative weekly gain reached 3.9%, marking three consecutive weekly increases. Geopolitical risks continued to fuel market sentiment. Oil prices surged nearly 3% on Thursday after Israel bombed Iranian nuclear targets, following Iran's missile strikes on Israel after its earlier missile attack on an Israeli hospital. The focus of the current crude oil market has shifted entirely from supply-demand fundamentals to geopolitical risks. Although Iran's crude oil exports have not been substantially disrupted, investors have started to price in the worst-case scenario. If the situation further deteriorates and affects shipping routes through the Strait of Hormuz, global energy prices may face a new round of sharp volatility.
In the short term, oil prices still exhibit upward potential, with the current trend maintaining an overall upward trajectory. The MACD indicator's fast and slow lines overlap with bullish bars above the zero axis, signaling robust bullish momentum. This suggests that the medium-term trend is expected to usher in an upward rally.
you are currently struggling with losses,or are unsure which of the numerous trading strategies to follow,You have the option to join our VIP program. I will assist you and provide you with accurate trading signals, enabling you to navigate the financial markets with greater confidence and potentially achieve optimal trading results.
Trading Strategy:
buy@72.0-72.5
TP:75.0-75.5

USOIL:Waiting to go long
The impact of the news is still continuing, the situation did not ease in a short period of time, there is still a rise, the above large space to see 76-77, trading ideas on the long space and advantages are greater. Intraday short - term trading to consider low long.
Trading Strategy:
BUY@72.8-73.2
TP: 74.5-75
More detailed strategies and trading will be notified here ↗↗↗
Keep updated, come to "get" ↗↗↗

Will oil prices fall after the sharp surge in crude oil?Oil prices corrected under the dual pressure of news-driven factors and inventory data. Brent crude oil futures traded in a narrow range, reaching $76.38 per barrel, while WTI July contracts edged down to $73.35 per barrel. With intensified geopolitical uncertainties, market sentiment remains dominated by wait-and-see attitudes. The unexpected increase in EIA crude oil inventories dampened market optimism. According to the latest data from the U.S. Energy Information Administration (EIA), crude oil inventories in the U.S. increased by 2.6 million barrels for the week ending June 14, far exceeding the market expectation of a 1.1 million barrel decline, indicating weak demand. The rebound in inventories has exerted downward pressure on oil prices.
Oil prices have repeatedly crossed the moving average system, with the short-term objective trend showing a range-bound rhythm. In terms of momentum, the MACD indicator is intertwined near the upper side of the zero axis, reflecting weak bullish momentum. It is expected that crude oil prices will mainly maintain a consolidative pattern, with the trading range between 79.00 and 73.00.
you are currently struggling with losses,or are unsure which of the numerous trading strategies to follow,You have the option to join our VIP program. I will assist you and provide you with accurate trading signals, enabling you to navigate the financial markets with greater confidence and potentially achieve optimal trading results.
Trading Strategy:
buy@75.0-76.0
TP:78.0-79.0

Analysis of the latest crude oil market trendCrude oil prices stabilized after a sharp rise on Tuesday, with the market keeping a close eye on the potential escalation of conflicts in the Middle East. According to market surveys, Iran's crude oil export infrastructure has not been directly hit so far, and most of the impacts are still concentrated on shipping. However, analysts point out that if the conflict spreads to the entire region, oil prices are likely to rise further significantly. The current rise in crude oil prices is not only dominated by actual supply and demand but is highly influenced by geopolitics. Market sentiment is extremely vulnerable to disturbances from external events. As the global energy artery, the stability of the Strait of Hormuz provides strong support for oil prices. When the uncertainty of the geopolitical situation intensifies, attention should be paid to the release of U.S. official inventory data and the development of diplomatic processes.
Technical analysis of crude oil: The moving average system is in a bullish arrangement, and the medium-term objective trend direction is upward. The current trend is in the rhythm of the main upward trend. The fast and slow lines of the MACD indicator coincide with the bullish columns above the zero axis, indicating that the bullish momentum is currently full. It is expected that the medium-term trend is expected to usher in a rising rhythm.
you are currently struggling with losses,or are unsure which of the numerous trading strategies to follow,You have the option to join our VIP program. I will assist you and provide you with accurate trading signals, enabling you to navigate the financial markets with greater confidence and potentially achieve optimal trading results.
Trading Strategy:
buy@72.0-72.5
TP:74.0-74.5

USOIL:Go short before you go long
The idea of crude oil is still to go long. Today, the more appropriate entry point is 72-72.3, there is still a little space at present, if you consider selling short first, then the more appropriate short point is 73-73.3 range. Give to the point to do, to wait to do more.
Trading Strategy:
SELL@73-73.3
TP: 72-72.3
BUY@72-72.3
TP: 73.7-74
↓↓↓ More detailed strategies and trading will be notified here ↗↗↗
↓↓↓ Keep updated, come to "get" ↗↗↗

USOIL:A long trading strategy
Oil prices also fell sharply under the stimulus of the news, and then completed the correction rebound in the sub-session, and now back to around 71 again. The current trend is in the upward rhythm of the main trend, and it is expected that the trend of crude oil will be mainly in the form of shock consolidation.
Trading ideas than yesterday did not change too much, adjust the appropriate profit point.
Trading Strategy:
BUY@70.5-70.8
TP: 71.8-72.3
↓↓↓ More detailed strategies and trading will be notified here ↗↗↗
↓↓↓ Keep updated, come to "get" ↗↗↗

USOIL 1 - Hour Chart AnalysisUSOIL 1 - Hour Chart Analysis
Key Levels
Support: ~69.50 (short - term), 67.70 (critical backup).
Resistance: 73.50 (major hurdle, tested before).
Trend, Pattern & Middle East Conflict
Price oscillates between support/resistance, with a potential “V - shaped reversal”. Middle East conflicts add high uncertainty:
Escalation: Fears of supply cuts could push price above 73.50 rapidly.
De - escalation: May pressure price down, but 67.70/69.50 still get support from lingering supply - risk worries.
Trading Strategies
Bullish: If 69.50 holds (e.g., long lower shadows/bullish candles), small - size long. Target 73.50; stop - loss ~69.20. Watch for sudden conflict news.
Bearish: If 69.50 breaks (consecutive closes below), short. Target 67.70; stop - loss ~69.80. Stay alert to conflict updates.
Note: Oil prices hinge on supply - demand, Middle East tensions, and the USD. Combine tech/fundamental analysis; manage risk strictly.
⚡️⚡️⚡️ USOil ⚡️⚡️⚡️
🚀 Buy@ 70.50 - 71.00
🚀 TP 73.00 - 74.00
Accurate signals are updated every day 📈 If you encounter any problems during trading, these signals can serve as your reliable guide 🧭 Feel free to refer to them! I sincerely hope they'll be of great help to you 🌟 👇
