Usoillong

CRUDE OIL intraday trading & flying to the moom 🚀 10 NOV 2022CRUDE OIL intraday trading alert
3 steps must fulfill before entry
1. 1st breakout done
2. Retracement done
3. 2nd breakout and see you in the SKY 🚀
More info in my profile..
Good luck traders..

CRUDE OIL intraday trading & flying to the moom 🚀 08 NOV 2022CRUDE OIL intraday trading alert
3 steps must fulfill before entry
1. 1st breakout done
2. Retracement done
3. 2nd breakout and see you in the SKY 🚀
More info in my profile..
Good luck traders..

USOIL - Retracement expected ✅Hello traders!
‼️ This is my analysis on USOIL .
Here we are bullish from all timeframes perspective, so I am looking only for longs. I expect price to make a retracement to fill the imbalance below and then to reject from bullish orderblock.
Like, comment and subscribe to be in touch with my content!

USOIL - Bullish price action ✅Hello traders!
‼️ This is my analysis on USOIL .
Here we are bullish from all timeframes perspective, so I am looking only for longs. I expect the continuation of bullish price action after the change of character and rejection from bullish orderblock.
Like, comment and subscribe to be in touch with my content!

USOIL TRADE IDEA 1 UPDATEUSOIL has formed a SYMMETRCIAL TRIANGLE DTF.
Secondly the asset is in the process of trying to break through the 0.618 Fib level, has had multiple failed attempts.
I have give Bear and Bull TARGETS.

USOil | New perspective for the week | Follow-up detailThe OPEC+ production cut from two weeks ago is yet to reflect the anticipated consequence in the market as price action appears to be completing the retracement of the previous impulse leg that started a couple of weeks ago. A breakout of the $86 mark this week will be a signal for me to buy the USOil.
Risk Disclaimer:
Margin trading in the foreign exchange market (including commodity trading, CFDs, stocks etc.) has a high risk and is not suitable for all investors. The content of this speculation (including all data) is organized and published by me for the sole purpose of education and assistance in making independent investment decisions. All information herein is for your reference only and I take no responsibility.
You are hereby advised to carefully consider your investment experience, financial situation, investment objective, risk tolerance level, and consult your independent financial adviser as to the suitability of your situation prior to making any investment.
I do not guarantee its accuracy and is not liable for any loss or damage which may result directly or indirectly from such content or the receipt of any instruction or notification therewith.
Past performance is not necessarily indicative of future results.

US OIL BUY IDEAHello Traders!!!
So sorry this one is coming late been off the charts for some hours now just set the limit and went off.
So we have seen the US oil make a clear bullish impulsive leg creating our very first choch on the higher timeframes and we have seen it making the retracement back into this demand zone with our classic ABC pattern and we have decided to buy from that zone. And watch the market create a new higher high.
Cheers!!!
Under Cover Trading
Swing Trading Simplified!!!!

USOil | New perspective for the week | Follow-up detailFollowing the OPEC+ decision to cut oil production 2 weeks; we have witnessed an increase in the price of crude oil. However, during last week's trading session, there was a drop in oil prices which could be a s a result of "take profit" activities and we still do not know how far the retracement move will go. It appears that the fears of recession and weak oil demand, especially in China, is outweighing the move to cut oil production at the moment, but from a technical standpoint, this video explains where to look out for buying opportunities that is likely going to be inciting the second phase of the bullish momentum that started two weeks ago.
Disclaimer:
Margin trading in the foreign exchange market (including commodity trading, CFDs, stocks etc.) has a high risk and is not suitable for all investors. The content of this speculation (including all data) is organized and published by me for the sole purpose of education and assistance in making independent investment decisions. All information herein is for your reference only and I take no responsibility.
You are hereby advised to carefully consider your investment experience, financial situation, investment objective, risk tolerance level, and consult your independent financial adviser as to the suitability of your situation prior to making any investment.
I do not guarantee its accuracy and is not liable for any loss or damage which may result directly or indirectly from such content or the receipt of any instruction or notification therewith.
Past performance is not necessarily indicative of future results.


As the price broke above the downtrend and retested with a HummeAs the price broke above the downtrend and retested with a Hummer candle

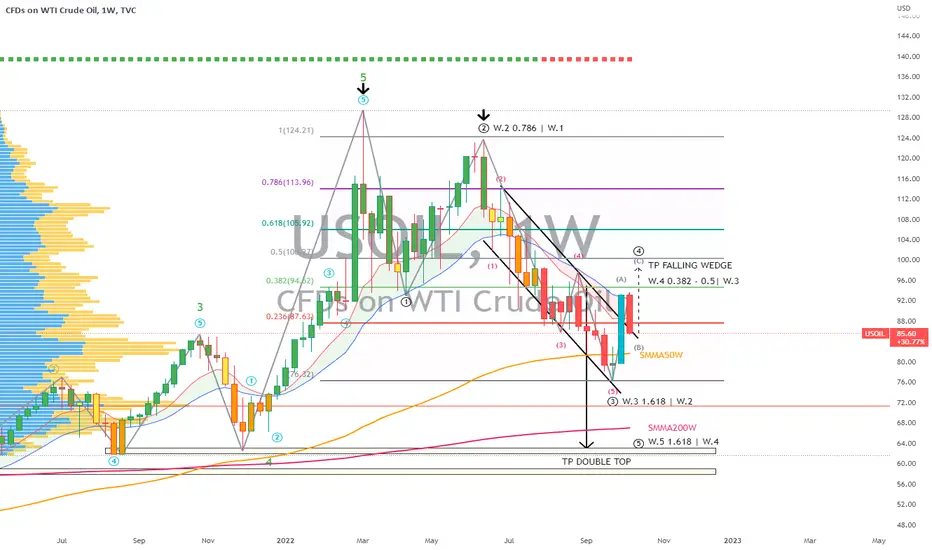
USOIL | Wave Analysis | Possible 4-Wave Long DetourPrice action and chart pattern medium term outlook on weekly timeframe
> Wave Pattern - ABC correction after completing 3-wave 1.618 extension of 1-wave within the C leg, now taking a detour uptrend 4-wave estimated 0.382 - 0.5 retracement between 95 - 100 USD. The final target downtrend price could be about MA200W and Head & Shoulders target zone at 60++ USD as key level support.
USOil | New perspective for the week | Follow-up detailOPEC+ had its first physical meeting since the pandemic last Thursday and has decided to cut oil production which is definitely going to have an immense impact on price movement in the coming week(s). The impact of this event could be seen on the chart as we witnessed a significant breakout of the key level at $86.00 to set a bullish tone against the new week as Crude oil continues to soar on the wave of this decision.
Risk Disclaimer:
Margin trading in the foreign exchange market (including commodity trading, CFDs, stocks etc.) is high-risk and unsuitable for all investors. The content of this speculation (including all data) is organized and published by me for the sole purpose of education and assistance in making independent investment decisions. All information herein is for your reference only and I take no responsibility.
You are hereby advised to carefully consider your investment experience, financial situation, investment objective, risk tolerance level, and consult your independent financial adviser as to the suitability of your situation prior to making any investment.
I do not guarantee its accuracy and is not liable for any loss or damage which may result directly or indirectly from such content or the receipt of any instruction or notification therewith.
Past performance is not necessarily indicative of future results.

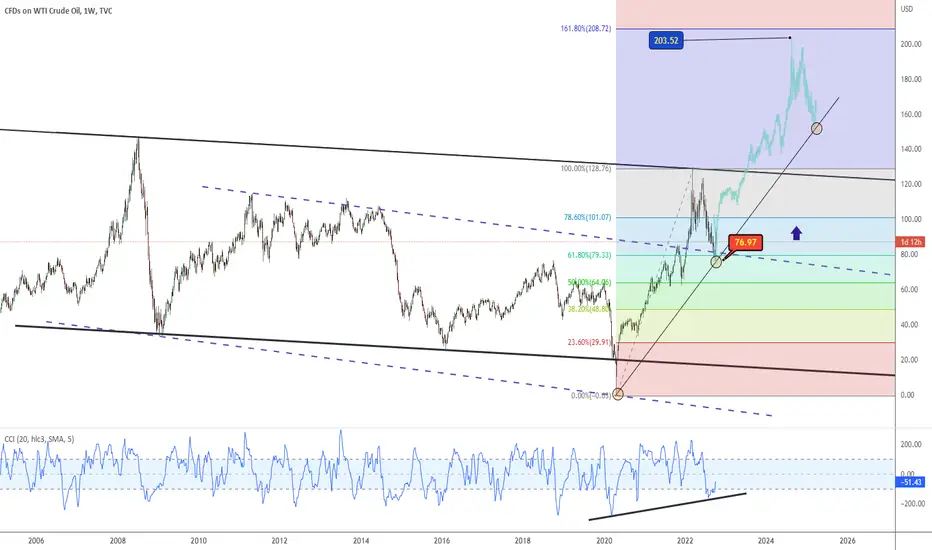
Long Opportunity on US OIL,is 200 USD next target ?!According to Fibonacci Extension
Price Move channel
CCI Convergence


USOIL ! Daily analysis bullish or bearish ? Short rules are simple: don't force trade against terend, with a clear HL-LL structure. Then, at the red level, is sell zone. momentum is looking price fail to make a higher high, then go to entry short.
traders need to enter short at that level, as a red engulfing reversal candle appears at that point.
verify a lower timeframe for the best analysis and wait until short confirmation.
Must wait for more signals as a confirmation candle, otherwise
Long rules are simple: If you get high risk, high reward. Then wait for the break red zone, with massive bullish momentum


USOIL ! Trading within a important zone, long trade idea USOIL get support at 77 level and up, USOIL has a bullish form. But oil can't breakout resistance level, looking trading consolidation zone. We need to wait because above this level, the price may get rejection and down or breakout and up

USOIL possilbe long for 83.0027th September daily inside bar range confined with the previous bar range. 28th September daily insurance bar dictating strength ahead for oil price. Demand zone 77.20-76.20. stop loss 75.70, target: 83.00

USOIL ! Is this the end of the oil down ? long trade idea.Oil prices have fallen in last few weeks, but the bullish trend continues for a long term. If USOIL get shows a support at the level of 74.20 and bullish forming, I open long trade.
Why oil is still bullish ?
1. World oil production rose 790 kb/d in August to 101.3 mb/d, with a strong recovery in Libya and smaller gains from Saudi Arabia and the UAE offset by losses in Nigeria, Kazakhstan and Russia. From August through December, growth is forecast to slow, edging up by just 280 kb/d to 101.6 mb/d. In 2022, global production is forecast to rise by 4.8 mb/d, to 100.1 mb/d, and by 1.7 mb/d in 2023 to 101.8 mb/d.
2. Geo-political events
The geopolitics of oil and gas can be viewed as resulting from the balance between supply and demand, which affects the power dynamics between energy exporters and importers, energy security, and the military strength of major powers

2609 Euro-NY SESSION USOIL possible to test 80-81 againHello traders,
USOIL has a stong bearish trend last Friday which hit our last STOP LOSS.
Now in the EURO session on Monday, it seems possible to make a retracement on for sellers. It continue to drop in Japan session and down to make a new low at the beginning of EURO SESSION.
On 1h CHART, it is possible to reach last high again before making a new high or keep sideways price action.
ABC wave on this chart is the most ideal way for intraday buyers.
The target zone up there would be a position for traders to buy again or keep selling .
GOOD LUCK ON THIS PLAN .
LESS IS MORE!

2209 USOIL stop dropping and making reverseHello traders,
USOIL is making a reverse on 4H chart. If it can make a strong bullish candle on Daily chart today, we can think about a longer time bullish trend for USOIL.
On the 4H chart, it makes higher low and break the 4h trend line.
It need to make a new high on 4H chart to confirm the assumption that it will start to bull again on 4h chart.
Take a good chance to trade 4H swing first.
GOOD LUCK!!!
LESS IS MORE!
