WTI Oil Heist: Bullish Breakout Plan for Big Gains!🚨 Ultimate WTI Oil Heist Plan: Bullish Breakout Strategy for Big Profits! 🚀💰
🌟 Hello, Wealth Chasers & Market Mavericks! 🌟
Hola, Bonjour, Hallo, Marhaba! 🗺️
Get ready to execute the Ultimate WTI / US Oil Spot Heist using our 🔥 Thief Trading Style 🔥, blending sharp technicals with powerful fundamentals! 📈💡 This swing trade plan targets the energy market’s bullish potential, but stay sharp—volatility lurks! 🚨 Follow the chart setup for a long entry, and let’s aim for those juicy profits while dodging the high-risk ATR zone where the market “police” might trap overzealous traders. 🏦⚠️
📊 The Heist Plan: WTI / US Oil Spot (Swing Trade)
Entry 📈:
The breakout is your signal! 🎯 Wait for the Moving Average crossover and a confirmed pullback at $68.00 on the 2H timeframe. Once it triggers, go long and ride the bullish wave! 🐂 Set an alert to catch the breakout in real-time. 🚨
Stop Loss 🛑:
Protect your capital like a pro! 💪 Place your stop loss below the recent swing low at $65.00 (2H timeframe, candle body wick). Adjust based on your risk tolerance, lot size, and number of positions. Rebels, beware—straying too far from this level could burn you! 🔥
Target 🎯:
Aim for $73.80 or exit early if momentum fades. Scalpers, stick to long-side trades and use a trailing stop to lock in gains. 💰 Swing traders, follow the plan and secure profits before the market consolidates or reverses. 🏴☠️
📊 Market Context & Key Drivers
The WTI / US Oil Spot market is currently consolidating with a bullish bias 🐂, driven by:
Fundamentals: Check macroeconomic data, seasonal trends, and intermarket correlations. 📉
COT Report: shows net-long positions increasing, signaling bullish sentiment. 📅
Sentiment & Quantitative Analysis: Market mood leans positive, but overbought risks loom near the ATR zone. ⚠️
Stay informed! 📰 Monitor news releases, as they can spike volatility. Avoid new trades during major announcements and use trailing stops to protect open positions. 🔒
📊 Pro Tips for the Heist
Scalpers: Go long with tight trailing stops to safeguard profits. 💸
Swing Traders: Stick to the plan, adjust stops based on risk, and exit before the high-risk ATR zone ($73.80+). 🚪
Risk Management: Never risk more than you can afford. Tailor your lot size and stop loss to your account size. 🛡️
Stay Updated: Market conditions shift fast—keep an eye on fundamentals and sentiment to stay ahead. 👀
📊 Why Join the Heist?
This Thief Trading Style plan is your ticket to navigating the WTI market with confidence! 💪 Boost this idea to strengthen our trading crew and share the wealth-making vibe. 🚀💥 Like, follow, and stay tuned for more high-octane strategies! 🤑🐱👤
Disclaimer: This is a general market analysis, not personalized investment advice. Always conduct your own research and consider your risk tolerance before trading. Markets are dynamic—stay vigilant and adapt to new developments. 📡
Let’s make this heist legendary! 🌟💰 See you at the next breakout! 🤝🎉
Usoilprediction

USOIL : What will happen to the price of oil?Hello friends
As you can see, we had support in the past, which has now become a strong resistance for the price after it was broken.
Now we need to see if the price will manage to break it at this moment when it is close to its key and sensitive resistance.
*Trade safely with us*

Bulls on the Loose: US Oil Spot/WTI Heist Strategy! 🚨💰 THE OIL VAULT HEIST: US OIL SPOT/WTI TRADING STRATEGY 💸🔫
🌟Hi! Hola! Ola! Bonjour! Hallo! Marhaba!🌟
Dear Money Makers & Robbers 🤑💰💸✈️
Based on our 🔥Thief Trading style analysis🔥 (both technical and fundamental), here’s the master plan to heist the US Oil Spot/WTI Energy Market. Follow the blueprint carefully—this strategy focuses on long entries, with a daring escape planned near the high-risk Red ATR line Zone where bearish robbers and consolidation traps await. 🏆💸 Take your profit and treat yourself, fellow traders—you earned it! 💪🏆🎉
🕵️♂️ Entry 📈
💥 The vault is wide open! Time to swipe that bullish loot—heist is on!
Place buy limit orders within the 15 or 30-minute timeframe, near swing lows/highs for pullback entries.
🛑 Stop Loss 🛑
📍 Thief’s SL—recent swing low and below the moving average (4H timeframe) for day/swing trades.
📍 Adjust SL based on risk, lot size, and number of orders.
🎯 Target
🏴☠️💥 69.000 (Aim for the big loot!) OR escape before the target
🔥 Market Heist Overview
The UK Oil Spot/Brent market is currently showing bullishness 🐂, driven by key factors—perfect for a day/scalping trade robbery! ☝☝☝
📰 Additional Tools & Analysis
📊 Get the Fundamental, Macro, COT Report, Quantitative Analysis, Sentiment Outlook, Intermarket Analysis, Future Targets—check our bi0 liinks 👉👉👉🔗🔗
⚠️ Trading Alert: News Releases & Position Management
📰 News can rattle the vault! 💥
✅ Avoid new trades during news releases.
✅ Use trailing stop-loss orders to protect profits.
💖 Supporting our heist plan?
💥 Smash the Boost Button 💥 to empower the robbery team.
Let’s make money every day in this market with the Thief Trading Style! 🏆💪🤝❤️🎉🚀
👀 Stay tuned for the next robbery plan, thieves! 🤑🐱👤🤗🤩
USOIL:Go long
usoil: Let's start with a short-term rebound.
Trading idea:
BUY@64.8-65.2
TP: 66-66.4
More detailed strategies and trading will be notified here ↗↗↗
Keep updated, come to "get" ↗↗↗

USoilLatest news. If the Strait of Hormuz is closed, the restrictions on the import and export of oil and natural gas will increase greatly. Because 20% of the world's oil and natural gas exports come from the Strait of Hormuz. So the trend of geopolitics will affect the closing and opening of this important checkpoint. If the increase in geopolitics really reaches this point, the price of oil may rise to 90$-100$. This is an excellent trading opportunity for investors who like to trade oil. But at present, this is an option for Iran to negotiate. Rather than a real closure, after all, the incident has not developed to this situation. If you like to trade oil. You can also follow me. Get brand new trading opportunities and make profits. Do not trade independently to avoid losses.

USOIL:A long trading strategy
Oil prices also fell sharply under the stimulus of the news, and then completed the correction rebound in the sub-session, and now back to around 71 again. The current trend is in the upward rhythm of the main trend, and it is expected that the trend of crude oil will be mainly in the form of shock consolidation.
Trading ideas than yesterday did not change too much, adjust the appropriate profit point.
Trading Strategy:
BUY@70.5-70.8
TP: 71.8-72.3
↓↓↓ More detailed strategies and trading will be notified here ↗↗↗
↓↓↓ Keep updated, come to "get" ↗↗↗

USOIL:Go long
USOIL: Short-term momentum is still dominant, the trend of crude oil is expected to maintain a high shock upward rhythm.
Trading Strategy:
BUY@70.5-71
TP: 73-73.6
↓↓↓ More detailed strategies and trading will be notified here ↗↗↗
↓↓↓ Keep updated, come to "get" ↗↗↗

USOIL:Go long
Stay on the long side.
Trading Strategy:
BUY@71.8-72.3
TP: 74-74.3
↓↓↓ More detailed strategies and trading will be notified here ↗↗↗
↓↓↓ Keep updated, come to "get" ↗↗↗

USOIL:Go long
USOIL:Crude oil rose sharply under the tension in the Middle East, the early repeatedly suggested that the continuous low shock after the upward breakthrough, the time of storage force is long enough, especially the watershed 64.8 break after the rising space has been opened, the trading idea is still to step back and do long.
Trading Strategy:
BUY@66.9-67.2
TP: 68.6-69
↓↓↓ More detailed strategies and trading will be notified here ↗↗↗
↓↓↓ Keep updated, come to "get" ↗↗↗

WTI Crude Oil 4H Chart – Bullish Setup from Demand Zone📈 Current Price: $61.74
🔵 Key Zones & Levels
🔹 Demand Zone (Buy Area):
🟦 $59.48 – $61.39
→ Price expected to bounce here
→ 🔄 Potential reversal zone
🔹 Entry Point:
🎯 $61.39
→ Ideal level to enter LONG
→ Just above demand zone
🔹 Stop Loss:
🛑 Below $59.48
→ Exit if price drops here
→ Protects capital
🔹 Target Point:
🚀 $67.00
→ Profit-taking zone
→ Strong resistance zone nearby:
* 66.63
* 66.75
* 67.60
📊 Indicators
📍 EMA (70): 🔴 61.40
→ Price trading above = bullish signal
→ EMA acting as support
📏 Trendline Channel:
🔼 Higher highs & higher lows
→ Supports uptrend continuation
📌 Trade Plan Summary
* Bias: 📈 Bullish
* Buy: At 61.39
* Stop: Below 59.48 🛑
* Target: 67.00 🎯
* Risk-Reward: ✔️ Favorable (~1:3)
🔍 What to Watch
* ✅ Bullish candles in demand zone
* 🔁 Retest of EMA or lower channel
* ❌ Avoid if it breaks below $59.48

USOIL Trade Setup: Watching for a Bullish Break After Pullback 📈 US OIL Trade Plan
Currently, USOIL is in a strong bullish trend 🔥 — price action has pushed into overextended territory, which opens the door for a potential pullback 🌀.
I'm watching for a WTI retracement into equilibrium, ideally aligning with the 50%–61.8% Fibonacci levels from the previous swing low to high 🔍📉. If price corrects into that zone and we find support, followed by a bullish break in market structure 💥 — that would be the confirmation I’m waiting for to consider a long position 🚀.
⚠️ Key Level to Watch: That structure break is the trigger — no confirmation, no trade 🧠.
⚠️ Disclaimer:
This content is for educational and informational purposes only and should not be considered financial advice. Always conduct your own analysis and consult a professional before making trading decisions. Trade responsibly.

USOIL:Wait 63.6-64 to go long
Affected by last week's data, crude oil directly broke through the short-term pressure 64, technical point of view of the daily track upward opening, 64.8 position basically can not hold, and once the break open the space for rise, the rise has just begun;
After breaking from the early continuous shock to a strong unilateral, the market will at least continue a wave of strength, pay attention to 63.6-64 range to do more, or the European market force to rise, the United States is also more, now is to see a strong break.
Trading Strategy:
BUY@63.6-64
TP: 65-65.2
↓↓↓ More detailed strategies and trading will be notified here ↗↗↗
↓↓↓ Keep updated, come to "get" ↗↗↗

USOIL:tay long
USOIL: The short-term objective trend is oscillating. In terms of momentum, the MACD indicator is above the zero axis, showing a top divergence, indicating that the upward momentum is weakening. In the first two trading days, the overall rhythm trend was alternating between primary and secondary, and it is expected that the intraday crude oil trend will still maintain the probability of shock upward, so maintain the long idea.
Trading can wait for the retracement after the long.
Trading Strategy:
BUY@62.8-63
TP: 63.8-64
↓↓↓ More detailed strategies and trading will be notified here ↗↗↗
↓↓↓ Keep updated, come to "get" ↗↗↗

USOIL:Go long
Crude oil prices rose due to ongoing tariff uncertainty as well as ongoing geopolitical tensions in the Middle East.
From the chart, the K line has repeatedly appeared long lower shadow small solid positive line, indicating that the lower buying long support is strong. Expected intraday crude oil short - term trend still exists a wave of upward space.
Trading Strategy:
BUY@62.5-62.6
TP: 63.5-64
↓↓↓ More detailed strategies and trading will be notified here ↗↗↗
↓↓↓ Keep updated, come to "get" ↗↗↗

USOIL:First go short, then go long
USOIL: There are still signs of a pullback on an hourly basis after oil prices climbed to near 63 after OPEC+ said there would be no immediate changes to current production policies.
So the trading strategy :SELL@62.5-62.8 TP@61.6-61.3
After stepping back to the point can not break a wave of rebound, the target can look at 63 again
↓↓↓ More detailed strategies and trading will be notified here →→→
↓↓↓ Keep updated, come to "get" →→→

Crude oil: 63.00 resistance & 60.00 support keyPrices are currently testing the upper resistance at $63.00 📈. These levels are suppressing the price 🔻. A decisive breakthrough above this level may trigger a more intense upward rally 🔥. Meanwhile, recent selling pressure has pushed the price down to $60.60 📉. Watch the pivot support at $60.00, the real downward target 🎯
Crude oil surplus expanded in April, and imports increased, reaching multi - month highs from some countries 🌍. If global benchmark oil prices rise in the future, purchases may be reduced 📉.
Crude oil fell first and then rose today 📊. After a deep dive to $60.9, it stabilized and started to rise 🔼. After the previous price increase and adjustment, it remains to be seen if the upward momentum will continue and break through upwards 🔍.
Overall, on the delivery day, oil prices are volatile 🔼🔽. Watch the resistance at $63.0 on the upside and the support at $60.60 - $60.0 on the downside 👀.
⚡️⚡️⚡️ USOil ⚡️⚡️⚡️
🚀 Sell@ 62.50 - 62.30
🚀 TP 61.50 - 60.60
Accurate signals are updated every day 📈 If you encounter any problems during trading, these signals can serve as your reliable guide 🧭 Feel free to refer to them! I sincerely hope they'll be of great help to you 🌟 👇

WTI Crude Oil (USOIL) Bullish Pullback Setup – Targeting $66.70 Entry Point: Around $62.30 - $62.26
Stop Loss: Set below the entry zone at $61.65, with a potential lower buffer at $60.90
Target Zone (EA TARGET POINT): Between $66.62 and $67.00
A projected gain of 4.22 points (~6.77%)
📈 Price Action & Indicators:
The price had a strong bullish run recently and is now consolidating or pulling back slightly.
The red and blue moving averages (likely short-term and medium-term MAs) show a bullish crossover and trend.
There's a potential bullish setup if the price pulls back to the entry zone and finds support.
The blue curved arrow indicates a projected bounce from the $62.30 support region back up toward the $66.70 target.
🛠️ Strategy Implied:
Wait for pullback to the entry zone (~$62.30).
Enter long at or around that level.
Set Stop Loss at $61.65 to limit downside risk.
Take Profit at $66.70 for a solid risk-reward ratio.
⚠️ Risks:
If support at $62.30 fails, price may head toward $61.65 or lower.
Market volatility (especially with crude oil) can invalidate setups quickly.
Economic events (e.g., U.S. inventory reports, OPEC news) can disrupt technical patterns.

USOIL Bulls Eye Breakout – Can Momentum Carry It to $64The 4-hour chart of USOIL shows a market that has recently experienced a sharp decline, followed by a consolidation phase near a key support level. This key support zone is clearly defined at 55.21 USD, where the price found strong buying interest and bounced back up. From there, the market started to climb, attempting to form a potential short-term bottom.
The price is now approaching a previous trendline, which used to act as support during the uptrend and is now being retested as resistance. This retest area overlaps with horizontal resistance at around 60.00 USD, making it a critical decision zone. The two red arrows in the image mark failed attempts to break higher, indicating sellers are still active at this level.
If the price manages to break through this resistance with strength, the next likely objective is Target 1, set at 64.76 USD. This level coincides with the prior support that was broken during the selloff and could now act as a strong resistance. Beyond that, Target 2 at 72.44 USD marks a major resistance zone from which the last downtrend began.
From a trade setup perspective, the chart suggests a bullish opportunity:
The entry is near 59.98 USD, just above the short-term consolidation area, ideally after a breakout.
The stop loss is placed just below the recent swing low, at around 57.82 USD, providing room for volatility without exposing the trade to unnecessary risk.
The take profit is positioned at 64.76 USD, giving this trade a clear structure with a risk-to-reward ratio of about 1:3.75, which aligns well with strong risk management principles.
Additionally, the MACD indicator at the bottom supports the bullish bias. It shows a recent crossover of the MACD line above the signal line, with a rising histogram—indicating building upward momentum.
In summary, this chart presents a well-structured bullish setup with a favorable risk-to-reward ratio, clear entry and exit levels, and supporting momentum signals. However, the region around the trendline retest remains crucial. A strong close above this zone would confirm the breakout, while another rejection could signal the need for caution or reevaluation.

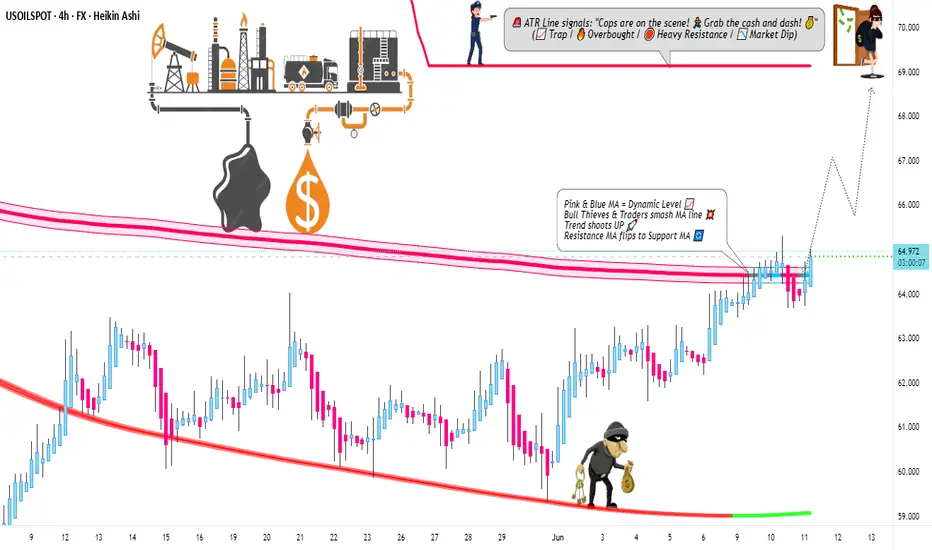
"US Oil Spot/WTI" Energy Market Bullish Heist (Swing Trade Plan)🌟Hi! Hola! Ola! Bonjour! Hallo! Marhaba!🌟
Dear Money Makers & Robbers, 🤑 💰💸✈️
Based on 🔥Thief Trading style technical and fundamental analysis🔥, here is our master plan to heist the "US Oil Spot/WTI" Energy Market. Please adhere to the strategy I've outlined in the chart, which emphasizes long entry. Our aim is to escape near the high-risk Red Zone Level. Risky level, overbought market, consolidation, trend reversal, trap at the level where traders and bearish robbers are stronger. 🏆💸"Take profit and treat yourself, traders. You deserve it!💪🏆🎉
Entry 📈 : "The heist is on! Wait for the MA breakout (59.700) then make your move - Bullish profits await!"
however I advise to Place Buy stop orders above the Moving average (or) Place buy limit orders within a 15 or 30 minute timeframe most recent or swing, low or high level for Pullback entries.
📌I strongly advise you to set an "alert (Alarm)" on your chart so you can see when the breakout entry occurs.
Stop Loss 🛑: "🔊 Yo, listen up! 🗣️ If you're lookin' to get in on a buy stop order, don't even think about settin' that stop loss till after the breakout 🚀. You feel me? Now, if you're smart, you'll place that stop loss where I told you to 📍, but if you're a rebel, you can put it wherever you like 🤪 - just don't say I didn't warn you ⚠️. You're playin' with fire 🔥, and it's your risk, not mine 👊."
📍 Thief SL placed at the recent/swing low level Using the 3H timeframe (57.400) Swing trade basis.
📍 SL is based on your risk of the trade, lot size and how many multiple orders you have to take.
🏴☠️Target 🎯: 63.000 (or) Escape Before the Target.
🧲Scalpers, take note 👀 : only scalp on the Long side. If you have a lot of money, you can go straight away; if not, you can join swing traders and carry out the robbery plan. Use trailing SL to safeguard your money 💰.
💰💵💴💸"US Oil Spot / WTI" Energy Market Heist Plan (Swing Trade) is currently experiencing a bullishness🐂.., driven by several key factors.☝☝☝
⚠️Trading Alert : News Releases and Position Management 📰 🗞️ 🚫🚏
As a reminder, news releases can have a significant impact on market prices and volatility. To minimize potential losses and protect your running positions,
we recommend the following:
Avoid taking new trades during news releases
Use trailing stop-loss orders to protect your running positions and lock in profits
💖Supporting our robbery plan 💥Hit the Boost Button💥 will enable us to effortlessly make and steal money 💰💵. Boost the strength of our robbery team. Every day in this market make money with ease by using the Thief Trading Style.🏆💪🤝❤️🎉🚀
I'll see you soon with another heist plan, so stay tuned 🤑🐱👤🤗🤩

Can it hit the bottom and rebound?Fundamental Analysis: Driven by the trade concerns sparked by Trump and the risk aversion sentiment arising from the global economic slowdown, the trajectory of oil prices has been shaped. Additionally, OPEC+ convened an early meeting on Saturday and confirmed an increase in production of 411,000 barrels per day in June. This decision has indubitably intensified the market's apprehensions regarding the oversupply of crude oil 📉.
Technical Analysis: Technically speaking, the price of crude oil has persistently lingered below the midline of the Bollinger Bands, distinctly indicating that the bearish trend is in the ascendancy 📉. Last week, on the weekly chart, it closed with a substantial bearish candlestick, exhibiting a downward tail pattern, and in the short term, the price has been fluctuating within a trading range 📊. As for the upcoming week's trend, whether the support level established by the previous double doji bottoming formation will be broken through effectively will be the focal point of market attention 👀. Nevertheless, once the price reaches the crucial support level, there exists the potential for a technical rebound. Investors should closely monitor the variations in trading volume and the response of the moving average system 📈.
Market Situation: It is crucial to note that due to the holiday factor in the Asian market next Monday, market liquidity is anticipated to decline significantly. Under such circumstances, the oil price is likely to encounter a higher risk of more pronounced volatility, further escalating the uncertainty of the market situation ⚠️.
⚡⚡⚡ USOIL ⚡⚡⚡
🚀 Buy@56.0 - 57.0
🚀 TP 59.0 - 60.0
Accurate signals are updated every day 📈 If you encounter any problems during trading, these signals can serve as your reliable guide 🧭 Feel free to refer to them! I sincerely hope they'll be of great help to you 🌟

"US Oil Spot / WTI" Energy Market Heist Plan (Scalping/Day)🌟Hi! Hola! Ola! Bonjour! Hallo! Marhaba!🌟
Dear Money Makers & Robbers, 🤑 💰💸✈️
Based on 🔥Thief Trading style technical and fundamental analysis🔥, here is our master plan to heist the "US Oil Spot / WTI" Energy Market. Please adhere to the strategy I've outlined in the chart, which emphasizes long entry. Our aim is to escape near the high-risk MA Zone. Risky level, overbought market, consolidation, trend reversal, trap at the level where traders and bearish robbers are stronger. 🏆💸"Take profit and treat yourself, traders. You deserve it!💪🏆🎉
Entry 📈 : "The vault is wide open! Swipe the Bullish loot at any price - the heist is on!
however I advise to Place buy limit orders within a 15 or 30 minute timeframe nearest or swing low or high level for pullback entries.
Stop Loss 🛑:
📍 Thief SL placed at the recent/swing low level Using the 3H timeframe (60.50) Day/Scalping trade basis.
📍 SL is based on your risk of the trade, lot size and how many multiple orders you have to take.
🏴☠️Target 🎯: 68.70
💰💵💴💸"US Oil Spot / WTI" Energy Market Heist Plan (Day / Scalping Trade) is currently experiencing a bullishness🐂.., driven by several key factors.☝☝☝
📰🗞️Get & Read the Fundamental, Macro Economics, COT Report, Seasonal Factors, Intermarket Analysis, Inventory and Storage Analysis, Future trend targets with targets... go ahead to check 👉👉👉🔗🔗
⚠️Trading Alert : News Releases and Position Management 📰 🗞️ 🚫🚏
As a reminder, news releases can have a significant impact on market prices and volatility. To minimize potential losses and protect your running positions,
we recommend the following:
Avoid taking new trades during news releases
Use trailing stop-loss orders to protect your running positions and lock in profits
💖Supporting our robbery plan 💥Hit the Boost Button💥 will enable us to effortlessly make and steal money 💰💵. Boost the strength of our robbery team. Every day in this market make money with ease by using the Thief Trading Style.🏆💪🤝❤️🎉🚀
I'll see you soon with another heist plan, so stay tuned 🤑🐱👤🤗🤩

"US Oil Spot/ WTI" Energy Market Heist Plan (Day Trade)🌟Hi! Hola! Ola! Bonjour! Hallo! Marhaba!🌟
Dear Money Makers & Robbers, 🤑💰✈️
Based on 🔥Thief Trading style technical and fundamental analysis🔥, here is our master plan to heist the "US Oil Spot/ WTI" Energy Market. Please adhere to the strategy I've outlined in the chart, which emphasizes short entry. Our aim is the high-risk GREEN Zone. It's a Risky level, oversold market, consolidation, trend reversal, trap at the level where traders and bullish robbers are stronger. 🏆💸"Take profit and treat yourself, traders. You deserve it!💪🏆🎉
Entry 📈 : "The heist is on! Wait for the Neutral Level breakout then make your move at (59.90) - Bearish profits await!"
however I advise to Place sell stop orders above the Moving average (or) after the Support level Place sell limit orders within a 15 (or) 30 minute timeframe most NEAREST (or) SWING low or high level for Pullback entries.
📌I strongly advise you to set an "alert (Alarm)" on your chart so you can see when the breakout entry occurs.
Stop Loss 🛑: "🔊 Yo, listen up! 🗣️ If you're lookin' to get in on a sell stop order, don't even think about settin' that stop loss till after the breakout 🚀. You feel me? Now, if you're smart, you'll place that stop loss where I told you to 📍, but if you're a rebel, you can put it wherever you like 🤪 - just don't say I didn't warn you ⚠️. You're playin' with fire 🔥, and it's your risk, not mine 👊."
📌Thief SL placed at the nearest/swing High or Low level Using the 4H timeframe (63.00) Day/Scalping trade basis.
📌SL is based on your risk of the trade, lot size and how many multiple orders you have to take.
Target 🎯: 57.50
🔥🛢"US Oil Spot/ WTI" Energy Market Heist Plan (Scalping/Day Trade) is currently experiencing a Bearish trend.., driven by several key factors.👇👇👇
📰🗞️Read the Fundamental, Macro Economics, COT Report, Seasonal Factors, Intermarket Analysis, Inventory and Storage Analysis, Sentimental Outlook, Future trend predict.
Before start the heist plan read it. go ahead to check 👉👉👉🔗🔗🌎🌏🗺
⚠️Trading Alert : News Releases and Position Management 📰 🗞️ 🚫🚏
As a reminder, news releases can have a significant impact on market prices and volatility. To minimize potential losses and protect your running positions,
we recommend the following:
Avoid taking new trades during news releases
Use trailing stop-loss orders to protect your running positions and lock in profits
💖Supporting our robbery plan 💥Hit the Boost Button💥 will enable us to effortlessly make and steal money 💰💵. Boost the strength of our robbery team. Every day in this market make money with ease by using the Thief Trading Style.🏆💪🤝❤️🎉🚀
I'll see you soon with another heist plan, so stay tuned 🤑🐱👤🤗🤩

USOIL trading opportunities.After the "OPEC+ continued to increase production" on Monday, USOIL continued to fall to a four-year low near 55. However, it rebounded after opening low on Monday. It continued on Tuesday. Is it no longer able to fall?
Ludvig believes that it will continue to fall. Because the decline is caused by the growth of production capacity. The rise is caused by geopolitical strategic reserve materials. One of these two directly affects the trend of OIL, and the other indirectly.
The trend of economic data API/EAI will continue to be released. If the geopolitical weakening situation, the oil price data released is roughly negative, so it will continue to fall. But if the impact of geopolitics intensifies, this is a positive factor.
So the current trading direction that can be determined is to continue to short.
In terms of trading, traders with large funds can sell at the current price, and those with small funds can wait until the market returns to above 59 to sell.
The band trading center continues to update new real-time trading opportunities. If you don’t know how to trade, or don’t want to miss the next real-time trading opportunity, remember to follow me.
