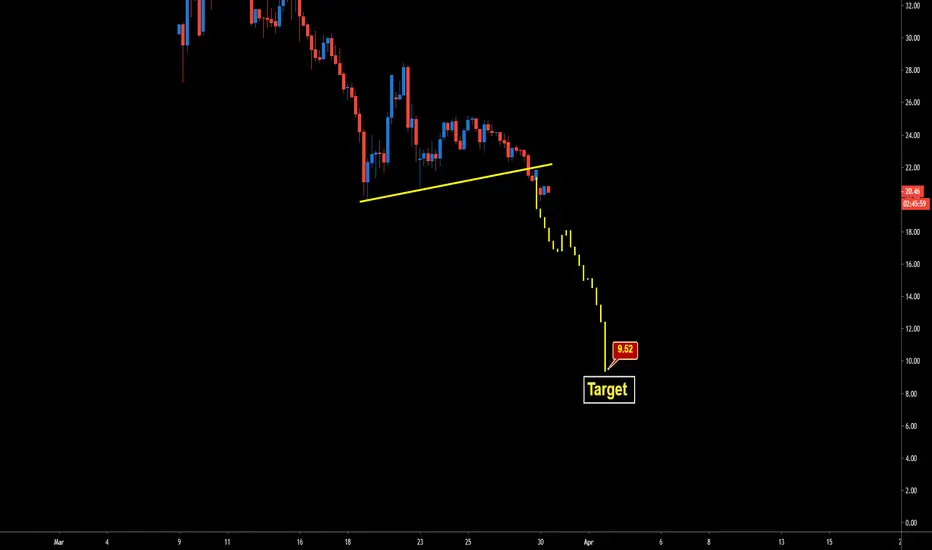
USOIL - Short SELLDivergence has been spotted on lower TF and price is retracing on fib - the price will fall near to previous weeks lows and then shoot up in price
Usoilprediction
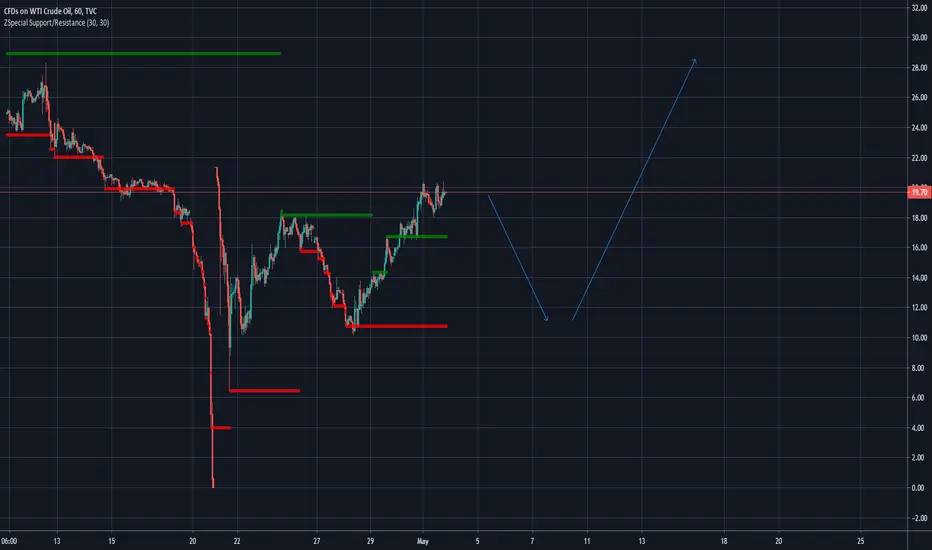
USOIl - WTIHey Guys,
Hope you are getting good trade out of this. I can see two possible scenarios for coming week.
Share your thoughts and take care.
ty

YOU GOT GAS MONEY?? lmaoo!!Good Afternoon Traders, USOIL is trending upwards possibly towards normal price, there are RESISTANCES at 16.92 and 20.57 in which TP can be taken into consideration. However, the level of 16.92 needs to be BROKEN and RE-TESTED before taking it towards the next RESISTANCE.
If this analysis made sense or matches with yours, Please hit the thumbs up Icon :)


USOIL, Best Place to open Long EntryCrash of USOIL Market is only temporary and this price cannot be rejected by any trader. The highlighted place of 10 dollars per barrel is the best historical price you can get to open a buy position for long-term. The Scalp can be targeted for 100% profit to place around 20.00 and swing trade to 300% if not even more. This trade is only AWESOME!

BLACK GOLD! is there some serious cash to be made?Scary times for oil, I was in favor for a turn around and thought 10$ a barrel was ludicrous but after looking at the monthly with my analysis it's looking incredibly favorable?!. When coming to the oil chart I was actually hoping to find a long opportunity lol.
Take a look at that bottom trend line...we have had a perfect bounce and break bellow. not only just breaking the trend line but the structure too. The wicks need to hit that 0.168 fib line to complete the full retracement which coincidentally lays on that 10$ region. The 78 and 61 has been tapped perfectly. Now 16-17$ is a very strong floor which is where we may see a real bull/bear scenario but a break below this level and I do see 10$.
My broker has had a serious lag with oil and is trading at $25 a barrel instead of $18...my broker is usually spot on with prices so this is very weird. I have taken full advantage of this lag and entered shorts to the $18 mark, I will move this lower to $10 and wait to see what price does at the $17 level before moving the TP back up.
Oil being driven to all times lows just to be bought back again for serious accumulation...then a huge surge...? lets see, let me know what you think.
My opinion...trade at own risk. Not financial advice


CFDS ON CRUDE OIL (WTI) USOIL LONG SET UPTITLE : BUY USOIL
ASSETS : COMMODITIE
SYMBOL : USOIL
ORDER TYPE : (EP1) LIMIT ORDER
(EP2) LIMIT ORDER
TF : 8hr
ENTRY PRICE 1: $20.28
ENTRY PRICE 2: $19.68
STOP LOSS : $16.71
TAKE PROFIT 1- $23.86
TAKE PROFIT 2- $26.68
TAKE PROFIT 3 -$30.86
STATUS: ACTIVE

usoil entering the$20 region where a strong ressistance is readywith a Major rejection at the 786 level of the fib, we saw a nice bearish movement to the first -27 level. we have some room of 100 pips to hit the $20.00 region which aligns with the -618 level. from that level, we can expect some sideways movement and a bullish push. especially now when Trump made a deal with the OPEC for a production cut, and China who is slowly getting the factories ready for production. we can expect a higher demand for usoil which can push the price to the 30-35 $ region.


CRUDE OIL (WTI):HITS KEY HISTORICAL LEVELS (GO LONG)TITLE : BUY USOIL
ASSETS : COMMODITIE
SYMBOL : USOIL
ORDER TYPE : (EP1) MARKET ORDER
(EP2) LIMIT ORDER
TF : 6 MONTH
ENTRY PRICE 1: $20.86
ENTRY PRICE 2: $18.68
STOP LOSS : $16.71
TAKE PROFIT 1- $23.86
TAKE PROFIT 2- $28.68
TAKE PROFIT 3- $30.86
TAKE PROFIT 4- $34.68
TAKE PROFIT 5- $40.86
STATUS : ENTRY 1 active

USOIL Sell Update (+263 pips)See attached trade entry from yesterday below,
18:02:18 (UTC)
Tue Apr 7, 2020

Cl! Light Crude Futures Short Update (+200 pips) 18:00:12 (UTC) See attached trades from yesterday linked below
18:00:12 (UTC)
Tue Apr 7, 2020

USOIL Daily Risk Range - 13:19:54 (UTC) Tue Apr 7, 2020Previous Close: 28.34
Higher Bound: 30.40
Lower Bound: 17.81
13:19:36 ( UTC )
Tue Apr 7, 2020

UOSOIL | Neutral for the moment, buy if price make a breakout
- USOIL attempted a breakout at 28-29 area testing the short term resistance.
- Until the maket closed, there was a bullish movement considering the fact that the price action was consistenly above the 20 MA and the 50 MA.
- RSI level at 73 seems to approach the overbought area.
- Positive sign the fact that the price of USOIL is going along with the upper Bollinger band.
Forecast: If the USOIL breakouts the short term Resistance then the next big test will be the Resistance after the USOIL Crash.

USOIL: Possibility to Drop till $10 Thanks for Taking Interested in my Trading Idea.
USOIL: Possibility to Drop till $10
Dear followers, the best Gift for me is "will be your likes , comments & Share
Note: This is only for Educational purposes; this is not investment advice.
Thanks for your support!
chance at a rejection after positive news from China and Russiawith a completed wave and a rejection at the 618 level, we expect that the price can make new higher highs. especially with the fact in mind that Russia started the conversation with the Saudis to stop the price war in the OIL. on the other hand, China recovering from the Covid-19. this can be a double impulse for a bullish oil.

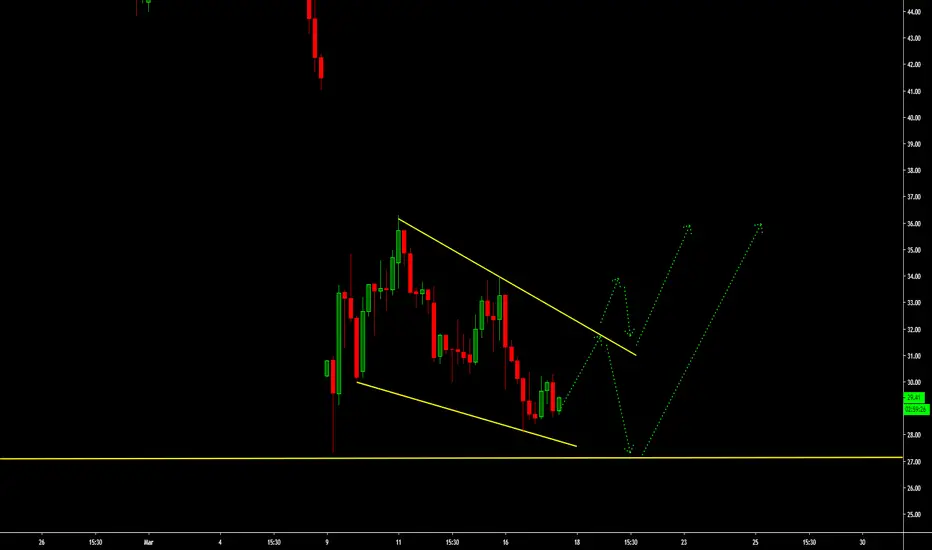
USOIL: Falling Wedge Pattern.Thanks for Taking Interested in my Trading Idea.
USOIL: Falling Wedge Pattern.
Dear followers, the best Gift for me is "will be your likes , comments & Share
Note: This is only for Educational purposes; this is not investment advice.
Thanks for your support!
US-Oil : Strong Sell Trade SetupI am Expecting Downside Move in US-Oil , Let see How Market Move.
ThankYou

USOIL is going to Neutral PhaseAfter the predictable fall in oil prices, it can now be said that oil is entering a neutral phase.

CRUDE OIL (USOIL) DailyDates in the future with the highest probability for price direction reversals

Crude oil (This is a chart i actually drew on 28th April 2019)So, even before CoronaVirus broke out, i already had a chart dated back to April 2019 drawn but made private that shows this might be leg C going to 32.
DISCLAIMER
Please note that this chart is an opinion based chart only. Please trade at your own risk
