OIL WEEKLY TRADE IDEAMy trading strategy isn't intended to be used as a signal service. It's a process of gaining knowledge of market structure and improving my trading abilities.
Like and subscribe and happy trading to all
Usoilshort
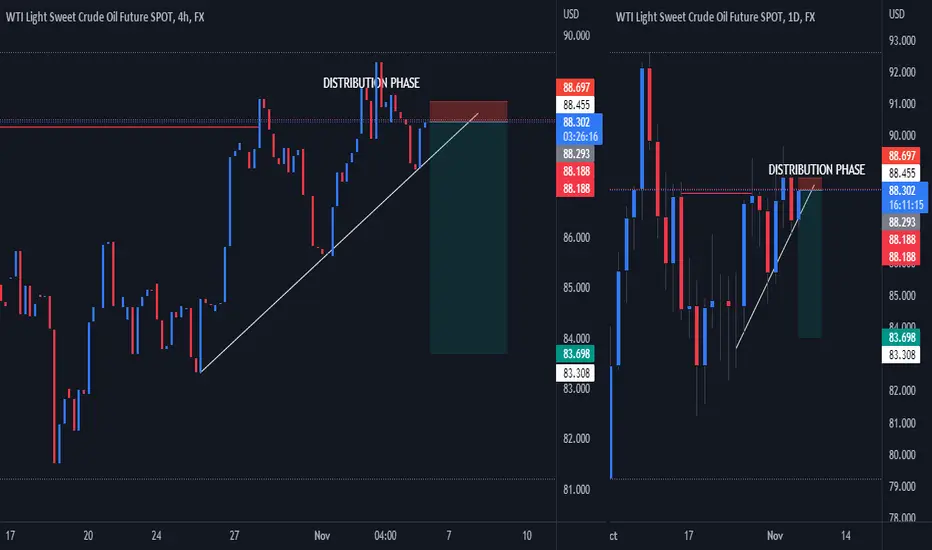
Oil - short entryYou just need to look up the 2B entry system, but, because Tradingview is a place where no one thinks for themselves or is autobot compelled to write more. Here goes.
2nd November oil rallied in a continuation of the move from 31st October. It then dipped below the weekly opening gap, before pushing to a new high. That big push from 88.50 to 90.80 culminated in a fake out/blow off top, thrust, and exhaustion. Since then the price action has failed to rally and is stair-stepping its way lower. A break of the H4 thrust candle should be the catalyst needed for a decent fall back towards 86 and maybe beyond.

USOIL Sell view to TP 88.2-87.5USOIL Sell view to TP 88.2-87.5
Sell view with the technical setup including fibonacci (sell zone around 161.8 in H4) + S&D

InvestMate|USOIL Time to continue downtrend🛢️USOIL Time to continue downtrend
🛢️On oil we are at an interesting moment. Since 26 September, we started to make an upward correction of the downtrend from the levels of $76 per barrel.
🛢️Then we broke out to $93.5
🛢️We then performed a correction of this uptrend impulse again finding resistance at $83 where the 61.8 level of the entire upward wave was located.
🛢️In the last few days there was again an attempt at growth which was currently stopped at the cluster of levels 0.236 of the upward impulse wave and 0.618 of the correction of this impulse.
🛢️Seeing that it is around $90 is a place of strong resistance. I believe we are in an interesting place to make a downward correction.
🛢️The target place for declines will be the cluster of levels at 0.5 of the largest upward impulse
0.236 of the last largest downward impulse
and 0.618 of the current upward wave.
🛢️ Assuming we open positions now
The stop will be above the resistance zone at around $90.4 and the take profit at $95
🚀If you appreciate my work and effort put into this post I encourage you to leave a like and give a follow on my profile.🚀

USOIL - Bullish price action ✅Hello traders!
‼️ This is my analysis on USOIL .
Here we are bullish from all timeframes perspective, so I am looking only for longs. I expect the continuation of bullish price action after the change of character and rejection from bullish orderblock.
Like, comment and subscribe to be in touch with my content!

USOIL TRADE IDEA 1 UPDATEUSOIL has formed a SYMMETRCIAL TRIANGLE DTF.
Secondly the asset is in the process of trying to break through the 0.618 Fib level, has had multiple failed attempts.
I have give Bear and Bull TARGETS.

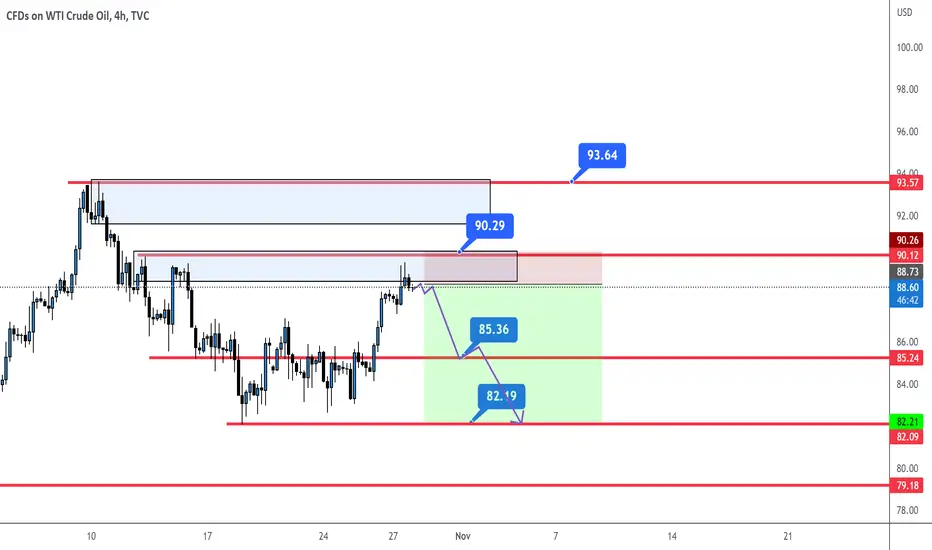
USOILSELL trade set up for usoil
90.29 is the current resistance zone if price continue to trade below this level expect the drop down to 85.36, if ths level which is currently acting as a support breaks expect it to drop further down to 82.20
USOIL WTI M15 Bearish Shark Pattern Formation Sell under 86.84 USOIL WTI M15 TF Bearish Shark Pattern Formation Sell under 86.84, after target hit and breakout than wait for 2nd target. let's see the market condition...

US Oil is going down as we expected... about $80Hello guys
As we said in the recommendation 4 days before it @usoil is expected to go down, and it will continue to go down... Take advantage of this opportunity
...you won't lose after knowing me
USOIL : OIL ⛽️
STOP LOSE ⛔️ : 88
TP ✅ : 82
TP 2 ✅ : 77
Good luck

A drop in the price of US OIL is expectedHello guys
I'm back to post analytics ....
usoil will witness an expected decline, because it is in an important descending trend, my analysis will be correct and we will meet in a later analysis .
You can rely on this recommendation :
USOIL : OIL ⛽️
SELL USOIL : OIL ⛽️ PRICE : 86
STOP LOSE ⛔️ : 88
TP ✅ : 82
TP 2 ✅ : 77
GOOD LUCK

WTI: Crude oil prices are impacted by a dimming demand outlook.Despite limiting its highest daily gains in a week, WTI crude oil remains in a flat trend. US government representatives have stated that they are prepared to release 15 million barrels of oil from SPR.
In contrast to repurchasing shares and paying dividends, according to Biden, oil firms should increase output and lower gasoline costs.
He said, “My message to the American energy companies is this: You should not be using your profits to buy back stock or for dividends. Not now. Not while a war is raging,” Biden said. “You should be using these record-breaking profits to increase production and refining.”
Since the beginning of the year, the White House has released approximately 165 million barrels of petroleum from the reserve, out of a total estimated to be over 180 million.
This means the demand is diminishing.
However, if price manages to trade, break and close above 86.55 the setups would be invalidated making the bulls take charge.

USOIL SHORT POSITION The best entry is to get now and enjoy the short selling profit. according to the higher low and lower low chart pattern

US OIL WTI CRUDE OIL FORCASTIn the us oil price break its support area to the down side and expected sell off for the next week/ on 1h price break and retest it support now as a resistance.

USOILUSOIL currently price is below a resistance zone and a supply zone .if price continue to trade below 90.32 i will be going short down to 85.59 and if the current support breaks expect more drop to the down side
I will only consider going long in a situation where the current resistance breaks which is 90.32.
pls always wait for candlestick confirmation and trend formation on smaller time frames before you take you trades.
pls like an comment.

CRUDE OIL intraday trading & back to the home ⬇︎ 14 OCT 2022CRUDE OIL intraday trading alert
3 steps must fulfill before entry
1. 1st breakout done
2. Retracement done
3. 2nd breakout and see you in the home ⬇︎
More info in my profile..
Good luck traders..


USOIL Short: Parallel Descending Channel & Fib Golden Level Entry
1- On LL
2- Parallel Descending Channel
SL
1- Previous LH
TP
1- around 0.618 fib level
2- 4hr Support area
3- Channel Support

USOIL Short: Parallel Descending Channel on 1Hr Possible Trend Reversal
Making new LL and LH
Parallel Descending Channel

USOIL - Short from resistance ✅Hello traders!
⁉️This is my analysis on USOIL.
Here we are in a bearish market structure, so I am looking only for shorts. I expect price to go a little bit higher to fill the imbalance above and then to reject from resistance.
Like, comment and subscribe to be in touch with my content!

USOIL WTI H4 Bearish Butterfly Pattern FormationUSOIL WTI H4 Bearish Butterfly Pattern Formation, Market will be falling this zone, let's see market condition


USOIL Oct 1 22🧅Disclaimer :There are risks associated with investing in securities. Investing in stocks, bonds, exchange traded funds, mutual funds, and money market funds involve risk of loss. Loss of principal is possible. Some high risk investments may use leverage, which will accentuate gains & losses. Foreign investing involves special risks, including a greater volatility and political, economic and currency risks and differences in accounting methods. This is Not Financial Advice
🧅JUST AN OPINION OF THE ONION.🧅

USOIL ! Daily analysis bullish or bearish ? Short rules are simple: don't force trade against terend, with a clear HL-LL structure. Then, at the red level, is sell zone. momentum is looking price fail to make a higher high, then go to entry short.
traders need to enter short at that level, as a red engulfing reversal candle appears at that point.
verify a lower timeframe for the best analysis and wait until short confirmation.
Must wait for more signals as a confirmation candle, otherwise
Long rules are simple: If you get high risk, high reward. Then wait for the break red zone, with massive bullish momentum
