Usoilshort

#USOIL 4HUSOIL (4H Timeframe) Analysis
Market Structure:
The chart is forming a classic Head and Shoulders pattern, which often signals a potential reversal from an uptrend to a downtrend. The left shoulder, head, and right shoulder are clearly visible, and the neckline is an important support zone to monitor.
Forecast:
A sell opportunity may be considered if the price breaks and closes below the neckline with confirmation. This breakdown could indicate the start of a bearish trend continuation.
Key Levels to Watch:
- Entry Zone: Look for a sell setup once the neckline is broken and retested as resistance.
- Risk Management:
- Stop Loss: Positioned above the right shoulder to minimize risk.
- Take Profit: Target nearby support zones or use a measured move technique based on the pattern's height.
Market Sentiment:
As long as the neckline holds and the breakdown is confirmed, bearish momentum is likely. A failure to break below the neckline would delay or invalidate the selling setup.

Is this still the ‘Top Trade’ of 2025? (WTI crude oil)It’s not a big secret actually- I’m talking about crude oil!
In the final week of 2024, the team and I highlighted two versions of the WTI crude oil weekly chart and asked ‘is this the top trade of 2024?’
Version 1 has already happened, WTI crude hit $55 per barrel, the downside objective of the smaller triangle pattern on the chart.
Version 2 showed a much larger triangle pattern (which we show again this week) and had a downside target of nearly $30! It would take a lot of conviction to ride the price that far down, but could crude oil still move a lot lower this year?
What’s interesting is that this is still one of the ‘less talked about’ situations in the market today because of the huge volatility seen in both stocks, forex and fixed income.
And I like that nobody’st talking about it - because you don’t want everyone in on it - that means the move could already be over.
Crude oil hit a five-year low. That’s meaningful.
Strong markets don’t hit 5-year lows, weak markets do. And we like to sell weak markets.
Of course, ‘oversold markets’ hit 5-year lows too - and that largely explains the ‘bottom feeders’ who bought WTI crude oil at $55.
Downside volatility got extreme owing to Trump’s tariffs and mean-reversion helped it rebound on news of the 90-day pause, much like stock markets.
I am completely open to the idea that $55 is a multi-year low and essentially marked the bottom. The huge Hammer reversal candlestick pattern adds weight to that idea.
But with the price having hit $65 last week, buying the lows is yesterday’s trade. What do we do today?
We will be looking to do what we said in Week 53 of 2024 in case crude oil turns out to be the ‘top trade of 2025’ as we imagined.
By the way, Brent crude oil has a very similar setup so this is not a ‘US oil’ thing.
There are two parts to trading ‘planning the trade, and trading the plan’.
There isn’t much use in making a plan, and not taking the trade.
There are always reasons not to take a trade- but if it’s a ‘good trade’ that fits the rules of your trading strategy, then those reasons are usually just ‘noise’.
WTI Crude (USO/USD)
Long term chart (weekly)
Trend: Down
Phase: Re-test of breakdown
Resistance = $70
Support = $55
Price action: Price has broken down, rebounded and is now testing the breakdown level, while under the 30-week moving average. Should the price break back over the broken long term rising trendline then we know the idea, or at least the timing on the idea is not right.
View: Bearish while under broken up-sloping long term support

Bullish on USOILAs the chart shows, in the 1 - hour timeframe, USOIL is in an upward - trending channel 📈. The price fluctuates upwards between two trendlines. Despite pullbacks, the uptrend persists, suggesting short - term bullish dominance. Still, the frequent swings reveal ongoing bull - bear market battles.📈
⚡⚡⚡ USOIL ⚡⚡⚡
🚀 Buy@61.5 - 62.0
🚀 TP 63.5 - 65.0
Accurate signals are updated every day 📈 If you encounter any problems during trading, these signals can serve as your reliable guide 🧭 Feel free to refer to them! I sincerely hope they'll be of great help to you 🌟

USOIL Opening Trends and Trading Strategies Next WeekTrend Analysis
As shown in the chart, in the 1 - hour time frame, USOIL is moving within an upward - trending channel 📈. This channel is defined by two trendlines, and the price is fluctuating upwards within it. Although there have been pullback trends during this period, the overall trend remains upward. This indicates that in the short term, the bullish forces are relatively dominant, driving the price to gradually climb 📈. However, the frequent price fluctuations also reflect a certain degree of game - playing between the bulls and bears in the market 🤺.
⚡⚡⚡ USOIL ⚡⚡⚡
🚀 Buy@61.5 - 62.0
🚀 TP 63.5 - 65.0
Accurate signals are updated every day 📈 If you encounter any problems during trading, these signals can serve as your reliable guide 🧭 Feel free to refer to them! I sincerely hope they'll be of great help to you 🌟

USOIL ANALYSISHello friends
Everything is clear on the chart for you, our probability is price growth to the specified areas.
Be sure to observe risk and capital management.
*Trade safely with us*

Recent correlation breakdown between $USOIL and $DXYUsually, market watchers will say if the Dollar index TVC:DXY is down then commodities like Crude Oil and Gold should outperform. But recent market events have invalidated this assessment. Since 2022 we see that there is a correlation breakdown between TVC:USOIL and $DXY. These 2 indexes have been moving in tandem recently. In 2025 we saw a massive sale in the TVC:DXY and a similar downturn in the US Dollar index. With TVC:DXY below 100 and TVC:USOIL recently below 60 $, these 2 indexes are clearly indicating a US recession with low Oil demand.
IN this chart we see that the next key support levels in TVC:USOIL is 54 $. If we go below 54 $ then the next level to watch will be 35 $. That will be a recessionary scenario last seen during COVID lows. That can bring down the TVC:DXY to 90 levels. All those will indicate a deep recession which is not my base case scenario. My assessment we will see TVC:USOIL @ 55 $ and TVC:DXY @ 95 and then we will hover around those levels.
Verdict: TVC:USOIL can touch 55 $ if TVC:DXY touches 95.

Daily Analysis of USOILChanges in Crude Oil Supply and Demand:
Demand Side: China imposes tariffs on U.S. crude oil, raising the import cost and reducing the import volume. The United States imposes tariffs on energy imports from Canada and Mexico, affecting the crude oil exports of these two countries to the U.S., reducing the demand for crude oil in the United States and putting pressure on the price of USOIL 😟.
Supply Side: After China reduces its imports of U.S. crude oil, it increases imports from other exporting countries, changing the global crude oil supply pattern and possibly strengthening the expectation of a supply surplus. The decrease in U.S. crude oil exports may lead to an increase in domestic inventory, exerting downward pressure on the price of USOIL 😣.
💰💰💰 USOIL💰💰💰
🎯 Sell@61.0 - 61.2
🎯 TP 59.5 - 59.5
Traders, if you're fond of this perspective or have your own insights regarding it, feel free to share in the comments. I'm really looking forward to reading your thoughts! 🤗
The accuracy rate of our daily signals has remained above 98% within a month! 📈 We sincerely welcome you to join our channel and share in the success with us! 🌟

USOIL(UPDATE)Hello friends
Given the recent price growth, you can see that the price has weakened and has caused lower ceilings and floors to form. Now the range to which we expect the price to fall has been determined, which is also an FVG gap.
*Trade safely with us*

Strategic Analysis of Crude Oil for Next WeekBehind the current fluctuations in international oil prices lies the market's deep anxiety over the extreme uncertainty of global trade policies. Trump's "suspension + escalation" approach has, in the short term, stabilized relations with non - Chinese economies, but it has also dealt a blow to the global supply chain and energy consumption confidence.
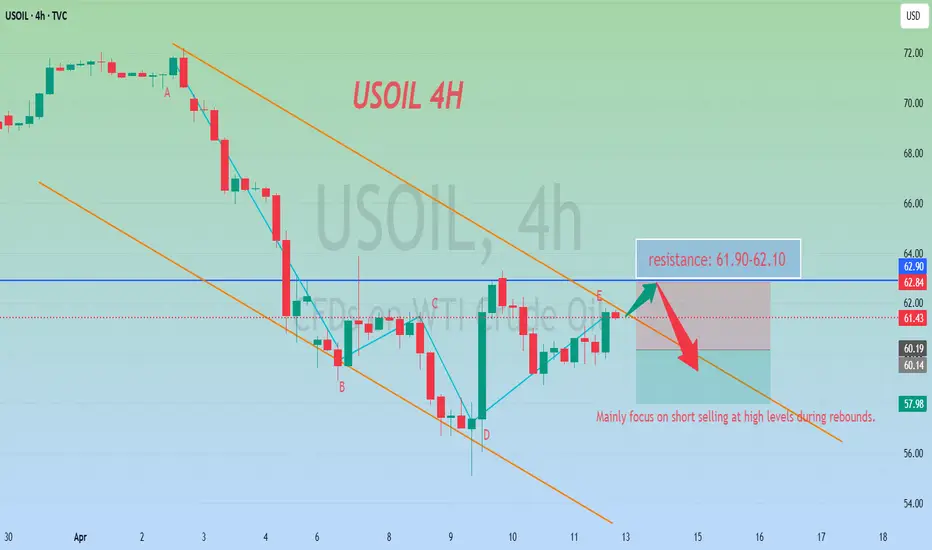
In terms of the trading ideas for crude oil next week, it is recommended to mainly go short at high levels during rebounds and go long at low levels during pullbacks as a supplement. In the short term, pay attention to the resistance level in the range of 62.8 - 63.2. In the short term, focus on the support level in the range of 60.5 - 59.5.
Oil trading strategy:
sell @ 61.90-62.10
sl 62.80
tp 61.70-61.40
If you approve of my analysis, you can give it a thumbs-up as support. If you have different opinions, you can leave your thoughts in the comments.Thank you!
USOIL may continue to decline due to tariffsRestricted Economic Growth : The United States imposes tariffs, and other countries take countermeasures, intensifying global trade frictions and greatly increasing the risk of economic recession. NIESR predicts that if Trump imposes a 10% tariff on the world and a 60% tariff on China, the global GDP will shrink by 2% and the trade volume will decrease by 6% within five years 😕. The weak economy causes the demand for crude oil in various industries to decline, leading to a drop in the price of USOIL 📉.
Changes in Crude Oil Supply and Demand :
Demand Side: China imposes tariffs on U.S. crude oil, raising the import cost and reducing the import volume. The United States imposes tariffs on energy imports from Canada and Mexico, affecting the crude oil exports of these two countries to the U.S., reducing the demand for crude oil in the United States and putting pressure on the price of USOIL 😟.
Supply Side: After China reduces its imports of U.S. crude oil, it increases imports from other exporting countries, changing the global crude oil supply pattern and possibly strengthening the expectation of a supply surplus. The decrease in U.S. crude oil exports may lead to an increase in domestic inventory, exerting downward pressure on the price of USOIL 😣.
Influenced Market Sentiment :
The uncertainty of tariff policies and the escalation of trade frictions trigger market panic and speculation, intensifying the volatility of the crude oil market. Investors, being pessimistic, sell futures contracts, further driving down the price of USOIL 😨.
This upward movement has led to the clearing of many traders' accounts or significant losses 😫. You can follow my signals and gradually recover your losses and achieve profitability 🌟.
💰💰💰 USOIL💰💰💰
🎯 Sell@61.0 - 61.5
🎯 TP 59.0 - 58.0
Traders, if you're fond of this perspective or have your own insights regarding it, feel free to share in the comments. I'm really looking forward to reading your thoughts! 🤗

WTI Crude Oil Bearish Reversal Setup – Short from Resistance ZonEntry Point: 62.66 USD
Stop Loss: 65.26 USD
Target Point (Take Profit): 55.09 USD
Indicators:
EMA 200 (blue): 60.92 USD — long-term trend indicator
EMA 30 (red): 60.75 USD — short-term trend indicator
Analysis:
1. Bearish Setup:
The price is approaching a key resistance zone marked by the purple shaded area near 62.66.
The strategy is to short from this level, anticipating a drop to the 55.09 target area.
2. Risk/Reward:
Risk (SL - Entry): 65.26 - 62.66 = 2.60 USD
Reward (Entry - TP): 62.66 - 55.09 = 7.57 USD
Risk-to-reward ratio: ~1:2.9, which is favorable.
3. Support/Resistance Confirmation:
Multiple touches at the resistance zone (or

USOIL Short Trade Idea – Targeting $55.05 from $61.00Entry Point: ~61.00 USD
Stop Loss (SL): 64.77 USD
Target (TP): 55.05 USD
Risk/Reward Ratio: Favorable
Risk: ~3.77 USD
Reward: ~5.95 USD
Approximate R/R ratio: 1:1.58
🧠 Strategy Insight
Trend Context:
Prior to the entry zone, price shows a strong downtrend.
The price retraced upward into a resistance zone (highlighted in purple).
The setup suggests a short position anticipating rejection from this zone.
Indicators:
Moving Averages (red & blue):
Likely 50 EMA and 200 EMA showing bearish alignment (price mostly under both).
Resistance Zone:
The purple shaded region represents a supply zone, where price previously reversed.
Entry Zone Analysis:
Entry just below a recent rejection candle.
It's a conservative spot to catch a move back in the direction of the dominant trend.
Target Zone (55.05):
Likely based on a recent support level or demand zone from earlier price action.
Matches previous lows.
🔁 Possible Scenarios
✅ Bearish Scenario (Ideal Outcome):
Price gets rejected from the resistance zone and continues the downtrend toward the target at 55.05.
❌ Bullish Scenario (Risk):
Price breaks above 61.00 and continues toward 64.77, invalidating the short setup.

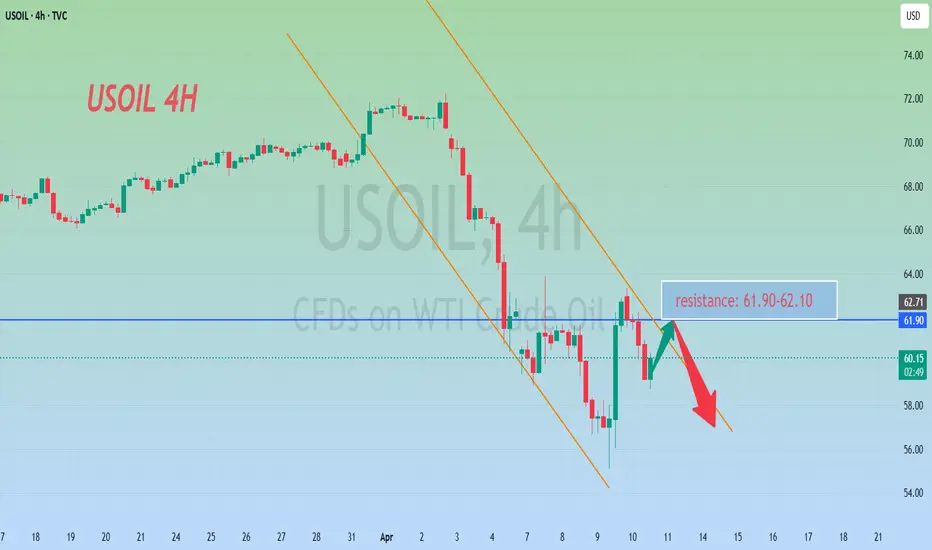
Analysis of Crude Oil StrategiesCrude oil bottomed out and rebounded sharply on Wednesday. This was also due to the impact of the tariff war, which is currently dominating the trend of the financial market. However, on Thursday, it didn't continue to rise. Instead, it fell successively and retraced. Pay attention to going long at the support level of 58.20 below, and consider going short at the resistance level of 61.90 above.
Oil trading strategy:
sell @ 61.90-62.10
sl 62.80
tp 60.95-61.10
If you approve of my analysis, you can give it a thumbs-up as support. If you have different opinions, you can leave your thoughts in the comments.Thank you!
USOIL:Continue to move downwardAfter U.S. President Donald Trump announced tariffs and the OPEC+ decided to increase oil production, concerns about the demand outlook intensified, leading to a significant decline in crude oil prices on Thursday.
The short-term trend of crude oil has dropped sharply, with all the gains since mid-March being given back. The oil price has touched a low near 66. The moving average system diverges downward, and objectively, the short-term trend direction is downward. The bearish momentum is abundant. It is expected that after a minor adjustment at a low level in the intraday trading, the short-term trend of crude oil will mainly continue to move downward.
Trading Strategy:
buy@67.5-68
TP:66-65.5
Get daily trading signals that ensure continuous profits! With an astonishing 90% accuracy rate, I'm the record - holder of an 800% monthly return. Click the link below the article to obtain accurate signals now!

Crude oil meets resistance at high levels, it is time to go shorAlthough we have used the daily line to re-count the waves, and explained that the current rising market is in the 2nd wave rebound of the daily line, which is the sub-wave c of wave 2, the market is still in a bearish trend in the daily line. After the market has completed this wave of 2nd wave rebound and adjustment, it will continue to fall by 3 waves. In the 4-hour market, the current market has not risen above 72.90 US dollars. We can still regard it as a rebound of 3-2 waves, or a rebound of the main wave 4. The main decline wave 1 of 4 hours fell from 76.57 US dollars to 69.80 US dollars, a drop of 6.77 US dollars, and the current 4-hour main decline wave 3 fell from 72.90 US dollars to 64. .85 dollars fell to 8.05 dollars. Why can it be either 3-2 waves or 4 waves? Because the current 8.05 dollars is larger than the decline of the main decline wave 1, it can be regarded as 3 waves, and the current rebound is very strong, so it can be regarded as 4 waves, but I think from the perspective of the main decline wave 3 in 4 hours, the decline should be more than that, it should be greater than 10 US dollars, so it can also be regarded as a rebound of 3-2 waves. The key is whether this wave of rise will break 72.90 US dollars. If it breaks, it will be a sub-wave of the main decline wave 1 in 4 hours. Therefore, our trading ideas today do not have a main direction. The market will make orders when the strategy reaches that first.
Today's crude oil recommendations: 1. Short at 72.65 US dollars, stop loss 30 points, and take profit 70.60 US dollars.

USOIL-Sell in the 71.6-72 rangeUSOIL has also experienced a strong uptrend recently, driven by news events. However, as we all know, "what goes up must come down"—even in a one-sided market, technical corrections are inevitable. Right now, we are seeing a perfect opportunity for a pullback-based short trade after the sharp rally.
Trading Recommendation:
📉 Sell in the 71.6-72 range

USOIL BUY!!!Hello friends
Given that the price has reached good support, we now see that the price has made a good comeback...
We can enter the trade with capital and risk management and move towards the specified goals.
*Trade safely with us*

What to do if crude oil rises? The latest layout strategyCrude oil futures showed volatility during the day on Monday. Prices rose sharply in early European trading, breaking through the 70.00 integer mark and then falling back, but still fluctuating at a relatively high level. Oil prices rose slightly after countries importing Russian oil imposed tariffs of 25% to 50%. Brent crude oil futures climbed and WTI also rose. However, gains were limited as traders questioned the seriousness of the proposal. ING Group pointed out that the market was "fatigued" by Washington's tariff rhetoric, indicating that the crude oil market was unlikely to react strongly without concrete actions.
Crude oil plan: Crude oil is recommended to retreat to 70.0-69.5, with a target of 71.0-72.0 and a stop loss of 0.5 US dollars.
If oil prices break below $69.0/barrel, this will stop the expected bullish trend and push oil prices to regain the main trend of volatility.
It is expected that today's oil prices will trade between the support level of $69.0/barrel and the resistance level of $72.0/barrel.

USOIL: Next Week's Blueprint for Profit Amid VolatilityDuring the US trading session on Friday, March 28th, international oil prices fluctuated slightly and declined. However, both Brent crude oil and WTI crude oil remained firmly near their one - month highs and were projected to register "three consecutive weekly gains" on the weekly chart. The ongoing tug - of - war between the supply tightness instigated by geopolitical unrest and the latent concerns regarding an economic downturn has placed oil prices in a volatile state of being "caught between a rock and a hard place".
From the perspective of the USOIL daily chart, following the medium - term trend's breach of the lower edge of the range, it has predominantly fluctuated around lower levels. The oil price has experienced consecutive short - term increases, breaking through the suppression of the moving average system, and the medium - term objective trend has entered a transition phase. Nevertheless, in terms of kinetic energy, neither the bulls nor the bears have demonstrated a clear - cut inclination to overpower the other. It is anticipated that the medium - term trend will persist in its volatile rhythm for a while, awaiting the establishment of a distinct trend direction.
The short - term (1H) trend of USOIL has not continuously set new highs and has exhibited a pattern of high - level consolidation. The short - term objective trend remains upward. In the early trading session, the oil price underwent a narrow adjustment at a high level, presenting an overall secondary rhythm with a sound internal rhythm. The fundamental objective trend during the week has been upward in sync, and it is highly likely that the short - term trend of USOIL will continue its upward trajectory next week.
USOIL
buy@68-68.5
tp:69.5-70
I will share trading signals every day. All the signals have been accurate for a whole month in a row. If you also need them, please click on the link below the article to obtain them.

USOIL: GO short positions during the oscillation at a high levelThe short-term trend of crude oil has been oscillating and declining at a high level. The oil price has broken below the moving average system, and the objective short-term trend has entered a transition period. The bearish momentum is gradually intensifying, and the oil price dropped below 70 in the early trading session. In the 4-hour chart, the objective short-term trend direction within this week still remains upward. The trading strategy for crude oil still mainly focuses on the oscillation and decline at a high level.
Trading Strategy:
Sell@69.8-70
TP:69-68.5
Get daily trading signals that ensure continuous profits! With an astonishing 90% accuracy rate, I'm the record - holder of an 800% monthly return. Click the link below the article to obtain accurate signals now!

Tariffs can have a significant impact on USOILThe expiration of the extended US import tariffs on Canada and Mexico next Wednesday may impact USOIL:
Supply : Tariffs could disrupt US-Canada crude oil trade, cutting US supply and raising prices. Trade pattern changes may also affect global supply and USOIL prices.
Demand : Tariffs may slow economic growth, reducing crude oil demand and exerting downward price pressure. Uncertainty dampens consumer and business confidence, further suppressing demand.
Market Sentiment & Finance : Policy changes heighten uncertainty, making investors cautious and increasing USOIL price volatility. Capital may flow out, pressuring prices, but portfolio adjustments for hedging could support them.
Also, OPEC and non-OPEC plans to end production cuts in April may boost global supply and lower USOIL prices.

USOIL:Continue to sell at highs tomorrowAfter breaking below the lower edge of the range, the medium-term trend of crude oil has been continuously moving in a secondary oscillation around low levels. In terms of momentum, neither the bullish nor bearish momentum has significantly overwhelmed the other, and there has been no continuation of the bullish trend.
Regarding the support level, we should first consider the 68.5 mark, which was an important resistance level that the oil price previously broke through. For tomorrow's trading operations, it is advisable to mainly consider selling at highs.
USOIL Trading Strategy:
Sell@70-70.5
TP:69-68.5
Get daily trading signals that ensure continuous profits! With an astonishing 90% accuracy rate, I'm the record - holder of an 800% monthly return. Click the link below the article to obtain accurate signals now!
