US OIL downDon't forget to click the follow button to view my daily detailed anlaysis. Also, should have any questions, please do ask them in the comments,
Here is our US OIL chart..
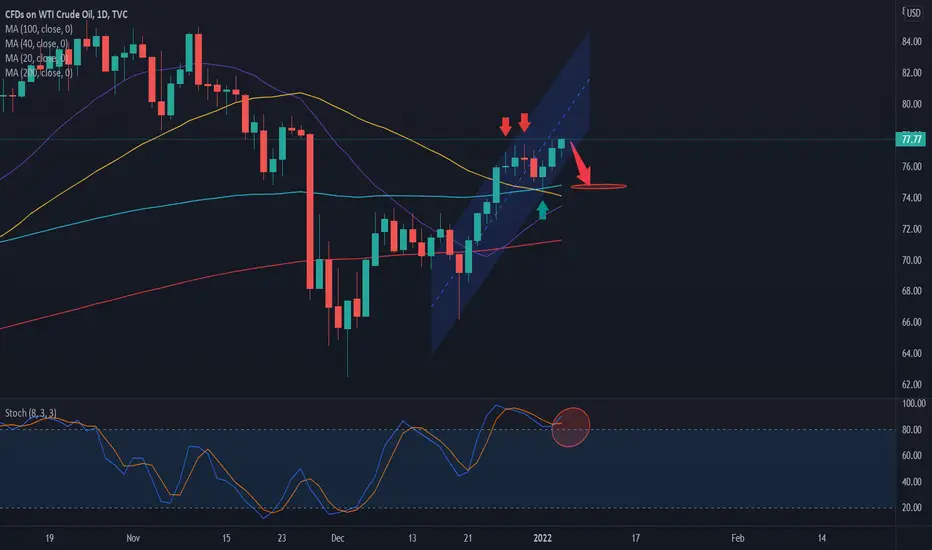
We have seen this asset rally recently on current news sentiment about Demand. On such prices rises we start to look short at applicable areas and create an ideal profit margin with our exit plan.
We are at reasonable resistance and moving off Key MA's. Stochs are high and we are looking for a move down to our Target area noted by the eclipse symbol.
Make sure your risk management is correct!
Usoilshort
USOIL is showing more weaknessUSOIL / 1H
Crude Oil has printed a wyckoff distribution indicating more down side is coming in the way.
Trade safe,
Trader Leo

US OIL shortFeel free to click on the follow button for more daily detailed analysis and please do ask any Q's should you have them.
Here we have our updated US OIL chart. We are looking short around the area noted by our directional arrow.
Look to take profit lower at comfortable support. This is a strong area that we hit previously.

US OIL with room to moveDon't forget to click on the follow button for more daily detailed analysis,
Here we have our updated US OIL charts.
We are still looking short further down to targets after our first ones were hit. RE enter shorts on rise up.
Price TGT is noted by our eclipse symbols on chart.

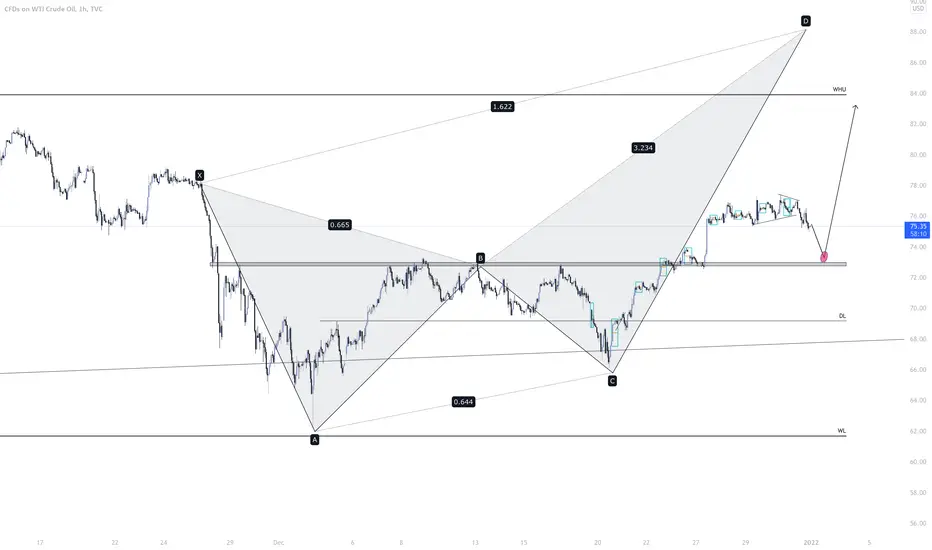
Potential Crab Forming 🦀 (Short then Long) USOIL - Daily Crab is still valid price is moving nicely up towards the D point.
However we had a big bullish push on the 27th that sent price into a consolidation leaving a large imbalance before price started to break to the downside again.
We have confirmation for shorts using the LTF BOS etc, once the markets open, I'll wait for price to settle and then I want to see price fill this imbalance and trade from the OB, S/D zone up to towards the weekly highs!
Such a beautiful zone of confluence! A++ trade if price gets there!
Let me know your thoughts!
** Disclaimer ***
These ideas I never trade until the end target with my initial lots, I focused on high probable entries with higher lots and use a specific partial taking strategy giving me a very high win rate and take most of my profits very early, I only leave a small % of my capital to run the entire trade. On the flip side im constantly monitoring LTF momentum and will close early if things change, these analysis's are for research purposes only.
USOIL- SellUSOIL will most likely to fall from here and will test the lower ascending trendline. One can sell from here for the target of 73 and 70 with stoploss of 77.41. On the contrary if it breaks the upper descending trendline the USOIL will becomes bullish once again.

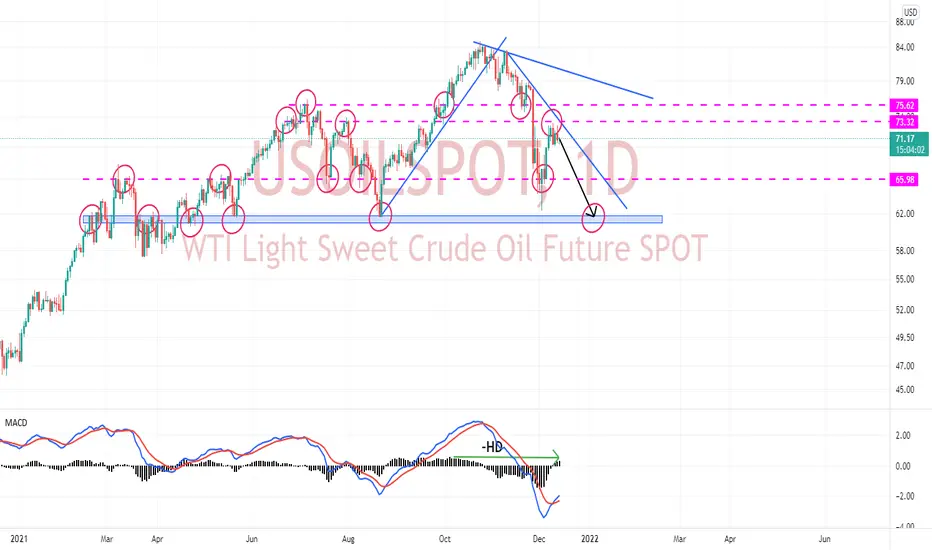
OIL: Huge Head & ShouldersWow! Could this be the right shoulders forming on OIL?
The remaining imbalance is being filled and we are creeping up into the main supply, if we see rejections, we could have a bearish move all the way down into the equal lows.
Traders, if you have your own opinion about this idea, write in the comments section, I always reply.
RISK DISCLAIMER:
Trading Crypto, Futures, Forex, CFDs, and Stocks involves a risk of loss.
Please consider carefully if such trading is appropriate for you.
Past performance is not indicative of future results.
Always limit your leverage and use a tight stop loss.
--------------------------------------------------------------------------------------------------------
Please like, subscribe, and share this idea with others!
--------------------------------------------------------------------------------------------------------

USOIL LONGS 📉📉📉Expect bullish price action on USOIL as price is rejecting orderblock m15 + imbalance m15/m30, we are in a bullish market strucutre and risk on market sentiment, we have bullish rejection on M15/M30 from this area so this means bulls are in power.
What do you think ? Comment below..

US OIL SHORTUSOIL SHORT SET UP...
Nice head and shoulders set up forming and a retest of the bullish drive up from the first trading day of this week is needed

USOIL short US oil just gave us a sell signal, as it looks like, in the 4 hours frame time.
we have a significant rejection with volume, what chart is telling us here is that get ready something will happen,
and I am sure that price will drop and sharply, it may sideway first but surly it will drop.
and now is a really good time to sell.
if we gave a look to the HMAs we would see them pretty far from the price, and it definitely can't stay that way for a long time, retests on them are a sure thing.

US OILUSOIL...
I still expect a pullback from oil but this consolidation has been extended making a breakout more likely! I favour the upside for a spike to liquidation and sell orders can be met (We closed above major support and the majority of retail are shorting the obvious H and Shoulders. I am not entering this...just for reference.

USOIL MARKET OVERVIEW USOIL
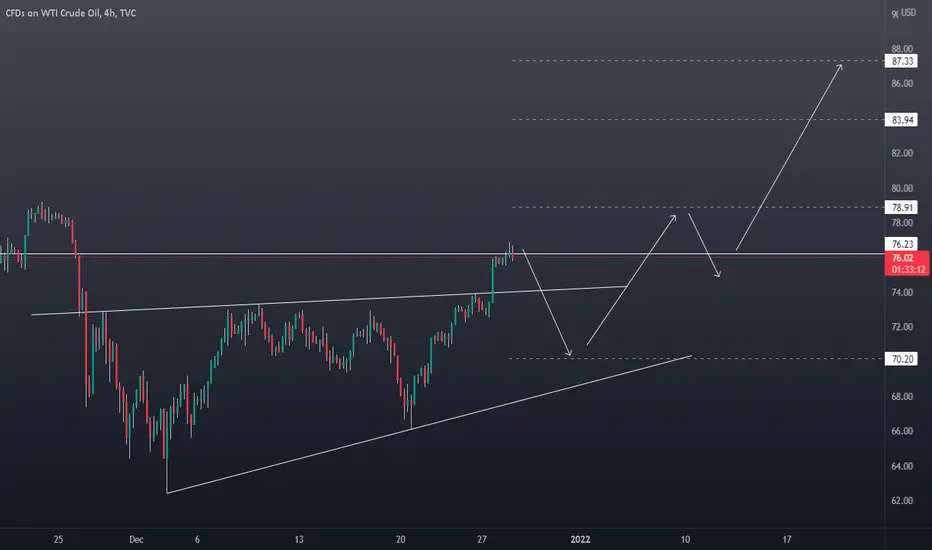
OIL has opened this trading week with a bullish impulse, currently oil is fighting on a bullish zone which requires a lot of drive to break through the zone. With many bank holidays and coming up to the final few trading weeks of the year I see oil pulling back to gather momentum to take it to the next high when the markets get back into the swing of things after the new year. Oil has broken out of a wedge which also needs testing before the next move...I expect dips back towards 70.70 before we see the real move coming.
I currently have a short running and the set up will be posted soon. I will not be longing oil until we see a large dip and clear rejections of 70.70.
OIL should be bullish into Q1 and Q2 with the rise of inflation...get ready.
USOIL LONGS INTO 80 📉📉📉Expect bullish price action on this commodity, price should reach 80$ per baril this year as we are in a huge bullish momentum on h4/d1 + santa claus rally that reflects a risk on market scenario
What do you think ? Comment below..

USOIL LONGS 📉📉📉Expect bullish price action on USOIL as price takes out liquidity on the retail trendline, rejected a nice M15 bullish orderblock. Price is in a bullish market strucutre and should rise because of the risk off market environment + bearish gap that should be filled on usoil, lets go for 3R.
What do you think ? Comment below..

The possibility of lower us oil pricesDue to the increase in oil reserves, oil prices can be expected to decrease.

USOIL SHORTS 📉📉📉Expect bearish price action on USOIL as we are in a bearish market structure on a H4 TF price is making lower highs and lower lows, rejecting a bearish breaker and re-testing 69-70 weekly low area.
What do you think ? Comment below..

USOIL Price TargetIf you haven`s shorted the top here:
Then you should know that USOIL seems to be heading to its major support at 60.40usd.

Potential 🦇USOIL - Potential Bat, I've shorted from the C point caught a lot of pips here, entered again on the BOS on the LTF, price may pull back from the DL but I'm looking to swing this down towards the .886 of the weekly pullback (Lots of confluence here for a PRZ)
Let me know your thoughts!

USOIL: Elliot Harmonic Trad 4HAccording to the five correction waves in the chart and the completion of the fourth wave, we expect the price to decrease to the specified level, which is wave a correction.

USOIL UPDATE SHORTS 📉📉📉We have strong bearish momentum on USOIL i dont think it is the best moment to close our short entries, we have a risk off market sentiment right now so we should expect bearish price action still...
I moved my stop loss to my entry so i have a risk free trade.
What do you think ?

USOIL SHORTS 📉📉📉Expect bearish price action on this chart as price rejected a bearish orderblock h4 + imbalance bearish fill, bearish market structure on h4 + price takes out liquidity above 72.00. We are going down into value areas 70 and 68
What do you think ? Comment below..

USOIL SHORTS ✅✅✅ Expect the price to drop from this area on a intraday basis, as we took liquidity above 72.000 area and old highs. A lot of bullish imbalances to be filled that were made on FOMC release yesterday.
What are your thoughts ? Comment below..
