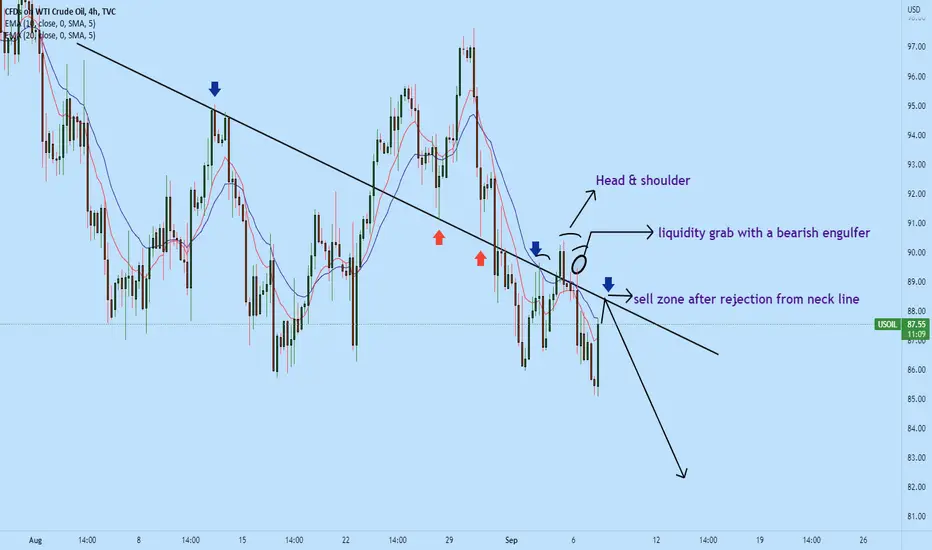
USOIL is in sell area!!USOIL (4H) is currently approaching to test the neckline of 4H head & shoulder. It is high probability that the price will have a rejection as we already have seen strong rejection from this important area of value with long bearish engulfer.
As the long-term trend is down, it is a high probability that the price will continue to drop as daily has a strong bearish price action as well
Smash the like button if you enjoy this content :)
Usoilsignal
USOIL possible short for 89.5025th August daily key reversal bar formed which made a new high closed off the low. supply zone 94.80 & 95.80 for short as well. stop loss 96.10, target 89.50. any how i will book profit at 91.50. while 89.25 ideal buying opportunity for long which is demand area.

USOIL neutral USOIL
Note: To reduce the risk on your balance
you have to use only 2% of your balance.
-
-
-
-
-
-❤️If you have any questions, please, ask me in the comment section.
Please, support my work with like, thank you!❤️.


USOIL possible sell zone!!USOIL ( 4H ) Currently in a downtrend we have last week price has just rejected this long-term resistance and has created a double top on the 4H. As the trend line is respected, we could see another drop in this instrument to the downside to the monthly support zone
Thank you for visiting this idea, Press the like button if you enjoy :)

WTI is in sell zone!!WTI has formed a daily doji on the last day of the trading week. After opening the new trading week we have seen so far a series of rejections with lower highs on the 4H. Last candle on 4H has formed a text book bearish engulfer with 20EMA retest and close back below. It is a high probability that WTI will continue to drop to the monthly support zone

USOIL possible sell zone!!USOIL (D) has broken out of daily support with a strong bearish engulfer. The price is already in a downtrend and it is possible that the price will drop to the monthly support level before creating upward movement. On the test of this previous support as resistance, if enough rejection is shown, a selling opportunity may arise.
Press the like button if you enjoy this content :)

👉 USOIL The main goal is to decline to support levels👉 USOIL The main goal is to decline to support levels
The emergence of an uptrend from a support level with a breakout of a downstream channel
❤️ If you find this helpful and want more FREE predictions on TradingView
. . . . . Please show your support
. . . . . . . . Click the 👍 LIKE button
. . . . . . . . . . . Leave your feedback below in the comments!
❤️ I use all my transactions in real trading in my account, my account has already reached Profitability:
1549.04%🙏!❤️
It's your turn!
Be sure to leave a comment and let us know how you see this opportunity and prediction.

USOIL Long: Bearish Butterfly, Tweezer Bottom & Fib ExtensionTrend: Upward
Candle Sticks: Tweezer bottom at the new LH.
Support & Resistance: Support at LH and Resistance at TP1 and TP2.
Fibonacci Retracement and Extension: Retracement level of the previous rally is around 0.6 and the next HH would be around 1.2-1.4

USOIL Short: Butterfly Pattern, Hammer & Inverted Hammer CandlesTrend: Bearish
Candle Sticks: Several Bearish Candles; hammer, inverted hammer, bearish engulfing, etc.
Support & Resistance: Price is testing current support.
Parallel Ascending Channel Support:

USOIL probability bullish for 108.8014th july daily key reversal bar indication for strength ahead. Demand zone 95.20-00, if price fails to hold it then next demand level 91.70. initial target 99.50 while longer term target 108.80.


USOIL probability bullish for 110.00#usoil, oil price fall from 121.00 like falling bricks and tested 97.00 strong support area. I Started predict fall from 121.00 for target 97.00. now oil has tested 97.00 & 94.20 strong support area. 7th July made a strong bullish bar broker previous day high. oil may take long around 96.00 & 95.00 for target 110.00 however 106.00 preliminary resistance may take partial profit taking while medium term target 110.00.

USOIL bearish for 103.00#usoil, oil forming weekly lower low and lower high. 109.80 and 110.80 supply zone for short, stop loss above 110.80 i.e 111.30 (more secure) for target 103.00.

June W.5: Medium-term trend signal!Hi friends, I hope y'all had a fantastic weekend and are ready to finish this month strong ;)
Today, we have 2 possible sell trades on this baby. Last week I shared a trade idea on this instrument and we missed the trade, however, the price didn't reach our take profit point which that gave us another opportunity to catch the bearish trend. This trend is derived from the monthly that is in the huge bullish half a bats level 2 formation that will either bearish bounce off or break the 8 m.a that hasn't been retested for 4-5 months to confirm the trend-continuation. So we looking forward to taking a counter-trend trade, but there are 2 possible scenarios that will determine in getting the trades or not.
Bulls: -If the price forms a bullish reversal pattern that leads it to bullish break and retest the Daily H&S Neckline 2 together with the 50 and bullish short-term m.a's, that will dis-confirm both trades.
Bears: -If the price bullish bounces of the Weekly Neckline 3/Daily H&S Neckline 2, 50 and 8 m.a's with a bearish reversal candle or pattern close, that will either trigger what I call an "H&S A-E.3 SELL signal or H&S B-E.1 SELL signal". That's the first trade signal. For the second trade signal, after the price has trigger the first trade and proceeds to drop and break and retest the 1st Daily Ke Lvl, that will trigger what I call an "H&S B-E.2 SELL signal" that will lead to a 2 level drop to the last take profit point. That drop will form a big double top on the weekly, and it be visible on the monthly as a mini reversal pattern.
That's it for today. I hope you found value in this trade idea. If you have a different concept in mind, feel free to share it in the comments section or in private, I'd love to know your thoughts!
Stay Blessed,
Doji-2k1.

USOILHello Traders, here is the full analysis for this pair, let me know in the comment section below if you have any questions, the entry will be taken only if all rules of the strategies will be satisfied. I suggest you keep this pair on your watchlist and see if the rules of your strategy are satisfied.
The way I told you, you have to trade like this and you will have more profit always and you will not be a loss.

June Week 4: USOIL Medium-term trend!Hi friends, I hope y'all had an awesome weekend and ready to tackle this week strong ;)
Today, we looking at a possible bearish trend here on the daily. This trend signal is derived from the monthly where the price is in the bullish half a bats L2 formation that will bounce off or retest the 8 m.a before continuing the patterns trend to its 3rd level. So we are currently anticipating a counter-trend, and when its done we'll hop on the main trend. Let us see how the bulls and bears might behave in either triggering our trade signal or dis-confirming it.
Bulls: -The price will dis-confirm our trade by forming a bullish reversal pattern that will lead the price to bullish break and retest 2nd Monthly Key Lvl (stop loss area) together with 50 m.a (light blue) and bullish crossed short-term m.a's (dark blue and red). If the price does that it will trigger the weekly's double bottoms signal and I'll share it here.
Bears: -The price will bearish drop for the head and shoulders trend together for the 200 m.a (that's visible on the Mt4 chart in white color) and short-term m.a's trend - probably after it has bullish bounced off the Daily H&S Neckline 2, 50 m.a, and bearish crossed short-term m.a's with a bearish reversal candle pattern. That will trigger what I call an "H&S A-E.3 signal".
That's it for today. I hope you found value in this. If you have a different perspective on this instrument, feel free to share it in the comments section or direct message me, I'd love to know your thoughts!
Stay Blessed,
Doji-2K1

The BIGGEST Inverse Head & Shoulders I have ever seen. USOILI just witnessed something truly amazing, USOIL just printed a MASSIVE bullish sign on the 1H chart.
But.....
Before we get all FOMO-ish and buy without a plan let's look at what we have on the table, before having a slice.
Price got to the strongest monthly resistance, which to no ones surprise also served as the giant chart pattern's neckline, with a triple job of a previous long term trendline.
After price squished all these resistances aside with a bullish reaction, a retest should set the stage for a lasting bull run, or so it seems....
Many people must have seen these bullish signs, which means manipulations might occur to push out as many as possible from the trade before the bull run.
Our safest point of entry will be to look for buy setups at the retest, and let probability do the rest.
If u found this remotely helpful to u , please drop me a like and a quick Sub, as this helps support my work and allows u get more content like this to come.
Thanks....please drop some constructive criticisms in the chat section, or u can leave some encouragement, I would be truly pleased.
Thanks my people....

USOIL Short Term Outlook |19-MayHolla,
Do you agree with my chart analysis? I expect a pullback until my sell line. My plan is to wait for candlestick structure as a confirming catalyst before opening a position.
Checklists;
1. Price must touch my entry zone
2. Price bar (4hr) must close below my zone after touching my entry zone.
3. i want to see candlestick pattern ( mostly pin bar or bearish engulfing candle) before looking for entry.
4. Chart pattern like rising wedge would me an added advantage
Will update intermittently...
Kings.

USOIL seems BullishAs per the MACD indicator, it is showing bullish momentum to me. D1 candle is also in Bullish. So I believe it may give us handsome profit. Follow the trend line of your stop loss and take profit.

US OIL MARKET BREAKDOWN USOIL moved volatile today with rallies to highs then a 400 pip pullback, Tensions in Russia are still raw and Ukraine have begun attacking petroleum sites on Russian soil which is a very brave move. The fall today was influenced by the DXY reversal albeit it isn't 100% influenced by it.
I mentioned weeks ago that $185 dollars a barrel is my target for USOIL and the way things are going it isn't out of reach. If you haven't read any of the financial warfare posts I recommend you do so to have a greater understanding of the current geopolitical situation.
Geopolitical situation in short:
Yesterday the FED raised interest rates but DXY had been climbing well before and price was factored in (we covered this in advanced) which is why we saw the drop instead of another climb higher. A V shape recovery has been made which is a VERY BULLISH sign and DXY should push higher. Since covid-19 the whole global economy has been printing money with no regard for the outcome but it fairness they needed to keep the economy floating. The FED state they have things under control but in reality they have no clue how to deal with this mess (30-45% of the US currency in circulation was printed in the last 2.5 years 'HUGE RED FLAG'. They are trying to tackle inflation by raising interest rates and this has a direct correlation with USOIL. When USOIL is this high it prints a global outlook and shows we are heading into recession.
Now as I sat down tonight to watch the news economist experts are predicting a global recession and it's down to Russia hmmmmmm... where have we heard that before? oh yeah in our financial warfare write ups. It's no coincidence, this was all called well in advanced and we knew Russia would be the scapegoat for this although there has been no coverage on the money printing.
DXY GOES UP, STOCK MARKET DROPS AND BUBBLE BURSTS! Recession is coming and USOIL at $185 a barrel will send it straight to us.
USOIL:
USOIL will bounce around a bit and the longer it takes to push higher the more chance there is of a dip. I will be looking for a swing trade in USOIL and I need it to dip to 104.70-50 before I entertain a swing long. 109.70 needs to break for a chance of pushing higher and 104.60 will act as the support. We have had a new high confirmed in this uptrend so there should be more bullishness to come. YOU MUST USE THE LINK BELOW TO KEEP FULL UP TO DATE WITH US!
We have two more predictions to come through.
BOYCOTT of Russian OIL and GAS
RECESSION

USOILpossible way for short position
.
.
.
This is Not Financial Advice
.
🧅JUST AN OPINION OF THE ONION.🧅

