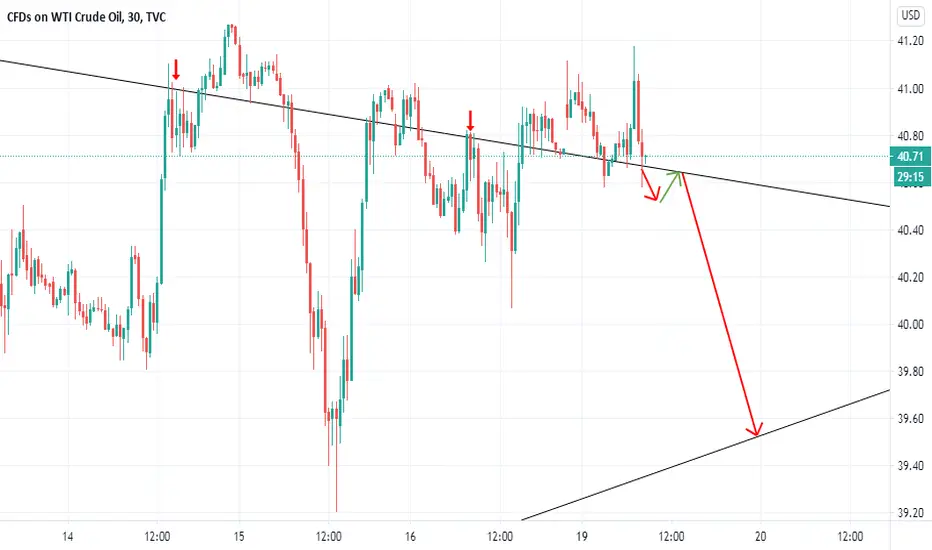
What i'd love to see on USOIL!Price broke my resistance trendline, turned it to a support then bought. Price is back to my trendline after creating successive lower highs and lowers lows. In confluence with that structure where price currently is on, my first bias is to short till otherwise. Probabilities lets see
Usoiltrend

What i'd love to see on USOIL!Price is still a little bit far from my trendline, buh if/when it gets there i would love to first see this if my trendline holds. lets see
US OIL is now BearishThis has been very steadily grinding downwards and is now entering a Bearish environment again. I think this will reject off the lower trendline that it broke yesterday, it is just below this now. From here I have set 3 targets for TP that can either be held or swing traded. If this does reject the trendline mentioned the SL can be just above this. I do think this could drop even further as indicated by the Fibonacci at 0.382 ($46.19) but it is very risky to hold a short and expect it to reach there.

What I'd love to see on USOIL!Price has been failing to turn my broken trend line resistance to support to continue its rally. If price breaks and closes below my trend line, it might be signalling the return of the bears. lets see
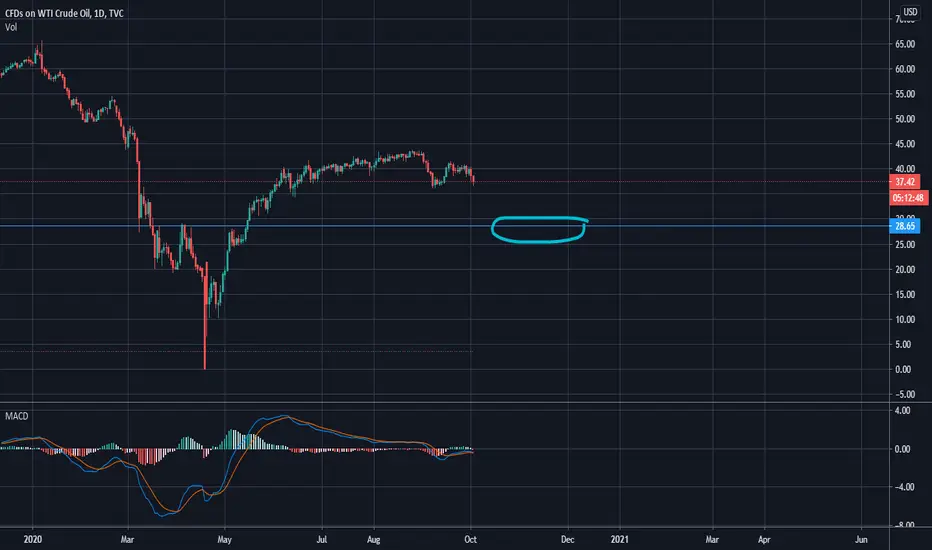
USOILIf countries over the world get a lockdown schools, there will be no bus drivings kids to school so my target area is @28$.
Of course, using risk management is a MUST.

CRUDE OIL (USOIL) DailyDates in the future with the highest probability for price direction reversals

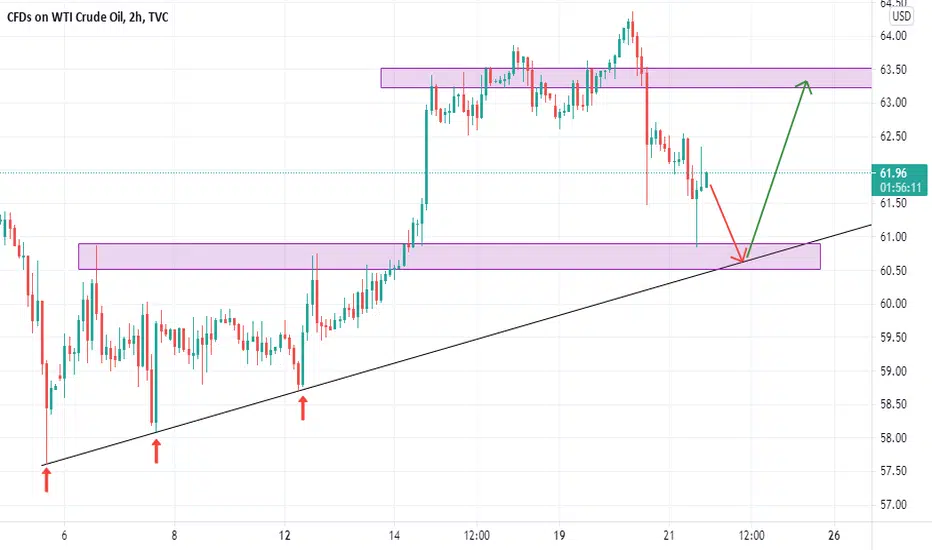
UOSIL ON FIREHi Traders;
Today I'm about to make huge profits from OIL.
On H1 we can see a start of an uptrend. I put my tp to 63.85.
Follow me for profits ;)
Benjamin

Trading USOIL this week - A look aheadFrom the chart we see that back in June USOIL broke out of the lower boundary on my original consolidation wedge. In mid-July it repeated and created a new bottom boundary which I marked. In early August it retested that boundary. It appears we still have further south to go to probably the mid $51 area and it will more than likely stay within the new wedge for consolidation. I see this pattern continuing into October, possibly November before we get a new directional change. Trade cautiously and always use Stop Losses. Best of luck my fellow oil traders!
Can US OIL push up past resistance? (DAILY) USOIL has been on a great run, however we have approached a make or break point. Can OIL push past resistance or will we fall back down to our temporary safe zone highlighted?

USOIL 4 hr Trend AnalysisWe are targeting the green trend line and looking for price action to break below the yellow support zone for confirmation. The condition to this strategy is that price action does not break above the red resistance zone. TVC:USOIL

Short USOThe chart of USO looks much overbought..
Buy Zone: $13.32 to $13.59
Stop loss: daily clsoe above $14
Target: $12.25 to $12.04
You can Buy DWT , SCO or any others that have Inverse relation with USO or USOIL

USOIL I Think We're Getting Close - Time & Price AnalysisMy best guess is the green highlighted area shouldn't be viewed as a "Bounce" zone.
Instead, I think this will be the area where accumulation will take place.
It'll take a few weeks and a few failed breakouts, so don't worry about missing the bottom. You'll have a few opportunities.
______________________________________________________________________________________________________________________________________
I've been working on "Time" more than "Price" for the last year. I got tired of pussy-footing around in my analysis; "It should bounce around this level, maybe it will maybe it won't."
Time is much more elusive than price, but I'll give it a go:
______________________________________________________________________________________________________________________________________
Price: Between $49.00 and $46.00 a sideways to slightly lower accumulation zone will form in this range. (Typically don't like to give such a wide range ($3) but we just moved $27 in 7 weeks so giving myself some wiggle room)
Time: From today (Nov 23rd) until Dec 15th, it's likely oil will be in accumulation as it moves sideways to slightly lower. By December 13th we should see some serious signs of a reversal. The reversal should last at a minimum until Jan 11th.
Prior Oil Posts:

USOIL - 350 Pips + OpportunityUSOil has broken it's 200 ema on the 4 hour chart and prices jumped up.
If it does find support at current levels, we can expect USOil to rise even further anywhere till 73-74.


Crude Oil possible correction to setupMy last call on Crude smashed the target well above 1,000 pips, at the moment it is almost testing its multi months channel top, however trend still is very much strong, i am looking for a linear compression to be forming at the top of the channel. Expecting a correction there so I could look for sell setups, keep eyes on this market for a possible sell swing trade.
Happy Trading.

USOIL - Forecast-45.45 level is very important level.
-US-H.Harvey sliding it even lower.
Good luck!

USOil - Watchout for the break - 200 pips+ OpportunityUSOil is currently in a consolidation zone. Keep and eye on it for when it breaks out.
I am still neutral to whether it can go up or down. However, I do know that once it breaks out it will have a big move.
Always trade after your own analysis as well as money manage properly.
Happy trading!

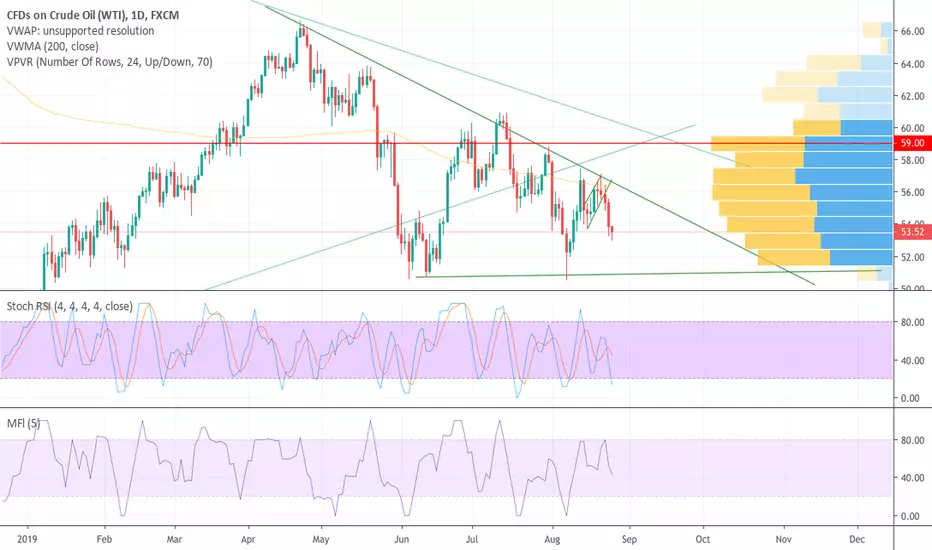
USOIL Good to short againPair Direction Time frame Entry Price Reason Stop Loss TP-1 TP-2
USOIL Sell Limit 4H 53.3 Fibo-0.768,Pressure Level 53.80 51.80 50.10
USOIL Sell Limit 4H 53.8 Fibo-0.768,Pressure Level 54.40 51.80 50.10
USOIL Sell Stop 4H 52.7 Break Support Level 53.30 51.80 50.00

USOIL Still bearishHi traders!I hold a point:Good charts does not need more words to explain! Good luck!


usoil short first . what a pity .here can not use chinese.In July 2015. Crude oil has reached Andrew fork Central Line position. Rebound. But is very small. In this position again to start a sell-off. Are you ready

